GU-Tue-27/05/25 TDA-Great pullback, good structure is forming!Analysis done directly on the chart
Follow for more, possible live trades update!
Consistency, show up daily is not easy. Many
in fact will quit. If you want to really get good
at something you need to put into hard work.
Short cuts will benefit short term, but long term
it will cost you!
Not financial advice, DYOR.
Market Flow Strategy
Mister Y
GBPUSD_SPT trade ideas

GBPUSD Trade IdeaThe GBPUSD pair is showing a strong bullish trend on the 4-hour chart. However, the price currently looks overextended. This suggests the market may be due for a corrective pullback.
I’m watching for a pullback into a discounted zone near the fair value gap.
If the price moves back into this zone, I’ll look for a bullish break of market structure as a signal to enter long.
This plan emphasizes patience and the importance of waiting for a favorable entry rather than chasing an extended move. As always, this is my personal strategy and not financial advice. Proper risk management and discretion are essential.

GBPUSD TECHNICAL REVERSAL SHORT FORECAST Q2 W22 D27 Y25GBPUSD TECHNICAL REVERSAL SHORT FORECAST Q2 W22 D27 Y25
🔥👀TECHNICAL REVERSAL HOT PICK
Professional Risk Managers👋
Welcome back to another FRGNT chart update📈
Diving into some Forex setups using predominantly higher time frame order blocks alongside confirmation breaks of structure.
Let’s see what price action is telling us today!
💡Here are some trade confluences📝
✅Weekly order block
✅15' order block
✅Intraday bearish breaks of structure
✅Tokyo ranges to be filled
🔑 Remember, to participate in trading comes always with a degree of risk, therefore as professional risk managers it remains vital that we stick to our risk management plan as well as our trading strategies.
📈The rest, we leave to the balance of probabilities.
💡Fail to plan. Plan to fail.
🏆It has always been that simple.
❤️Good luck with your trading journey, I shall see you at the very top.
🎯Trade consistent, FRGNT X

Trendline liquidity Bos + fvg
After the market has taken out the trendline liquidity it will break with a long candle and most of the time it determines the direction of the market

GBP/USD – Pullback Buy from Key Support Zone | Strong Trend Back📌 Fundamental Summary:
GBP (British Pound):
Slightly weakened – Bank of England is turning dovish, signaling potential rate cuts.
Retail Sales and GDP indicate slowing growth.
Inflation remains above target, but is gradually declining.
USD (US Dollar):
Strong fundamental backdrop – Fed maintains high interest rates, inflation is still elevated.
US labor market is solid (low unemployment, strong NFP numbers).
➡️ Overall: Strong USD, Weak GBP → Fundamentals support short-term bearish pressure on GBP/USD.
However, technical structure remains bullish → continuation is likely after a corrective pullback.
🧭 Technical Analysis – H1 Confluence:
✅ 1. Trend:
Clear uptrend (HH + HL) confirmed on all major timeframes.
✅ 2. Trendline Support:
Rising trendline structure supports the entire move.
✅ 3. Fibonacci Retracement:
38.2–50% retracement zone at 1.3440–1.3480 offers ideal entry.
✅ 4. EMAs:
Price is above all EMAs (20/50/100/200) – strong bullish signal.
✅ 5. Support/Resistance Levels:
Daily close from April 28th and H1 structure confirm this zone as valid support.
📈 Conclusion:
This setup combines a strong multi-timeframe uptrend with fundamental awareness of GBP's weakness. If the pullback confirms, the potential for a trend continuation is high.
⚠️ Disclaimer:
This content is not financial advice. It is for educational and analytical purposes only. Trading carries risk and can lead to capital loss. Please conduct your own analysis or consult a licensed professional.

GBPUSD sell after hit FVG 1.35618GBPUSD sell after hit FVG 1.35618 Going to fibretracemen buy again my strategy analysis is free for you😊

GBPUSD COT and Liquidity AnalysisHey what up traders welcome to the COT data and Liquidity report. It's always good to go with those who move the market here is what I see in their cards. I share my COT - order flow views every weekend.
🎯 Longs and shorts decreasing but overal maintained bullish exposure 58% which is not much but seems to me like Key level will be reached..
📍Please be aware that institutions report data to the SEC on Tuesdays and data are reported on Fridays - so again we as retail traders have disadvantage, but there is possibility to read between the lines. Remember in the report is what they want you to see, that's why mostly price reverse on Wednesday after the report so their cards are hidden as long as possible. However if the trend is running you can read it and use for your advantage.
💊 Tip
if the level has confluence with the high volume on COT it can be strong support / Resistance.
👍 Hit like if you find this analysis helpful, and don't hesitate to comment with your opinions, charts or any questions.
Analysis done on the Tradenation Charts
Disclosure: I am part of Trade Nation's Influencer program and receive a monthly fee for using their TradingView charts in my analysis.
"Adapt what is useful, reject what is useless, and add what is specifically your own."
— David Perk aka Dave FX Hunter ⚔️

GBP/USD Weekly zone!The price is currently located at a strong weekly zone, where sellers have their stop-losses placed above it, and buyers have pending buy orders just above the same level.
This creates a high probability that big players will push the price above the zone to trigger the stop-losses of sellers and activate the buy positions of those waiting to enter long.
What almost always happens next is the following:
The price then drops back below the zone, taking out the buyers as well.
That’s why at strong zones on higher timeframes, a false breakout is often expected.

My idea on GB/USDMy idea on GBP/USD
The current resting point where price seem to be creating continuation structure already we have 1 bullish confirmation.

Bullish movement The market is in bullish momentum observed from monthly to daily. A drawback(retest) is anticipated and a continuation to the upside expected.

Uptrend The price is expected to consolidate above the support level and then continue the uptrend. If the price breaks through the support level, a continuation of the downtrend is likely.

GBPUSD⏳ WAIT TO SELL – GBP/USD
📉 We're watching GBP/USD closely for a sell opportunity, but it’s not the right time yet.
🧠 Be patient and let price action come to our zone of interest before entering.
💡 This setup requires confirmation — avoid jumping in prematurely.
Stay alert. Signal will be updated once conditions align.
GBP/USD - POTENTIAL RETRACEMENT SETUP (15 MIN CHART)Market Structure :
Price made a strong bullish move and is now showing signs of a retracement from a clear supply zone around the recent highs. The impulsive leg is being respected, and the market has started pulling back from the top.
Key Technical Points:
Supply Zone marked where price reversed aggressively.
Fibonacci retracement levels drawn from the swing low to the swing high.
Price currently sitting between the 38.2% and 50% retracement zone.
The 61.8% - 78.6% zone, along with ascending trendline support (in orange), creates a confluence area for a possible bullish reaction.
Two potential entry zones are highlighted:
1. Near the trendline and fib golden zone
2. Deeper retracement near OB demand zone and the 78.6% level.
Bias:
Bullish continuation if price respects the trendline and demand zones. Waiting for confirmations like bullish engulfing or break of structure from lower timeframes before entry.
Risk Management:
SL below demand zone. TP targeting retest of supply zone or potential breakout depending on momentum

CHECK GBPUSD SIGNAL READ CAPTAINgbpusd signal technical analysis satup 👇🏼
(gbpusd ) sell zone
( TRADE SATUP)
ENTRY POINT (1.35650) to (1.35550) 📊
FIRST TP (1.35400)
2ND TARGET (1.35100) 📊
LAST TARGET (1.34800) 📊
STOP LOOS (1.35900)❌
FALLOW RISK MANAGMENT

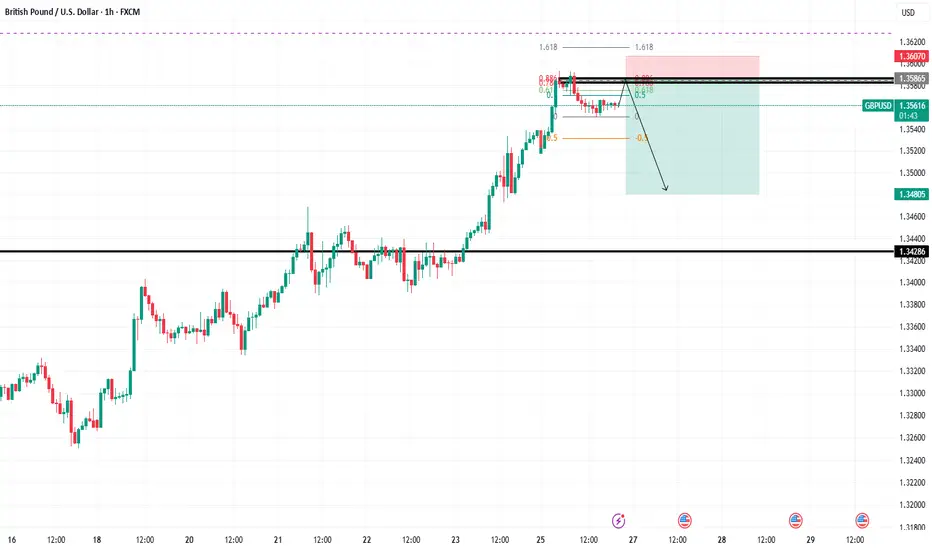
GBP/USD manipulation going on right now ??gbpusd had a good rise the last few weeks/months, now its time to pay attention.
the price is now ranging,. let me tell you what i think.
a little bit higher there is a imbalance in the chart. for me and many others thats a reason to short.
why do i think manipulation is going on?
for the big people in order to go short they need to attract buyers, so how do they do that? they go long, they build up long orders to attract more buyers so the price doesnt go down and the shorts can get filled. thats what happening right now in my opinion. (i can be wrong)
also the rsi is overbought (indicating downside could come )
in my opinion the price will be ranging for a week of 2, after that is wil go a bit higher to eventually come down big time , (like 5% or more)
here is the setup i will take.
no financial advice, just my thoughts

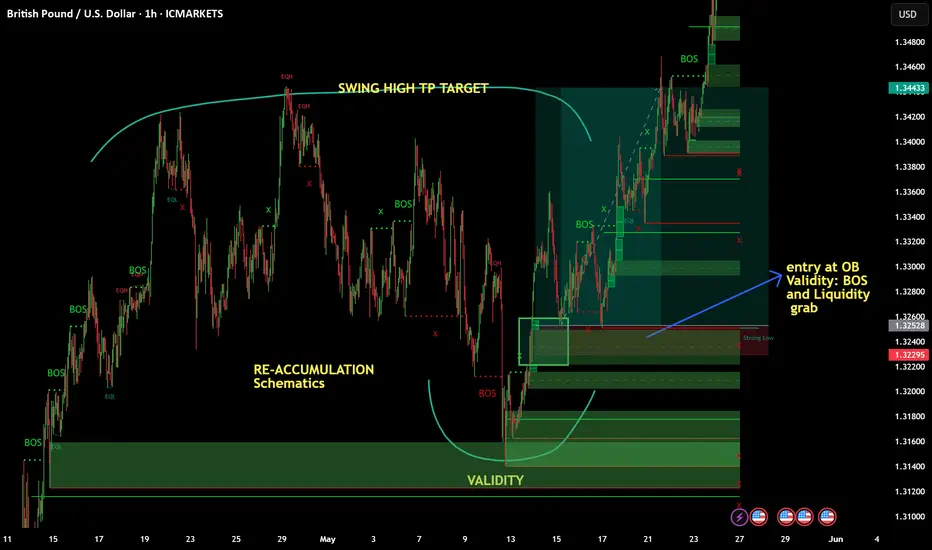
May 25 2025- BUY TRADE LIMIT order activated GBPUSDHi folks!
-Been busy lately so I dont consistently post. Attached here is the chart of GBPUSD, A classic re-accumulation in 1H timeframe. Before I got this trade It took me 1 week to monitor the schematics of this wyckoff re-accumulation. It came to fruition last Thursday so I monitor for buy Limit order entry within 1H to 15 min. charts. Validity here was the liquidity grab of re-accumulation ( check the image for clear caption).
TP: 8RR
Risk: 0.05% of Account
-Proprietary Trader
#wyckoff
#supplyanddemand
#refinement
GBP/USD Buy Limit Strategy – Pullback Opportunity at Key BreakouThis trade setup proposes a Buy Limit at 1.3520, targeting a pullback entry after a strong bullish breakout visible on the M30 chart. The 1.3520 level aligns with a recent consolidation and breakout zone, offering a high-probability re-entry spot.
With a tight 45-pip stop-loss and a 100-pip take-profit, this setup delivers a favorable risk-to-reward ratio of 1:2.2. If the pullback holds at this level, price is expected to resume upward momentum toward 1.3620.

GBPUSD expectation 1HGBPUSD is busy in a retracement and could use the trend line (for 'most likely') as a support and bounce back up to destination, or use the main support to do so. Price momentum is slowing down as we reach midday UK session and as we start to prepare for the US one, this will decide which way it will go. Another possibility is price reversing between the two, round half way, heading into a buy. We have to wait to see what price does in order to understand how to plan the entry.

LETS SEND GBPUSD BACK TO EXILEbase on what Has occurred from these zone in the past, im expecting history to repeat itself again simply because these is MonthlyTF chart. FX:GBPUSD recent bullish movements will cease and we are going to call it a retest.

GBP/USD - Day Trading Analysis With Volume ProfileOn GBP/USD , it's nice to see a strong buying reaction at the price of 1.35000.
There's a significant accumulation of contracts in this area, indicating strong buyer interest. I believe that buyers who entered at this level will defend their long positions. If the price returns to this area, strong buyers will likely push the market up again.
Uptrend and high volume cluster are the main reasons for my decision to go long on this trade.
Happy trading
Dale

Sell gbpusdHere gbpusd strong opportunity comes
Reached to our first selling level mostly chances to drop minimum 300 pips weekly and daily too overbought pair

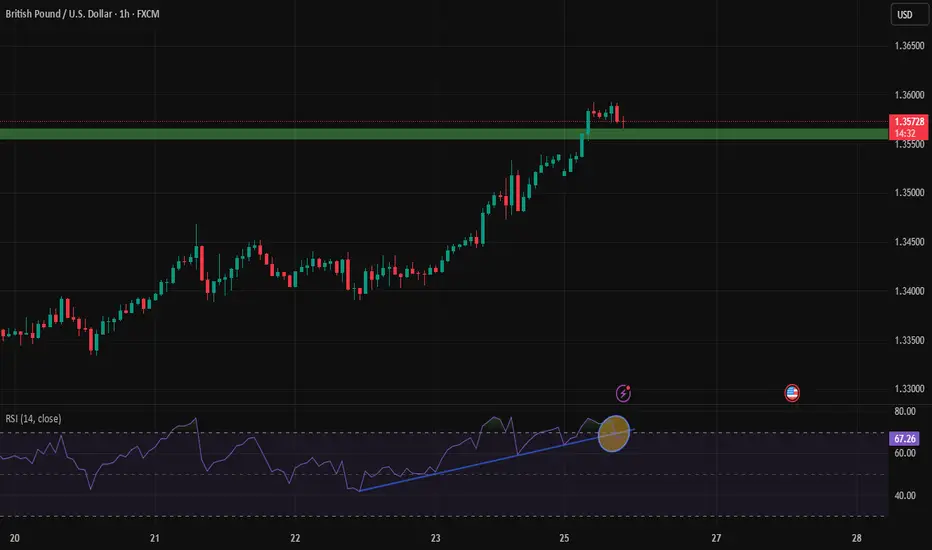
GBP-USDThe pound to dollar has also broken the trend line on the RSI and we can look for sales with confirmation on the chart.
Market Analysis: GBP/USD RalliesMarket Analysis: GBP/USD Rallies
GBP/USD started a fresh increase above the 1.3520 zone.
Important Takeaways for GBP/USD Analysis Today
- The British Pound is eyeing more gains above the 1.3600 resistance.
- There is a key bullish trend line forming with support at 1.3540 on the hourly chart of GBP/USD at FXOpen.
GBP/USD Technical Analysis
On the hourly chart of GBP/USD at FXOpen, the pair formed a base above the 1.3350 level. The British Pound started a steady increase above the 1.3450 resistance zone against the US Dollar, as discussed in the previous analysis.
The pair gained strength above the 1.3500 level. The bulls even pushed the pair above the 1.3550 level and the 50-hour simple moving average. The pair tested the 1.3585 zone and is currently consolidating gains.
GBP/USD is stable above the 23.6% Fib retracement level of the upward move from the 1.3390 swing low to the 1.3586 high. There is also a key bullish trend line forming with support at 1.3540.
It seems like the bulls might aim for more gains. The RSI moved above the 60 level on the GBP/USD chart and the pair is now approaching a major hurdle at 1.3600.
An upside break above the 1.3600 zone could send the pair toward 1.3650. Any more gains might open the doors for a test of 1.3720. If there is a downside correction, immediate support is near the 1.3540 level and the trend line.
The first major support sits near the 50% Fib retracement level of the upward move from the 1.3390 swing low to the 1.3586 high at 1.3485. The next major support is 1.3450. If there is a break below 1.3450, the pair could extend the decline. The next key support is near the 1.3390 level. Any more losses might call for a test of the 1.3345 support.
This article represents the opinion of the Companies operating under the FXOpen brand only. It is not to be construed as an offer, solicitation, or recommendation with respect to products and services provided by the Companies operating under the FXOpen brand, nor is it to be considered financial advice.
