GBPUSD.UK 10-Year Gilt Yield and Interest Rate
UK 10-Year Gilt Yield: The yield stands at 4.48% as of June 25, 2025, after touching a recent high of 4.73%. This elevated yield reflects persistent inflation and cautious market expectations for Bank of England policy.
Bank of England Interest Rate: The current policy rate is 4.25%. Markets expect potential cuts in August and November, possibly bringing the rate to 3.75% by year-end, but the BoE remains cautious due to inflation still above target.
The US dollar is at multi-year lows, pressured by political uncertainty around the Fed, rising expectations for rate cuts, and a broad shift in global risk sentiment away from the dollar
Investors remain cautious due to fiscal policy worries, including the impact of US government spending and debt levels, as well as geopolitical risks.
The market currently prices in two 25-basis-point Federal Reserve rate cuts by the end of 2025, likely in September and December, which influences bond yields.
The 10-year yield is a key benchmark for mortgage rates, corporate borrowing costs, and is often considered the "risk-free rate" in financial valuations
The US10Y stands at 4.29%-4.33%
and interest rate remains 4.25-4.5%
The 10-year yield remains a critical indicator of US economic health, inflation expectations, and monetary policy stance.
#GBPUSD
GBPUSD_SPT trade ideas

GBPUSD TRADE SETUPWait for Retest the entry level and Bullish momentum candle then take a trade for Buy otherwise skip this setup

GBPUSD Will Go Up! Buy!
Take a look at our analysis for GBPUSD.
Time Frame: 8h
Current Trend: Bullish
Sentiment: Oversold (based on 7-period RSI)
Forecast: Bullish
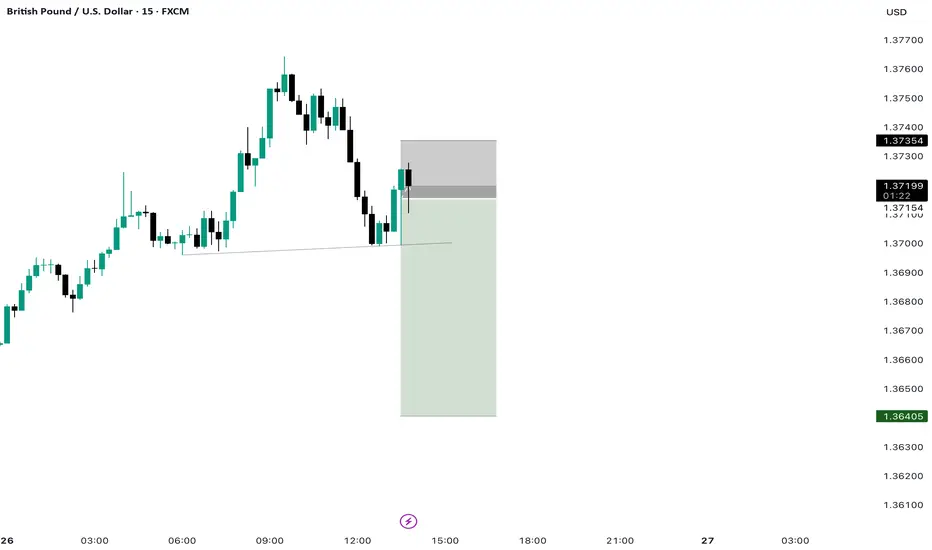
The market is on a crucial zone of demand 1.370.
The oversold market condition in a combination with key structure gives us a relatively strong bullish signal with goal 1.378 level.
P.S
Please, note that an oversold/overbought condition can last for a long time, and therefore being oversold/overbought doesn't mean a price rally will come soon, or at all.
Disclosure: I am part of Trade Nation's Influencer program and receive a monthly fee for using their TradingView charts in my analysis.
Like and subscribe and comment my ideas if you enjoy them!

GBPUSD📌 GBPUSD – Scenario-Based Plan
The first level I’ve marked is a short-term zone.
If we get a strong buy signal there with good R/R, I’ll enter and trail aggressively.
The second level is a stronger demand zone and a better area for potential long setups.
❗️Remember: These are just scenarios — not predictions.
We stay ready for whatever the market delivers.

Exclusive: GBP/USD Swing Heist – Limited-Time Opportunity!🏴☠️ GBP/USD HEIST ALERT: Bullish Loot Grab Before the Cops Arrive! 🚨💰
🌟 Attention, Market Pirates & Profit Raiders! 🌟
"The vault is unlocked—time to swipe those pips!"
🔥 THIEF TRADING STRATEGY (Swing/Day) 🔥
Based on high-risk, high-reward technical & fundamental analysis, here’s the master plan to plunder GBP/USD ("The Cable")!
📈 ENTRY (Bullish Heist Zone)
"The vault is OPEN!" – Long at any price, but for precision:
Buy Limit orders preferred (15m-30m timeframe).
Pullback entries from recent swing lows/highs = sneakiest loot grab!
🛑 STOP LOSS (Escape Route)
Thief SL: Nearest swing low (4H chart).
Adjust based on: Risk tolerance, lot size, & number of orders.
"A good thief always has an exit plan!"
🎯 TARGETS
1.37500 (or escape early if the cops 🚓 (bearish traps) show up!).
Scalpers: Only long-side raids! Use trailing SL to lock profits.
💥 WHY THIS HEIST? (Bullish Momentum)
Technicals + Fundamentals align for a potential breakout.
Overbought? Risky? Yes—but the best loot is guarded!
📢 TRADING ALERT (News & Risk Mgmt)
Avoid new trades during high-impact news (volatility = police sirens!).
Trailing stops = Your getaway car. Protect profits!
🚀 BOOST THE HEIST!
💖 Hit "Like" & "Boost" to fuel our next raid!
💬 Comment your loot tally below!
"Stay sharp, thieves—see you at the next heist! 🤑🔥"

GBP/USD Launch to Fresh 3-Year HighsGBP/USD had a mild pullback earlier in the morning until the 1.3593 level came in to help set the lows. I had looked at that price in yesterday's post and that's held the lows for today ahead of another strong breakout with the pair pressing into fresh three-year highs.
Chasing breakouts can be tough especially when they've already started, so at this point there's a couple of spots of support that bulls can defend to keep the door open for shorter-term trend continuation purposes.
The price of 1.3639 is an aggressive level of support potential, and below that is 1.3616. If bulls fail to hold support at those prices, the bullish momentum that's driving the current breakout would come into question and the door would open to deeper retracement potential. In that scenario, there may be more attractive options to work with USD-strength. - js

GBPUSD SHORT POSITION I think the price could go down from this range because I think this is a key point.

Technical + Fundamental Alignment: GBPUSD Short in PlayGBPUSD ( FX:GBPUSD ) is moving near the Resistance zone($1.354-$1,350) and has managed to break the Support line .
In terms of Elliott Wave theory , it seems that GBPUSD has completed the Zigzag Correction(ABC/5-3-5) , we can expect the next five bearish waves .
--------------------------------------------------------
Fundamental Analysis
1-Weak UK Economic Data:
Recent reports including Retail Sales, Industrial Output, and PMIs have come in below expectations.
Labour market is softening, and wage growth is decelerating.
2-Dovish Expectations for BoE:
With inflation cooling down, the Bank of England is expected to hold or even cut rates soon, reducing support for the pound.
3-Stronger USD Outlook
Despite some weaker U.S. data, the Fed maintains a hawkish stance. U.S. retail sales and inflation still support the dollar overall.
4-UK Political Risk
Upcoming UK elections on July 4 are adding uncertainty and downside risk to GBP.
--------------------------------------------------------
I expect GBPUSD to attack at least the Support lines based on the above explanation.
Targets: 1.3
1)1.3353 USD =>Risk-To-Reward: 1.51
2)1.3315 USD =>Risk-To-Reward: 2.00
Note: Stop Loss(SL): 1.3549 USD
Please respect each other's ideas and express them politely if you agree or disagree.
British Pound / U.S Dollar Analyze (GBPUSD), 1-hour time frame.
Be sure to follow the updated ideas.
Do not forget to put a Stop loss for your positions (For every position you want to open).
Please follow your strategy and updates; this is just my Idea, and I will gladly see your ideas in this post.
Please do not forget the ✅' like '✅ button 🙏😊 & Share it with your friends; thanks, and Trade safe.

GBPUSD GBP/USD: 10-Year Bond Yields, Interest Rates, and Upcoming Monetary Policy News (June 2025)
1. 10-Year Bond Yields
UK 10-Year Gilt Yield:
As of June 24, 2025, the UK 10-year government bond yield is 4.51%, having recently climbed as high as 4.73%—the highest since April—driven by hotter-than-expected inflation data.
Markets have scaled back expectations for Bank of England (BoE) rate cuts due to persistent inflation, particularly in core and services sectors.
US 10-Year Treasury Yield:
The US 10-year Treasury yield ended June 20, 2025 at 4.38%.
2. Central Bank Interest Rates
Bank of England (BoE) Rate:
The BoE held its policy rate steady at 4.25% at its June 19 meeting, with a 6–3 vote to maintain rates. Three members favored a 0.25% cut to 4.00%.
Inflation in the UK slowed to 3.4% in May (from 3.5% in April), but core and services inflation remain elevated, making policymakers cautious about cutting rates too soon.
US Federal Reserve Rate:
The Federal Reserve kept its key rate in a range of 4.25%–4.50% at its June 2025 meeting and signaled the possibility of two rate cuts later this year, but with ongoing uncertainty about the timing.
3. Upcoming Monetary Policy News (Late June–July 2025)
Bank of England:
The BoE is expected to remain cautious, with markets now pricing in only 34 basis points of cuts for 2025 (down from earlier expectations of two cuts this year).
Economists expect a possible rate cut in August if inflation and wage growth show clearer signs of easing.
Federal Reserve:
The Fed continues to signal a data-dependent approach, with two cuts still possible in 2025 if inflation moderates and growth slows as projected.
Key Data to Watch:
UK: Flash PMIs (Thursday) for signs of economic momentum or weakness.
US: PCE inflation and labor market data for Fed policy clues.
Summary Table
Metric/News UK (GBP) US (USD)
10-Year Bond Yield 4.51% (recent high: 4.73%) 4.38%
Policy Interest Rate 4.25% 4.25%–4.50%
Next Central Bank Decision Possible cut in August Two cuts possible in 2025
Key Drivers Sticky core/services inflation Inflation, growth, Fed outlook
Key Takeaways
The UK 10-year gilt yield remains above the US 10-year yield, supporting GBP/USD in the near term.
The BoE is holding rates steady but may cut in August if inflation data softens further.
The Fed is also on hold, with possible cuts later in 2025, making upcoming inflation and labor data crucial for both currencies.
Both central banks are in a wait-and-see mode, with markets closely watching economic data and policy signals for direction.
#GBPUSD

GBPUSD I Montly CLS I KL WOB I Model 1Hey, Market Warriors, here is another outlook on this instrument
If you’ve been following me, you already know every setup you see is built around a CLS Footprint, a Key Level, Liquidity and a specific execution model.
If you haven't followed me yet, start now.
My trading system is completely mechanical — designed to remove emotions, opinions, and impulsive decisions. No messy diagonal lines. No random drawings. Just clarity, structure, and execution.
🧩 What is CLS?
CLS is real smart money — the combined power of major investment banks and central banks moving over 6.5 trillion dollars a day. Understanding their operations is key to markets.
✅ Understanding the behavior of CLS allows you to position yourself with the giants during the market manipulations — leading to buying lows and selling highs - cleaner entries, clearer exits, and consistent profits.
📍 Model 1
is right after the manipulation of the CLS candle when CIOD occurs, and we are targeting 50% of the CLS range. H4 CLS ranges supported by HTF go straight to the opposing range.
"Adapt what is useful, reject what is useless, and add what is specifically your own."
— David Perk aka Dave FX Hunter ⚔️
👍 Hit like if you find this analysis helpful, and don't hesitate to comment with your opinions, charts or any questions.

Bullish rise off pullback support?The Cable (GBP/USD) is falling towards the pivot which is a pullback support and could bounce to the 1st resistance.
Pivot: 1.3503
1st Support: 1.3455
1st Resistance: 1.3616
Risk Warning:
Trading Forex and CFDs carries a high level of risk to your capital and you should only trade with money you can afford to lose. Trading Forex and CFDs may not be suitable for all investors, so please ensure that you fully understand the risks involved and seek independent advice if necessary.
Disclaimer:
The above opinions given constitute general market commentary, and do not constitute the opinion or advice of IC Markets or any form of personal or investment advice.
Any opinions, news, research, analyses, prices, other information, or links to third-party sites contained on this website are provided on an "as-is" basis, are intended only to be informative, is not an advice nor a recommendation, nor research, or a record of our trading prices, or an offer of, or solicitation for a transaction in any financial instrument and thus should not be treated as such. The information provided does not involve any specific investment objectives, financial situation and needs of any specific person who may receive it. Please be aware, that past performance is not a reliable indicator of future performance and/or results. Past Performance or Forward-looking scenarios based upon the reasonable beliefs of the third-party provider are not a guarantee of future performance. Actual results may differ materially from those anticipated in forward-looking or past performance statements. IC Markets makes no representation or warranty and assumes no liability as to the accuracy or completeness of the information provided, nor any loss arising from any investment based on a recommendation, forecast or any information supplied by any third-party.

GBP/USD could drop 300 pips to 1.3443!1). Market sentiment is at 1.3443. 2). Wave 5 overbought! 3). Price Volume is dropping. 4). Banks are selling! 5). Price is hitting a lot of resistance at the 200% fib level!

Major resistance ahead?GBP/USD is rising towards the resistance level which is an overlap resistance and could reverse from this level to our take profit.
Entry: 1.3535
Why we like it:
There is an overlap resistance level.
Stop loss: 1.3449
Why we like it:
There is a pullback resistance level that lines up with the 161.8% Fibonacci extension.
Take profit: 1.3449
Why we like it:
There is a pullback support level.
Enjoying your TradingView experience? Review us!
Please be advised that the information presented on TradingView is provided to Vantage (‘Vantage Global Limited’, ‘we’) by a third-party provider (‘Everest Fortune Group’). Please be reminded that you are solely responsible for the trading decisions on your account. There is a very high degree of risk involved in trading. Any information and/or content is intended entirely for research, educational and informational purposes only and does not constitute investment or consultation advice or investment strategy. The information is not tailored to the investment needs of any specific person and therefore does not involve a consideration of any of the investment objectives, financial situation or needs of any viewer that may receive it. Kindly also note that past performance is not a reliable indicator of future results. Actual results may differ materially from those anticipated in forward-looking or past performance statements. We assume no liability as to the accuracy or completeness of any of the information and/or content provided herein and the Company cannot be held responsible for any omission, mistake nor for any loss or damage including without limitation to any loss of profit which may arise from reliance on any information supplied by Everest Fortune Group.

GBP/USD Tactical Shift: Long Closed, Short Bias ActivatedAfter successfully capturing the upside move on GBP/USD, price has now reached a key resistance zone where bullish momentum appears to be fading. The recent price action shows signs of exhaustion, with lower highs forming near the top and a noticeable slowdown in buying pressure.
This shift in structure suggests a potential reversal opportunity. I'm now positioning for a short setup, anticipating a corrective move as sellers begin to step in. The risk is clearly defined above the recent highs, with downside targets aligned with previous reaction zones and intraday support levels.
This transition from long to short reflects a dynamic response to evolving market conditions—focused, disciplined, and opportunity-driven.

GU-Tue-01/07/25 TDA-Strong resistance area approaching 1.37500Analysis done directly on the chart
Follow for more, possible live trades update!
I often share my live trades in Tradingview public chat in London session, stay tuned!
Timing!
You might ask yourself why sometimes your
trade idea was good but still ended up hitting your sl before it moves to your direction.
The reason is simple: Timing.
price is just not ready to push at that time
and needed extra liquidity and structure before it finally has the force to push.
Understanding when the market is ready is one of the most difficult thing for a trader to do but with experience you start to understand better and improve.
If you like the way I present and analyze, make sure to boost,
share and follow me for more future posts, ideas and useful informations.
Active in London session!
Not financial advice, DYOR.
Market Flow Strategy
Mister Y

GU-Mon-30/06/25 TDA-Good support 1.37000&Good resistance 1.37500Analysis done directly on the chart
Follow for more, possible live trades update!
I often share my live trades in Tradingview public chat in London session, stay tuned!
The reality of life is that if you don't work for yourself,
you'll never achieve what you want.
Don't expect things to come, work for it, act on it.
Notice the difference between DOers and Dreamers.
Comment down below what do you think!
Active in London session!
Not financial advice, DYOR.
Market Flow Strategy
Mister Y

Market next target 🔁 Disruption of the Current Bullish Analysis
1. Resistance Rejection Likelihood
The chart suggests a breakout above resistance will turn the red box into support.
Disruption: The price is currently at a key resistance zone, and multiple rejections in this area previously suggest selling pressure.
We could see a double top formation or a false breakout trapping bulls.
Look for wicks or long upper shadows indicating weakness.
2. Volume Divergence
Recent bullish candles show declining or inconsistent volume.
Disruption: A strong bullish breakout requires rising volume. If volume doesn't confirm price action, this move may lack conviction and reverse sharply.
3. Overbought Conditions
After a strong uptrend, RSI or Stochastic indicators (not shown, but implied) could be entering overbought territory.
Disruption: This suggests limited upside and a potential for mean reversion or correction.
4. Bearish Candlestick Pattern Watch
Watch closely for a bearish engulfing, shooting star, or evening star at this resistance zone.
Disruption: Any bearish reversal pattern here would strongly contradict the bullish breakout thesis.

GBPUSD SHORTAdded to the position as a clear head and shoulders has formed on the lower time frame. Expecting price to move lower from here.
GU-Wed-25/06/25 TDA-GU consolidating now!Analysis done directly on the chart
Follow for more, possible live trades update!
I often share my live trades in Tradingview public chat in London session, stay tuned!
Market is fractal, what happens in higher timeframe.
It repeats on lower timeframe but with more noise.
The lower timeframe we go the more technical
analysis is required as price in general is not
subjected to fundamental news as the higher
timeframe does. (Even though fundamental analysis,
is essential no matter what timeframe you trade)
Active in London session!
Not financial advice, DYOR.
Market Flow Strategy
Mister Y

Possible GBPUSD LONG TradeTargeting bullish imbalance Order block for a long trade.
Expecting a sweep of the 4H CRT, then a reaction from the bullish order block.

GBPUSD - Bullish Channel (TCB Strategy)📈 GBPUSD – Falling Wedge Breakout Within Bullish Channel (TCB Strategy)
Type: Trend → Countertrend → Breakout
Timeframe: 1H
Status: Trade Running
🔍 Analysis Summary:
GBPUSD is respecting a strong ascending channel, with a recent correction forming a textbook falling wedge pattern. Price has now broken out of the wedge with bullish momentum during the NY session, signaling a potential continuation toward the upper boundary of the channel.
This setup aligns perfectly with my TCB Strategy:
Trend: Bullish market structure intact
Countertrend: Falling wedge correction
Breakout: Clean bullish breakout above wedge resistance
🧠 Trade Plan:
Entry (EP1): 1.37350 (Breakout entry)
SL: 1.36850 (below wedge low)
TP1: 1.37600
TP2: 1.38200 (channel top)
🛠️ Checklist Score: ✅ 100%
All criteria met, including session timing, structure confluence, breakout candle quality, and risk-reward profile.
📌 Watching how price reacts around 1.37600. Clean break above that could open the path to 1.38200+.
Follow for updates.
#GBPUSD #ForexAnalysis #TCBStrategy #BreakoutSetup #FallingWedge #PriceAction

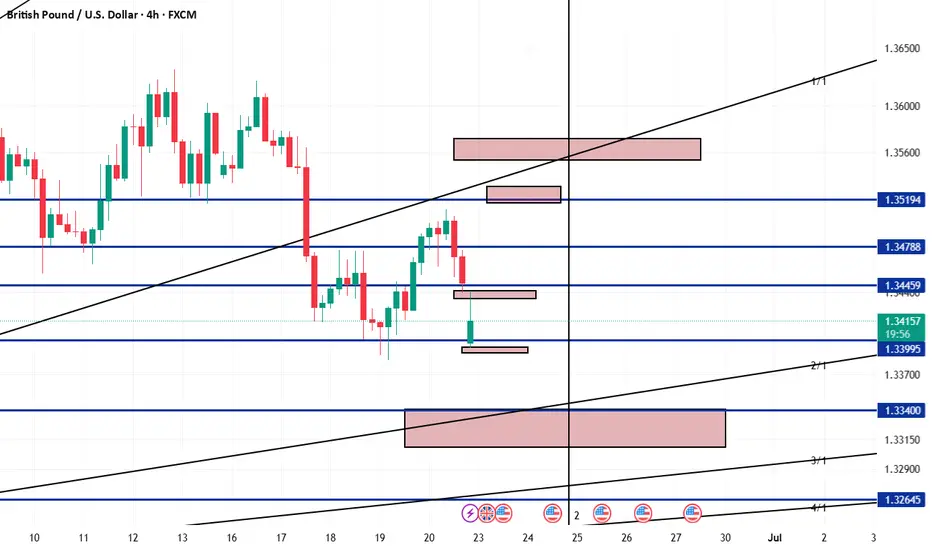
GBPUSD AnalaysisGBPUSD Analaysis on 4H frame According to my own analysis strategy
Selling Zones :
1.35150 - 1.35300
1.35530 - 1.35720
buying zones
1.33427 - 1.33080
GBPUSD Selling From Bearish Order Block At 1.36200GBPUSD Technical Breakdown
Timeframe: 1H
Price has officially broken out of the descending channel and is now reacting from the bearish Order Block around 1.36200. We're looking for short opportunities as momentum shifts.
🎯 Bearish Targets:
🔻 1st Target: 1.35500 – Key Demand Zone
🔻 2nd Target: 1.34700 – Deeper Demand Zone
🔻 3rd Target: 1.34000 – Bullish Order Block
📉 Setup looks clean – watching PA confirmation on each level.
👇 Like, follow, comment, and join us for more updates & smart trade setups.
Trade smart. Trade safe. 💼✨
— Livia 😜
