Sell to Buy ModelTho the sell hit sl but still went according to plan. Still Bullish and holding this buy for NFP happening tomorrow
GBPUSD_SPT trade ideas

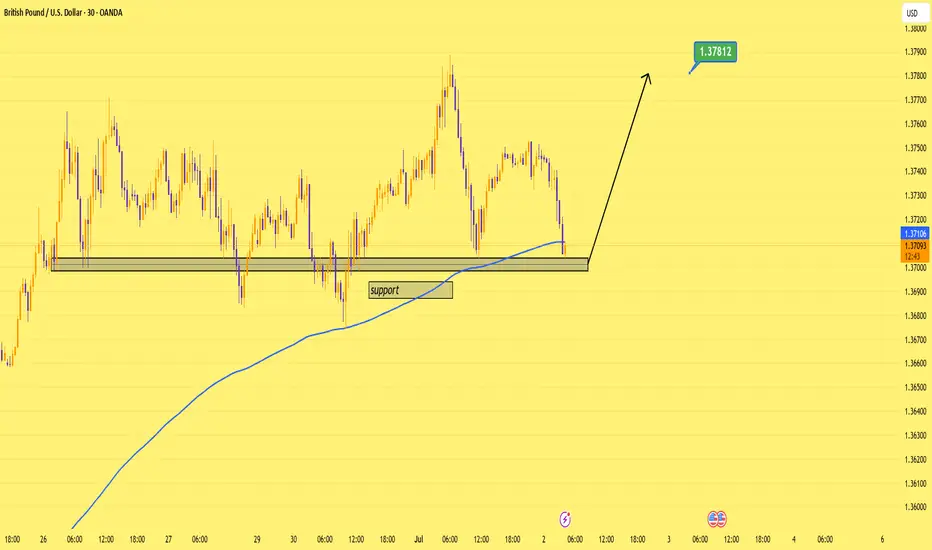
GBPUSD Bounced the Block — 1.3780 in Sight.Price is reacting off a strong support zone and the 200 EMA.
This move is also based on my expectation that upcoming U.S. data will come in weaker than forecasted, which should push USD lower and support GBP strength.
Target: 1.3780 📈
Let’s see how it plays out.
GBPUSD Long, 1 JulyPrice is reacting from a Daily bearish OB, but this setup aims to catch the pullback — making a long valid here despite HTF structure.
LTF gave a clean 15m BOS, followed by reaction from the extreme 15m OB.
Entry was taken after a confirmed 1m BOS + OB retrace, in alignment with structure and location.
🎯 Target: 30 pips (1:3 RR)
⚠️ No clear Asia target, but structure favors this move
📍Entry: 1m OB after BOS
📉 Risk: 0.5%
High-probability pullback play, executed with confirmation and clean structure.

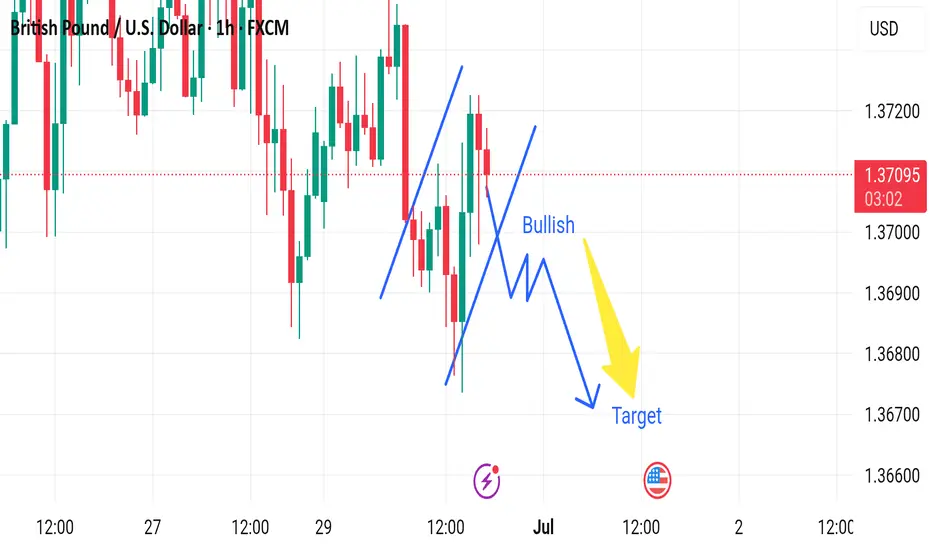
Market next target 🔀 Disruption Analysis – Bullish Alternative Scenario
While the current chart outlines a bearish scenario after a short-term bullish correction, leading to a drop toward the target near 1.36600, here’s how a bullish disruption could unfold instead:
---
🟢 Bullish Disruption Possibility:
1. False Breakdown / Bear Trap:
The market may dip slightly below recent lows to trigger sell stops and liquidity grab, then reverse upward.
If price finds strong buying interest around 1.3690–1.3700, it could spark a bullish reversal.
2. Strong Rejection Candles:
Watch for bullish engulfing or pin bar formations on lower timeframes (15m or 30m) near the dip area.
These would signal loss of bearish momentum.
3. Break of Lower High Structure:
A break above 1.3720 would shift short-term market structure to bullish.
It could lead to a move toward 1.3750–1.3780.
4. Macro Fundamentals:
Hawkish BOE comments or weak U.S. data could reverse USD strength, lifting GBP/USD.

GBPUSD At A Point of Indecision No clear direction going into the week ahead... Will sit tight, watch Monday and Tuesday before taking action... bullish continuation or not...
Kindly, lets see.

GBPUSD politics and the upcoming NFPFX_IDC:GBPUSD trading was influenced by politics in UK. The pair recovered half of the losses, but the downside risk still remains. NFP could be a trigger. Let's dig in.
MARKETSCOM:GBPUSD
Let us know what you think in the comments below.
Thank you.
77.3% of retail investor accounts lose money when trading CFDs with this provider. You should consider whether you understand how CFDs work and whether you can afford to take the high risk of losing your money. Past performance is not necessarily indicative of future results. The value of investments may fall as well as rise and the investor may not get back the amount initially invested. This content is not intended for nor applicable to residents of the UK. Cryptocurrency CFDs and spread bets are restricted in the UK for all retail clients.

CHECK GBPUSD SIGNAL READ CAPTAINgbpusd ) buy zone
( trade satup)
entry point (1.36600) to (1.36500) 📊
first tp ( 1.36800)📊
2nd target (1.37150) 📊
last target (1.37450) 📊
stop loss (1.36250)

GBPUSD swing shortKeeping yesterday long open after taking profit setting limits for short swing on GPBUSD with fraction of profits of yesterday, price did close above weekly high so caution advised

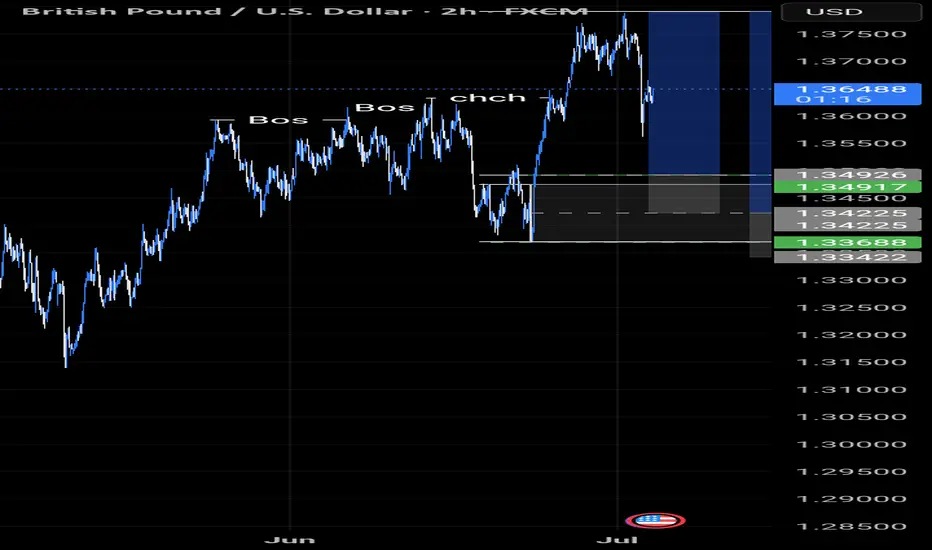
Wednesday Model70% of the time Wednesday is a classic sell
With this Model we take the true Monday high and low(00:00 EST)
Look for a rejection of a Swing high/low from the weekly/monthly TF
4hr CRT and a Market Structure Shift on the 1hr
Entry on the Order Block on the 1hr
Target? the Monday low

GBPUSD: Not giving a clear direction Lets wait till Mon and Tue before taking action.........either to continue our up trend or not......
GBPUSD LongLooking to the upside got BoS pull back into FVG with the second retest. Looking for the bullish extension to the upside.

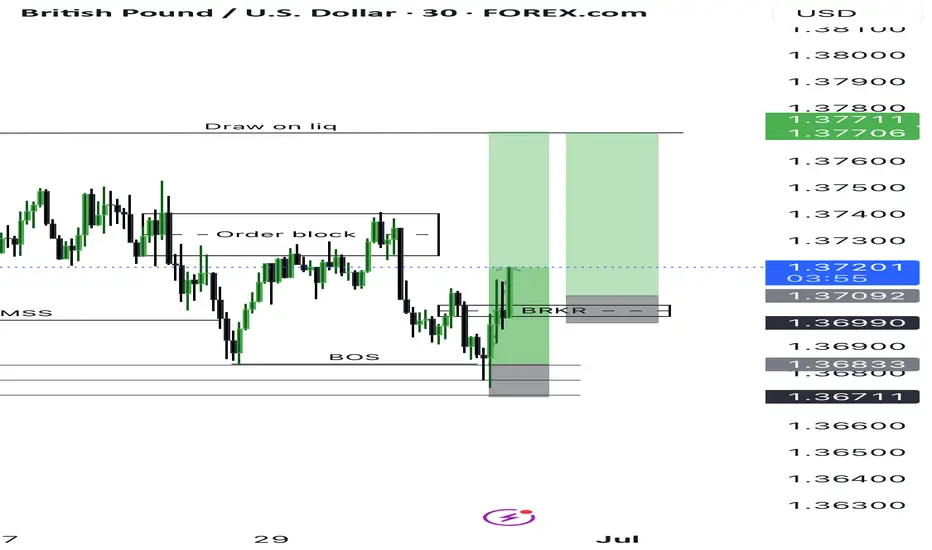
NFP DAY! Could we see a bullish bounce in London?Morning everyone,
Forecasting a potential bullish leg this morning towards the 1h order block area, a retracement of yesterdays bearish leg.
Kind regards,
Aman | SMC Wolf FX

GBPUSD TRADE IDEA We're looking out for a trade on GBPUSD.
We await a pullback to the downside for a continuation in the original upward movement of the market
GBPUSD InsightHello to all subscribers,
Please feel free to share your personal opinions in the comments. Don’t forget to hit the booster and subscribe!
Key Points
- According to the ADP National Employment Report, U.S. private employment in June decreased by 33,000 compared to the previous month — the first negative figure since March 2023. This has strengthened expectations for interest rate cuts.
- U.S. President Donald Trump announced that a trade agreement has been reached with Vietnam. Reportedly, Vietnam has agreed to significantly lower its tariffs to 20% in exchange for opening its market. This has raised hopes for progress in ongoing trade negotiations with other countries.
- The EU trade team is currently in Washington, D.C., negotiating with the U.S. side and is reportedly requesting preemptive tariff exemptions in certain sectors.
- In the U.K., the welfare reform plan proposed by the Labour government has been significantly scaled back. Prime Minister Keir Starmer has not confirmed his confidence in Chancellor Rachel Reeves, leading to growing speculation that she may be replaced. If Reeves — who has emphasized fiscal discipline — is replaced, there are concerns that fiscal control could loosen.
Key Economic Events This Week
+ July 3: U.S. Non-Farm Payrolls (June), U.S. Unemployment Rate (June)
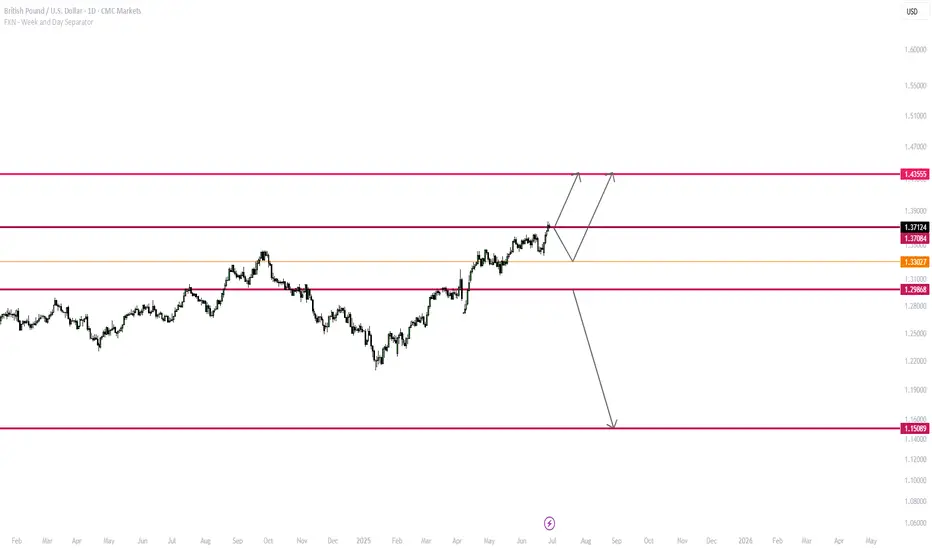
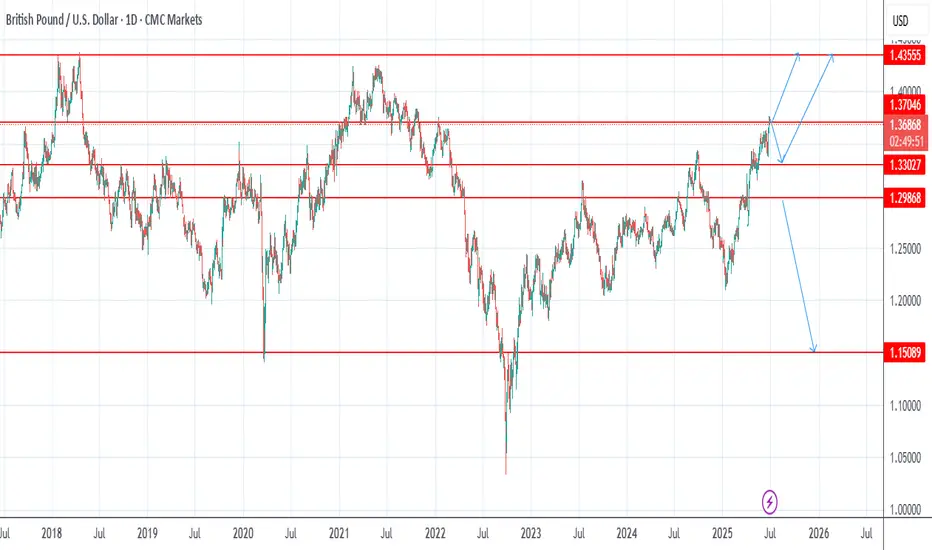
GBPUSD Chart Analysis
After maintaining an upward trend, GBPUSD experienced a sharp drop. However, the pair appears to have regained its bullish momentum with support from the trendline. The upward view will be maintained toward the resistance level of 1.40000, the trend’s previous high.
That said, caution is advised near the 1.38000 level, where the previous sharp decline occurred, as this zone could introduce volatility.

GBPUSD - Trade Idea for Today ! Hurry Up !Details on chart. There some important levels here and we might see a downward move here.
CMCMARKETS:GBPUSD FX:GBPUSD OANDA:GBPUSD FX_IDC:GBPUSD

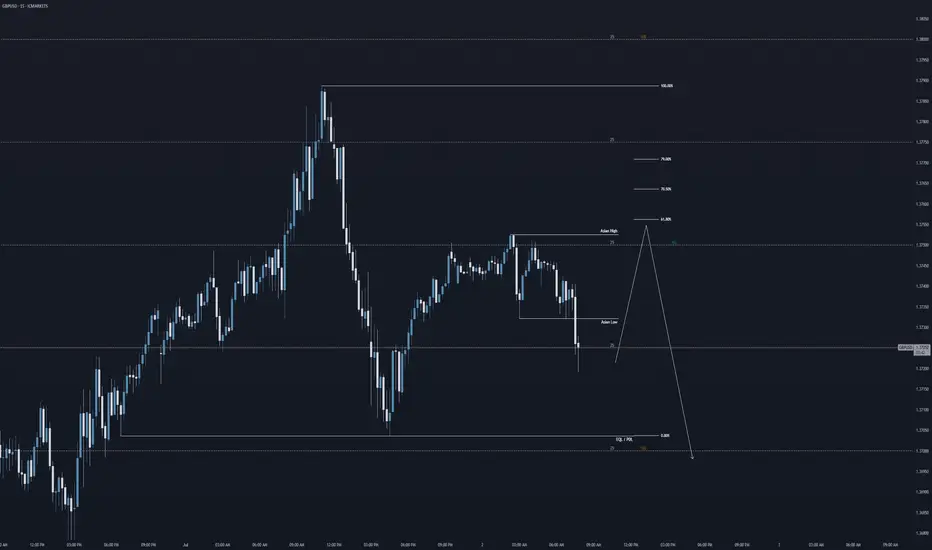
GU: Asian highs > Previous Day Low?Hi everyone,
Here is my forecast this morning for GBPUSD. Overall I'm thinking bearish, but I reckon that price could take out the Asian range highs first and then give us a bearish leg towards the previous day low.
Regards,
Aman | SMC Wolf FX
1-1 student onboarding is currently open (website in my signature & profile)
GBPUSDHello traders,
With all news that happening in middle east since yesterday.
I hope ending the war with no humanity loss.
That will affect GBPUSD and GOLD, both of them looks like near the ups.
active now,
Good luck for me and you


GBPUSD My analysis on GBPUSD not a financial advice do your due diligence. Thank you
Feel free to hop on this
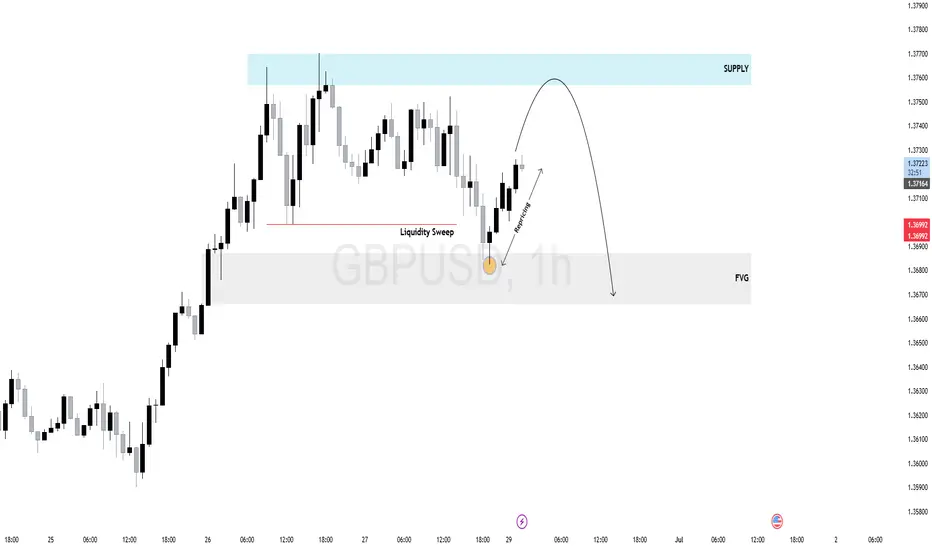
$GU (GBPUSD) 1H AnalysisPrice swept internal liquidity before dropping into a clear 1H Fair Value Gap (FVG), which acted as a draw on liquidity. Following the mitigation, GBPUSD is now retracing toward a high-probability supply zone.
Expect potential rejection as price rebalances inefficiency and seeks sell-side liquidity.
Watch for bearish confirmation inside the supply zone — ideal for intraday shorts if the structure shifts.
Pullbacks = short opportunities.
Exclusive: GBP/USD Swing Heist – Limited-Time Opportunity!🏴☠️ GBP/USD HEIST ALERT: Bullish Loot Grab Before the Cops Arrive! 🚨💰
🌟 Attention, Market Pirates & Profit Raiders! 🌟
"The vault is unlocked—time to swipe those pips!"
🔥 THIEF TRADING STRATEGY (Swing/Day) 🔥
Based on high-risk, high-reward technical & fundamental analysis, here’s the master plan to plunder GBP/USD ("The Cable")!
📈 ENTRY (Bullish Heist Zone)
"The vault is OPEN!" – Long at any price, but for precision:
Buy Limit orders preferred (15m-30m timeframe).
Pullback entries from recent swing lows/highs = sneakiest loot grab!
🛑 STOP LOSS (Escape Route)
Thief SL: Nearest swing low (4H chart).
Adjust based on: Risk tolerance, lot size, & number of orders.
"A good thief always has an exit plan!"
🎯 TARGETS
1.37500 (or escape early if the cops 🚓 (bearish traps) show up!).
Scalpers: Only long-side raids! Use trailing SL to lock profits.
💥 WHY THIS HEIST? (Bullish Momentum)
Technicals + Fundamentals align for a potential breakout.
Overbought? Risky? Yes—but the best loot is guarded!
📢 TRADING ALERT (News & Risk Mgmt)
Avoid new trades during high-impact news (volatility = police sirens!).
Trailing stops = Your getaway car. Protect profits!
🚀 BOOST THE HEIST!
💖 Hit "Like" & "Boost" to fuel our next raid!
💬 Comment your loot tally below!
"Stay sharp, thieves—see you at the next heist! 🤑🔥"
