GBPUSD GBP/USD: 10-Year Bond Yields, Interest Rates, and Upcoming Monetary Policy News (June 2025)
1. 10-Year Bond Yields
UK 10-Year Gilt Yield:
As of June 24, 2025, the UK 10-year government bond yield is 4.51%, having recently climbed as high as 4.73%—the highest since April—driven by hotter-than-expected inflation data.
Markets have scaled back expectations for Bank of England (BoE) rate cuts due to persistent inflation, particularly in core and services sectors.
US 10-Year Treasury Yield:
The US 10-year Treasury yield ended June 20, 2025 at 4.38%.
2. Central Bank Interest Rates
Bank of England (BoE) Rate:
The BoE held its policy rate steady at 4.25% at its June 19 meeting, with a 6–3 vote to maintain rates. Three members favored a 0.25% cut to 4.00%.
Inflation in the UK slowed to 3.4% in May (from 3.5% in April), but core and services inflation remain elevated, making policymakers cautious about cutting rates too soon.
US Federal Reserve Rate:
The Federal Reserve kept its key rate in a range of 4.25%–4.50% at its June 2025 meeting and signaled the possibility of two rate cuts later this year, but with ongoing uncertainty about the timing.
3. Upcoming Monetary Policy News (Late June–July 2025)
Bank of England:
The BoE is expected to remain cautious, with markets now pricing in only 34 basis points of cuts for 2025 (down from earlier expectations of two cuts this year).
Economists expect a possible rate cut in August if inflation and wage growth show clearer signs of easing.
Federal Reserve:
The Fed continues to signal a data-dependent approach, with two cuts still possible in 2025 if inflation moderates and growth slows as projected.
Key Data to Watch:
UK: Flash PMIs (Thursday) for signs of economic momentum or weakness.
US: PCE inflation and labor market data for Fed policy clues.
Summary Table
Metric/News UK (GBP) US (USD)
10-Year Bond Yield 4.51% (recent high: 4.73%) 4.38%
Policy Interest Rate 4.25% 4.25%–4.50%
Next Central Bank Decision Possible cut in August Two cuts possible in 2025
Key Drivers Sticky core/services inflation Inflation, growth, Fed outlook
Key Takeaways
The UK 10-year gilt yield remains above the US 10-year yield, supporting GBP/USD in the near term.
The BoE is holding rates steady but may cut in August if inflation data softens further.
The Fed is also on hold, with possible cuts later in 2025, making upcoming inflation and labor data crucial for both currencies.
Both central banks are in a wait-and-see mode, with markets closely watching economic data and policy signals for direction.
#GBPUSD
GBPUSD_SPT trade ideas

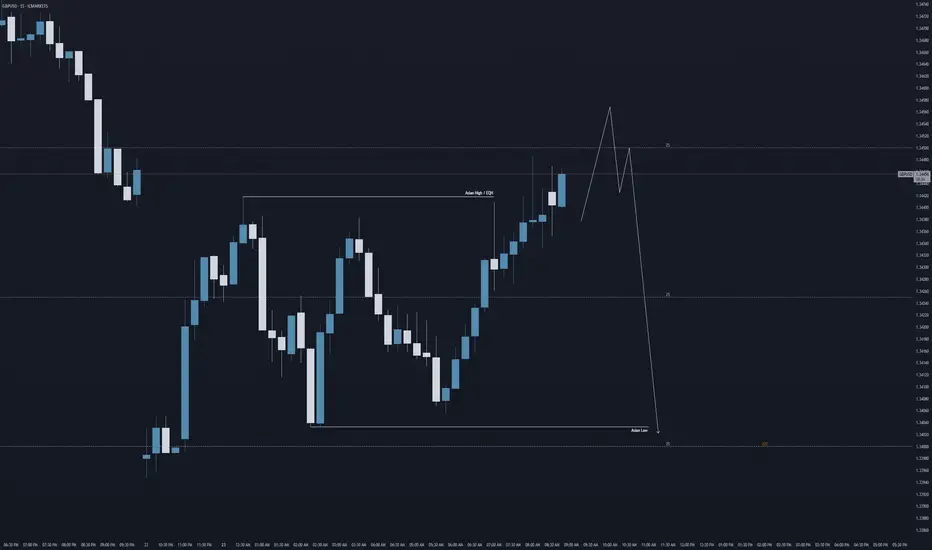
GBPUSD Sellprice mitigated an Order Block during London open and should head downward to take out Asia liquidity to complete daily cycle.

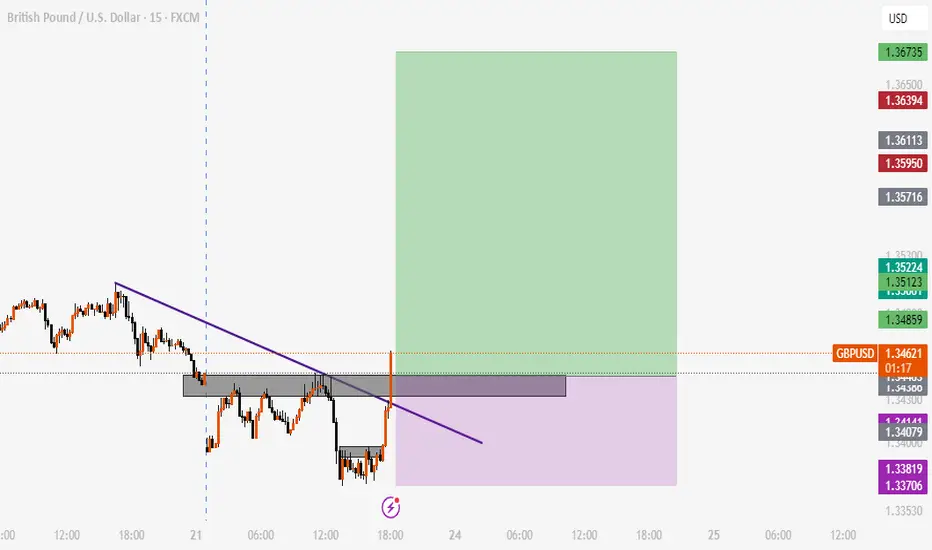
GBP/USD Downtrend Wedge Breakout Setup – Bullish Target AheadThe GBP/USD pair is currently displaying a downtrend wedge pattern, a structure that typically signals a bullish reversal when confirmed. The pattern is formed by a descending resistance trendline (in red) and a gradually sloping support line (in green), converging to a point. Price has bounced off the wedge’s support multiple times while forming lower highs, creating pressure that often leads to a breakout.
As seen in the chart, the pair recently surged toward the upper resistance line and is now attempting to break above it. A successful breakout with bullish candle confirmation could lead to a strong move upward.
📈 Breakout Scenario
If the price manages to close above the resistance zone (~1.3490–1.3500), it would confirm the wedge breakout. Based on the height of the pattern, the projected breakout target is around 1.3692. This target is calculated by measuring the vertical height of the wedge and adding it to the breakout point. Confirmation of breakout should ideally include a retest of the broken resistance acting as new support.
📉 Rejection Scenario
However, if the breakout attempt fails and the price gets rejected again from the red resistance line, the pair could retest the wedge’s support area around 1.3360. A breakdown below the green zone would invalidate the bullish outlook and suggest continued bearish pressure.
⚙️ Strategy Tips
Buy Setup: Enter after breakout candle closes above 1.3500 with stop loss just below breakout zone.
Take Profit: Use the 1.3692 level as the primary target or scale out on the way up.
Confirmation: Always wait for breakout confirmation before entering; avoid false breakouts.
✅ Conclusion
This wedge breakout setup offers a bullish trading opportunity if confirmed. The clear structure, repeated tests of both support and resistance, and recent momentum build a strong technical case. Still, confirmation is key before initiating any positions.
=================================================================
Disclosure: I am part of Trade Nation's Influencer program and receive a monthly fee for using their TradingView charts in my analysis.
=================================================================

GBPUSD - Technical Outlook (Long + Short Term)In this article, I’ll share my current outlook on GBPUSD, highlighting both higher time frame (HTF) and intraday considerations.
Higher Time Frame Analysis
The overall trend remains bearish. Price is still trading within the previous structural leg, with the key level at 1.42500. Unless we see a decisive break above this level, my bias will remain bearish for this pair.
Recently, we’ve witnessed what looks like institutional manipulation to the upside, followed by a sharp bearish reaction from the weekly supply zone. This price action aligns with a classic Wyckoff distribution cycle, which often signals that the prevailing trend is likely to continue.
Intraday Advice
For short-term traders, it’s best to wait for lower time frame (LTF) pullbacks and signs of manipulation before considering short positions. If price continues to push lower, there should be opportunities to ride the trend down over the coming weeks, with multiple entry points along the way.
Trading Considerations
If this analysis plays out, there’s potential to maximize gains through both swing and intraday trades. However, patience and risk management are key. Losses are inevitable - what matters is managing risk and staying disciplined.
Key Points to Remember:
Wait for clear pullbacks before entering trades.
Stick to your risk management plan.
Stay patient and let the market come to you.
This is an exciting time to trade FX:GBPUSD , but always assess if the risk is worth the reward before entering any position.
Happy hunting predators...
Apex out!

GBPUSD Will Fall! Sell!
Here is our detailed technical review for GBPUSD.
Time Frame: 6h
Current Trend: Bearish
Sentiment: Overbought (based on 7-period RSI)
Forecast: Bearish
The market is approaching a significant resistance area 1.349.
Due to the fact that we see a positive bearish reaction from the underlined area, I strongly believe that sellers will manage to push the price all the way down to 1.341 level.
P.S
The term oversold refers to a condition where an asset has traded lower in price and has the potential for a price bounce.
Overbought refers to market scenarios where the instrument is traded considerably higher than its fair value. Overvaluation is caused by market sentiments when there is positive news.
Disclosure: I am part of Trade Nation's Influencer program and receive a monthly fee for using their TradingView charts in my analysis.
Like and subscribe and comment my ideas if you enjoy them!

GBP/USD Breakout Done , Best Place To Get 150 Pips Clear !Here is my opinion on GBP/USD On 2H T.F , We have a very good breakout now clear not as the old one and we have a very good bearish price action , so i think it will be a good entry if the price go back to retest my res with the news today and give us a good touch and go to downside , and also we might see a random move and fake wicks to take all stop losses before going down or even back to upside so be careful today and use a good risk , i`m waiting the price to back to retest the broken support and new res and then i will enter a sell trade with a very small lot size .

GU: Trading back towards 1.34 today?Hi everyone, hope you've all had a nice weekend.
Looking at GBP/USD this morning, keeping the forecast and analysis simple, but looking at a further bearish run today if we get the right lower time frame price action to confirm...
Looking at a sweep into 1.345 before trading lower, potentially towards 1.34.
Aman
Upondo qatha neDolaThe FX:GBPUSD pair is projected to reach a high of 1.403 in the near future, driven by a combination of factors including improving UK economic data, hawkish signals from the Bank of England, and a weakening U.S. dollar amid expectations of Federal Reserve rate cuts. Market sentiment has turned increasingly bullish on the pound, supported by stronger-than-expected inflation figures and resilient growth indicators. If current trends continue, the pair could test the 1.403 resistance level, marking a significant move in favor of sterling.

How to trade GAPS in the market, SELL GBPUSD!!!!All the information you need to find a high probability trade are in front of you on the charts so build your trading decisions on 'the facts' of the chart NOT what you think or what you want to happen or even what you heard will happen. If you have enough facts telling you to trade in a certain direction and therefore enough confluence to take a trade, then this is how you will gain consistency in you trading and build confidence. Check out my trade idea!!
www.tradingview.com

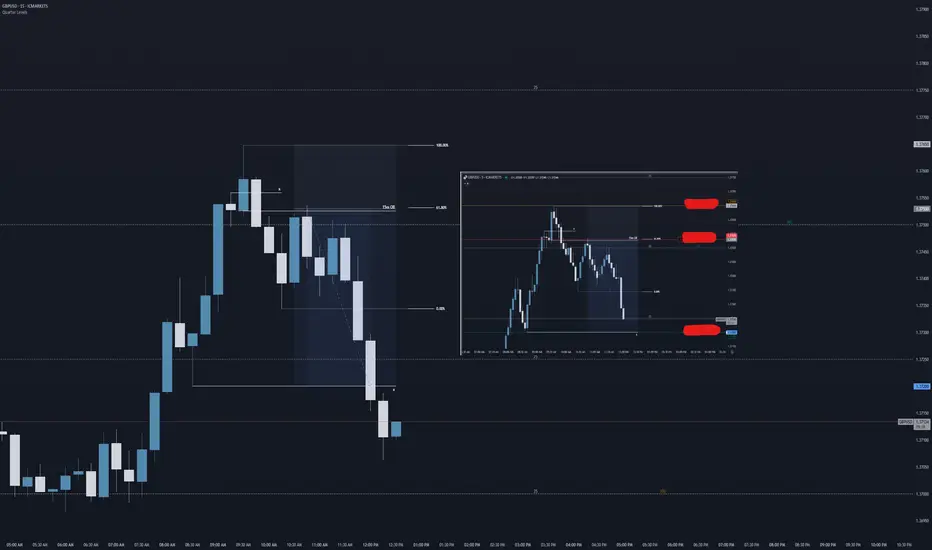
GU Sniper Trade ReviewTook this extremely precise trade this morning on GBP/USD off the 15 minute chart.
We're trading at price highs from 2022, due to all the current fundamentals (which needs to be a topic for another day).
But price showed some really good bearish confluences for a nice session based trade.
Entry was based on the below technical analysis logic:
- 15m order block
- 61.8% FIB retracement (golden ratio)
- 1.375 key price level ( the secret sauce ;) )
I set a conservative TP off a previous 5m structure low and SL was simply set at the current structure high.
This resulted in a 1:3RR trade setup.
Aman | SMC Wolf FX
p.s. i'm currently taking on students who are wanting to learn the way I trade with precision (check out my signature)
The Day Ahead Economic Data Highlights (US & Europe):
A busy day for economic indicators, particularly out of the US.
Durable Goods Orders (May): Markets will watch for signs of resilience or weakness in US manufacturing, with core capital goods orders acting as a proxy for business investment.
Chicago Fed National Activity Index: Could offer a broader snapshot of US economic momentum ahead of the July FOMC.
Pending Home Sales: Will shed light on housing market trends amid fluctuating mortgage rates.
Advance Goods Trade Balance & Wholesale Inventories: These will feed into Q2 GDP tracking estimates.
Kansas City Fed Manufacturing Activity (June): Regional data may add color to the broader ISM picture.
Initial Jobless Claims: As always, a key gauge of labor market tightness.
Germany GfK Consumer Confidence (July): Expected to reflect persistent economic pessimism, weighing on EUR sentiment.
Central Bank Speakers:
A full slate of Fed, ECB, and BoE commentary may offer insight into diverging policy paths.
Fed’s Barkin, Hammack, and Barr could provide updates on inflation dynamics and balance sheet strategy.
ECB’s Schnabel and Guindos may hint at the pace of further policy easing amid eurozone stagnation.
BoE’s Governor Bailey and Deputy Governor Breeden speak following recent UK inflation and growth data, with focus on the rate outlook into Q3.
Corporate Earnings:
Nike (NKE): Focus will be on forward guidance and China recovery amid margin pressure and inventory management.
H&M: May offer cues on European consumer demand and retail sector performance.
Other Key Events:
European Council Summit (Brussels, through June 27): Leaders gather to discuss key policy areas including fiscal rules, Ukraine aid, and EU top jobs. Potential EUR sensitivity depending on political developments.
US 7-Year Note Auction: Watch for demand and yield levels, as Treasury issuance remains in focus amid deficit concerns.
This communication is for informational purposes only and should not be viewed as any form of recommendation as to a particular course of action or as investment advice. It is not intended as an offer or solicitation for the purchase or sale of any financial instrument or as an official confirmation of any transaction. Opinions, estimates and assumptions expressed herein are made as of the date of this communication and are subject to change without notice. This communication has been prepared based upon information, including market prices, data and other information, believed to be reliable; however, Trade Nation does not warrant its completeness or accuracy. All market prices and market data contained in or attached to this communication are indicative and subject to change without notice.

GBPUSDBULLISH GU top down observation anticipating a break of the highs you can find the lower time frame idea below.

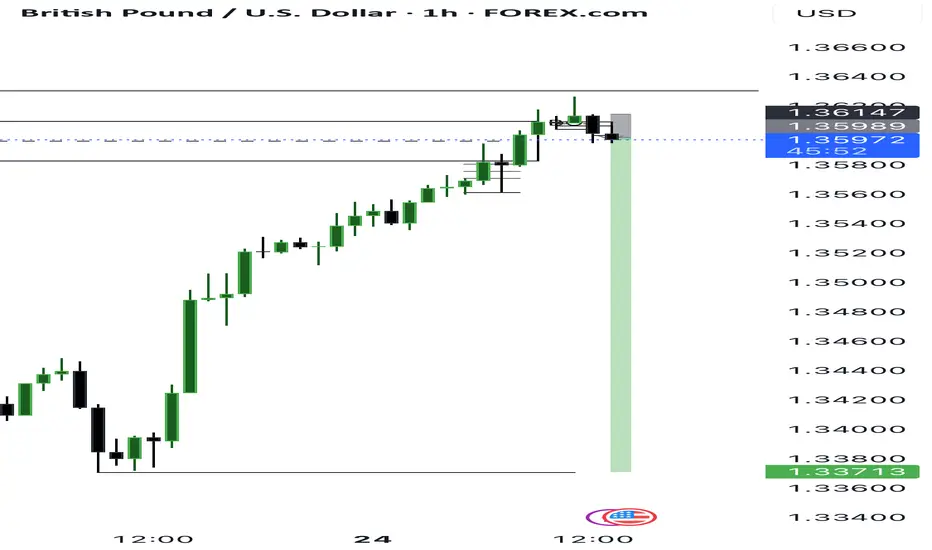
GBPUSD | 24.06.2025SELL 1.35900 | STOP 1.36500 | TAKE 1.35000 | Price movement in the range of the medium-term ascending channel.

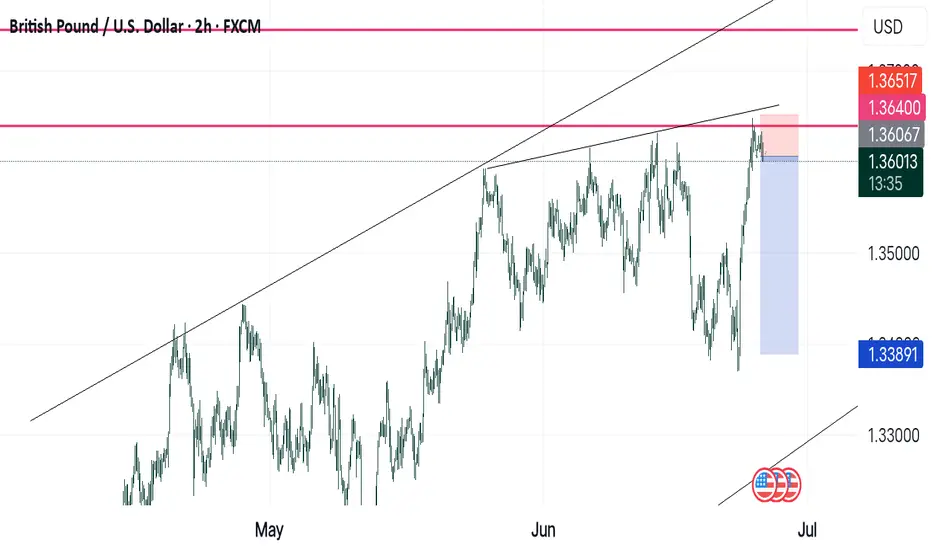
GBP/USD Launch to Fresh 3-Year HighsGBP/USD had a mild pullback earlier in the morning until the 1.3593 level came in to help set the lows. I had looked at that price in yesterday's post and that's held the lows for today ahead of another strong breakout with the pair pressing into fresh three-year highs.
Chasing breakouts can be tough especially when they've already started, so at this point there's a couple of spots of support that bulls can defend to keep the door open for shorter-term trend continuation purposes.
The price of 1.3639 is an aggressive level of support potential, and below that is 1.3616. If bulls fail to hold support at those prices, the bullish momentum that's driving the current breakout would come into question and the door would open to deeper retracement potential. In that scenario, there may be more attractive options to work with USD-strength. - js

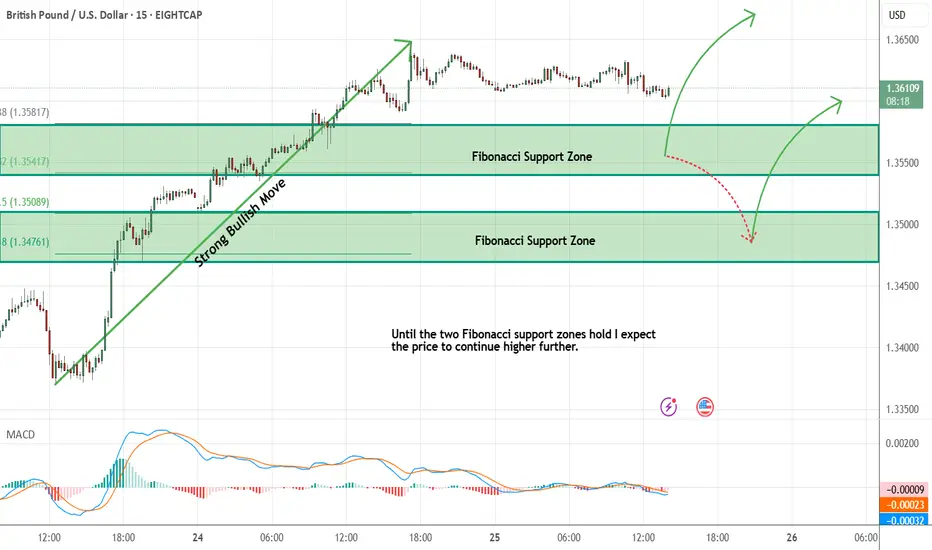
GBPUSD - Expecting Bullish Continuation In The Short TermM15 - Strong bullish momentum followed by a pullback.
No opposite signs.
Until the two Fibonacci support zones hold I expect the price to move higher further.
If you enjoy this idea, don’t forget to LIKE 👍, FOLLOW ✅, SHARE 🙌, and COMMENT ✍! Drop your thoughts and charts below to keep the discussion going. Your support helps keep this content free and reach more people! 🚀
--------------------------------------------------------------------------------------------------------------------
GBPUSD SHORTS Im shorting GBPUSD all the way down to at least 1.33900 or 1.34 flat cos price then just formes M formation on 1.36400 level on H2 timeframe which happened to be key area price respected in the past... DYOR
GBPUSDGBPUSD still needs some more correction before it goes to 1.365.
Disclosure: We are part of Trade Nation's Influencer program and receive a monthly fee for using their TradingView charts in our analysis.

How I’m Planning My Next GBPUSD Trade Setup📉 GBPUSD Analysis Update
Currently keeping a close eye on GBPUSD 👀. On both the Daily and 4H charts, we’ve seen a strong bullish rally, driving price into a premium zone and tapping into key buy-side liquidity resting above previous highs 🔼💧.
The pair now appears overextended and is trading into a significant resistance level 🧱. Given this context, I’m anticipating a potential retracement. If we see a pullback followed by a clean bullish break in market structure, that’s when I’ll be looking to enter a long position 🎯📈.
⚠️ As always, this is not financial advice — just sharing my personal view of the markets.


gbpusdgbpusd short and long idea price has to come a retest the support zone and then continue to go up

Market next move ⚠️ Disruption Analysis of the Chart
1. False Breakout Risk
The price is currently within an ascending channel, which is often seen as bullish.
However, the recent candlesticks show smaller bodies with wicks on top, indicating buyer exhaustion.
A false breakout above the upper trendline or support around 1.3632 could trap buyers before a sharp reversal.
2. Low Volume Confirmation
Volume peaked earlier but has significantly decreased in the last few candles.
Weak volume during a price rise signals a lack of conviction, increasing the likelihood of a pullback.
3. Resistance Flip Not Confirmed
The level around 1.3600 is marked as resistance-turned-support, but there is no strong retest confirmation yet.
If price revisits this zone and fails to bounce, this support could break, leading to a downside reversal.
4. Divergence Watch
While not visible in this static image, if you overlay RSI or MACD, there could be signs of bearish divergence (price making higher highs while momentum indicators make lower highs).
This is often a leading indicator of trend weakening.

GBPUSD This is my bias on GU
Apply proper risk management pls
I’m not a financial advisor. 1% risk is only