IT COULD BE THIS EASY!No further commentary necessary here.
Comment, boost, shoot me a message, let me know that this is working for you guys too!
If you're new here, check out some of my videos and watch the market start to make sense!!
Happy Trading :)
ASME trade ideas

ASML is on life support Warning: This baby is super volatile and not for beginners. If you’re trading with a small account, start with 1 share and put your stop in as soon as you enter. No exceptions.
We’ve got 3 lower highs, and there are institutional sellers parked near the 200-day EMA, slowly walking this thing down.
If they press, I’m watching to see if ASML can test the $650 area.
If it breaks, we might be looking at another 50–60 points lower.
📌 Tight stop: $750
📌 Wider stop: $770
This one isn’t for the faint of heart—respect the volatility and use stops!

750 Soft spot for selling, but trendline stabilizingIt has been a yo-yo recently, swinging one way rather than the other, and it seems to be the same pattern. It has seen progress, but I anticipate another selloff until we get some serious volume and volatility into the 750 regions!

ASML: Possible Upside MomentumNASDAQ:ASML appears to be setting up for a potential upside move. After a period of consolidation, the stock has shown resilience at key support levels and is now primed for a bullish breakout.
Resistance: $786 – This is the primary target for the next leg higher.
Momentum: Indicators suggest increasing buying pressure.

ASML IDEAWe are currently sitting above the next significant demand zone. The current consolidation I suspect will draw in a lot of early buyers which can be wiped out by another bearish leg that will land us in the demand zone that we can buy from.

ASML on its way to 400The semiconductor sector is at it peak.
Minging cryptos will shift to quantum machines over time.

Trading idea - Entry point > 746/61.80%Trading Idea
1) Find a FIBO slingshot
2) Check FIBO 61.80% level
3) Entry Point > 746/61.80%
Chart time frame: C
A) 15 min(1W-3M)
B) 1 hr(3M-6M)
C) 4 hr(6M-1year)
D) 1 day(1-3years)
Stock progress: A
A) Keep rising over 61.80% resistance
B) 61.80% resistance
C) 61.80% support
D) Hit the bottom
E) Hit the top
Stocks rise as they rise from support and fall from resistance. Our goal is to find a low support point and enter. It can be referred to as buying at the pullback point. The pullback point can be found with a Fibonacci extension of 61.80%. This is a step to find entry level. 1) Find a triangle (Fibonacci Speed Fan Line) that connects the high (resistance) and low (support) points of the stock in progress, where it is continuously expressed as a Slingshot, 2) and create a Fibonacci extension level for the first rising wave from the start point of slingshot pattern.
When the current price goes over 61.80% level , that can be a good entry point, especially if the SMA 100 and 200 curves are gathered together at 61.80%, it is a very good entry point.
As a great help, tradingview provides these Fibonacci speed fan lines and extension levels with ease. So if you use the Fibonacci fan line, the extension level, and the SMA 100/200 curve well, you can find an entry point for the stock market. At least you have to enter at this low point to avoid trading failure, and if you are skilled at entering this low point, with fibonacci6180 technique, your reading skill to chart will be greatly improved.
If you want to do day trading, please set the time frame to 5 minutes or 15 minutes, and you will see many of the low point of rising stocks.
If want to prefer long term range trading, you can set the time frame to 1 hr or 1 day.

ASML bullish breakoutASML is a beast which is now slowly waking up
ASML once it comes above its 200 EMA would be very bullish and an entry at 800+ levels would confirm that you are part of the reversal journey
Entry @ 800+
Stop loss (anything below 200 EMA level)
TP @ 1000 minimum

badass divergence OBV price on ASMLcrazy divergence , for the discounted price of ASML, 1000$ is the fair value

ASML - Next few years gonna be incrediblejust a possible projection, not a trade plan or investment advice

ASML is at its peak 2025ASML at its peak, machine sales to deminish as Quantum computing is taking over

ASML Holding Options Ahead of EarningsIf you haven`t bought ASML before the previous rally:
Now analyzing the options chain and the chart patterns of ASML Holding prior to the earnings report this week,
I would consider purchasing the 655usd strike price Puts with
an expiration date of 2025-2-14,
for a premium of approximately $18.40.
If these options prove to be profitable prior to the earnings release, I would sell at least half of them.

ASML - Buy when there's a blood on the streetYou all know the company. Valuation is very reasonable. Deepseek or no deepseek, TSM and other will buy their machines. Buying into earnings (2 days from now) as sentiment is extremely negative. Should be an easy beat.

ASML HOLDING N.V - BUY APPROVEDASML Buy Recommendation is Certified.
1. The major trendline since 2009 has been tested and remains solid.
2. The Fibonacci retracement is currently at the 0.618 level, the ultimate prime level.
3. The Fibonacci extension consistently proves accurate.
4. The presidential election year is historically the best time to invest, plus the stock is currently discounted.
5. ASML holds a global monopoly in EUV (Extreme Ultraviolet) lithography technology.
6. Earnings have consistently been excellent, with the company being highly profitable.
7. Some market pressures are driven by American interests, aiming to undermine ASML in order to prevent the sale of machines to China.
TARGET: 1450 EUR

ASML is starting a beautiful year ahead!NASDAQ:ASML NASDAQ:GOOG BCBA:TSMC ASML is starting a beautiful year ahead. A year that will be full of good news for Quantum chips and ASML financial progress.

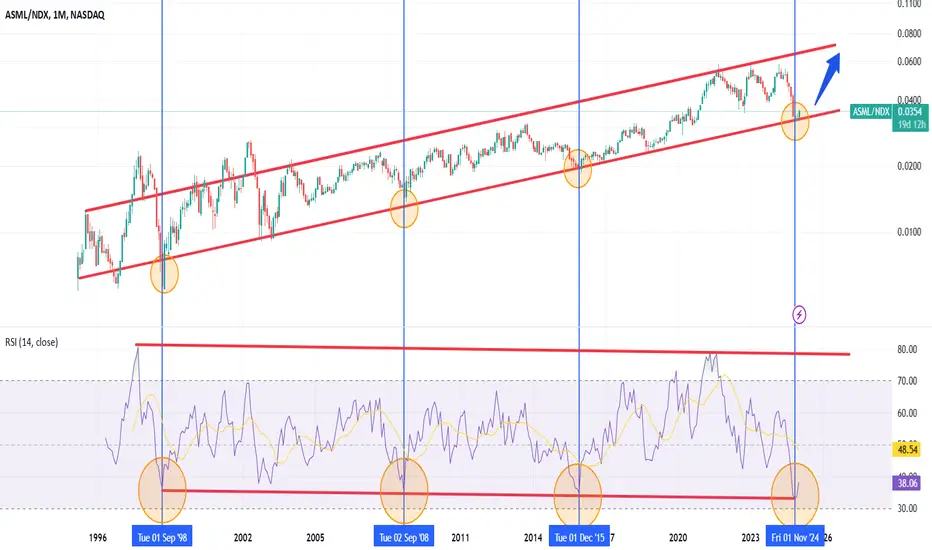
ASML - Downtrend & Push backTREND
According to the current wave structure, it is in the downtrend.
Characteristically, it is used to create pull and push backs after support/resistance breakout.
So we can expect similar behavior now.
It has not formed a channel yet, but a probable channel can be estimated as on the chart.
Moving Averages
The current price is under 100-day (Turquoise) (so supports downtrend)
50-day (Orange) will most likely cross 100-day (Turquoise) from up to down (powerful indicator supporting downtrend) in two weeks, unless prices exceeds 50-day.
200-day (Blue) has just worked as a support, but the next momentum is expected to be more powerful resulting a potential breakout of 200-day support.
SUMMARY
Based on this analysis, a price action following the blue arrow is highly probable.

ASML Long term investment ideaLooking at history and the philosophy that we are witnessing the technological gold rush with the advancement of AI and next generation NVIDIA chips. The idea that during a gold rush, the ones who got the wealthiest were those that sold pickaxes. Looking into this supply chain, the bottleneck is clear, this is an industry that takes time to build and scale. Arizona fab to years and billions of taxpayer dollars to get done, and it still took years.
With ASML being the only company supplies the lithography machines that take months to build and ship, they are school bus size light canon printers that need specialized teams to run and operate. Doesn't seem that any competitor in on the horizon, but with quantum technology also developing exponentially, their dominance in the chip market could strengthen past that of TSMC in my opinion. Their codependency on one another is being overlooked in markets, in my opinion.

ASML will shine compared to the S&P500 (SPX)The top in 2020 is now the new low. It looks like the bottom has been reached and ASML/SPX is going up! The RSI is also looking good!

Investing in ASML or Nasdaq 100? ASML looks better now!Chart speaks for itself. I think ASML will rise compared to Nasdaq 100.
Halftime Update: ASML is looking good for a Continuation PushASML recently broke out to $780 after closing around $715 on January 3rd, 2024. Looking for a potential entry around $762.97 with a stop around the $756.31 Levels and that $780 Price Target.
Connect with us by visiting our website in the signature below to access more Resources & Tools to improve your investments at @MyMIWallet #MyMIWallet

ASML Swing Trade - ShortFor my first trade of the year, I will take a stab at ASML.
The share has failed to break through an established resistance (red line), and MACD and price action suggest a bearish move. My profit target is 608, close to the next support I identified (green line). My stop will be just over the resistance line, resulting in a 2R target for this trade.
Happy New Year, fellow traders! Let's go!


679 gap fill could test the earlier support mid 650 as wellMoving averages are still bearish, oscillators are still working overtime in bear territory, and the bottom isn't entirely confirmed. Still, it does seem to be shifting toward a reversal at some point. For now, waiting on confirmation that 679 is the first target; if it breaks, 650 would be to retest the low, but I don't believe that would break, but the first thing is first and our target.
