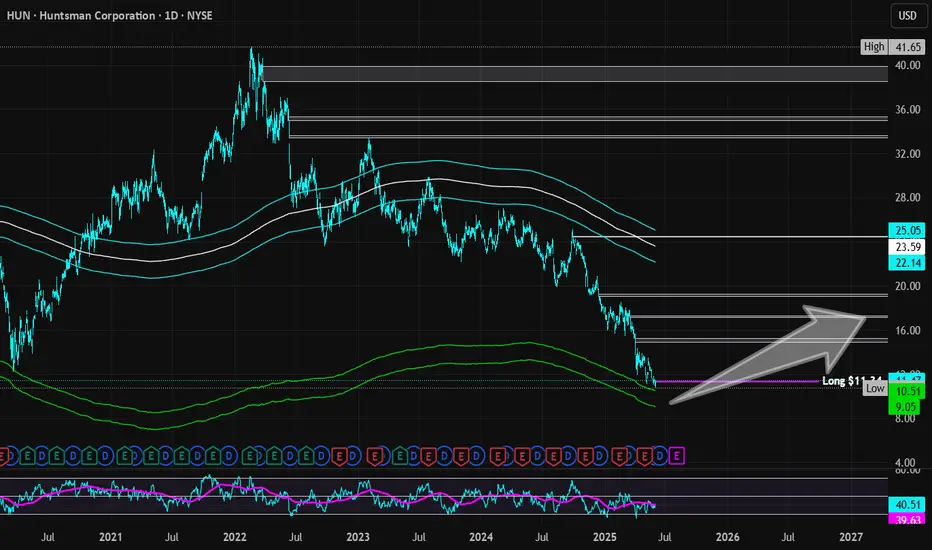
Huntsman Corporation | HUN | Long at $11.34The stock price for Huntsman Corp NYSE:HUN , a manufacturer of organic chemical products, has dropped significantly since its peak in 2022 ($41.65). This was due to lower sales volumes, weak demand in construction and transportation, higher input costs, and European operational challenges, including a $75M hit from closing a German Maleic Anhydride facility. This year (2025) is anticipated to be its worst earnings year, and the stock is priced as such. However, this stock is historically cyclical, and the company expects recovery / growth again in 2026. Moving forward, earnings are forecast to grow and the company is trading at good value compared to peers and the industry. While many headwinds may still exist with tariffs, etc., insider are grabbing shares and large options positions (very bullish). With a book value of $17, debt-to-equity at 0.8x, quick ratio under 1, etc., the company appears healthy.
From a technical analysis perspective, the stock price just barely missed my "crash" simple moving average area (currently between $9.00 and $10.50). It may reach those levels and below in 2025, for which I will add another position as long as fundamentals do not change. This moving average area often signifies "bottom" territory and historically, the stock has rebounded from this area. While my entry at $11.34 may be a little early, predicting true bottoms isn't my trading method and I hope to strengthen the position at lower trading prices.
Targets:
$15.00 (+32.2%)
$17.25 (+49.9%)
HTR trade ideas
$HUNPotential "abc zigzag" located after a recent 5 wave to the downside. This abc zig zag could be in the middle of another 5 wave downtred. Regardless, I'm looking for a retracement leg at this location where we just broke a recent support and if this is an abc zigzag within this wave 3 to the downside then maybe we get a wave 4 bounce. Looking for $19.80.

Topping Pattern Example (Head and Shoulders)Hunstman is a chemical manufacturer whose earnings have plummeted over 85% compared to the first half of 2022. The chart is a prime example of a large head & shoulders pattern. Analysts expect its earning to remain depressed and the chart shows signs of Distribution over the past 2 years.

Huntsman (HUN) - Head and Shoulders?Possible Head and Shoulders pattern with Neckline @ $24. A break would give readable targets @~ $14ish. This also coincides with trend channel.

Huntsman Squeezes at Potentially Key LevelChemical maker Huntsman might not be the kind of stock traders often watch, but it has some potentially interesting chart patterns.
First is the level around $33.50, near the highs in November. Prices have been holding it in recent weeks as the broader market tumbled. Is old resistance becoming new support?
Second the current range is turning into a triangle. Also notice how Bollinger Bandwidth has squeezed as movement narrows. Today it’s trying to escape the pattern.
Third, HUN has been consolidating above its 200-day simple moving average (SMA).
Fourth, MACD has started rising this month.
Finally, the stock has limped since an activist-investor raid failed on March 25. But it jumped on strong earnings the last two quarters. Management cited “higher selling prices” for its products in the April 28 release. Inflation isn’t bad news for all companies, it seems.
TradeStation has, for decades, advanced the trading industry, providing access to stocks, options, futures and cryptocurrencies. See our Overview for more.
Important Information
TradeStation Securities, Inc., TradeStation Crypto, Inc., and TradeStation Technologies, Inc. are each wholly owned subsidiaries of TradeStation Group, Inc., all operating, and providing products and services, under the TradeStation brand and trademark. You Can Trade, Inc. is also a wholly owned subsidiary of TradeStation Group, Inc., operating under its own brand and trademarks. TradeStation Crypto, Inc. offers to self-directed investors and traders cryptocurrency brokerage services. It is neither licensed with the SEC or the CFTC nor is it a Member of NFA. When applying for, or purchasing, accounts, subscriptions, products, and services, it is important that you know which company you will be dealing with. Please click here for further important information explaining what this means.
This content is for informational and educational purposes only. This is not a recommendation regarding any investment or investment strategy. Any opinions expressed herein are those of the author and do not represent the views or opinions of TradeStation or any of its affiliates.
Investing involves risks. Past performance, whether actual or indicated by historical tests of strategies, is no guarantee of future performance or success. There is a possibility that you may sustain a loss equal to or greater than your entire investment regardless of which asset class you trade (equities, options, futures, or digital assets); therefore, you should not invest or risk money that you cannot afford to lose. Before trading any asset class, first read the relevant risk disclosure statements on the Important Documents page, found here: www.tradestation.com .


Huntman Corporation USA Sun Storm Investment Trading Desk & NexGen Wealth Management Service Present's: SSITD & NexGen Portfolio of the Week Series
Focus: Worldwide
By Sun Storm Investment Research & NexGen Wealth Management Service
A Profit & Solutions Strategy & Research
Trading | Investment | Stocks | ETF | Mutual Funds | Crypto | Bonds | Options | Dividend | Futures |
USA | Canada | UK | Germany | France | Italy | Rest of Europe | Mexico | India
Disclaimer: Sun Storm Investment and NexGen are not registered financial advisors, so please do your own research before trading & investing anything. This is information is for only research purposes not for actual trading & investing decision.
#debadipb #profitsolutions

HUN New All Time HighsHuntsman Corp (HUN) made a New All Time High and closed above it
Breakout of 2 Year Long Base
Well defined risk reward
Price well above 200 DMA
Above average volume


HUN, MACD Histogram just turned positiveThis is a Bullish indicator signaling HUN's price could rise from here. Traders may explore going long the stock or buying call options. Tickeron A.I. dvisor identified 49 similar cases where HUN's MACD histogram became positive, and 41 of them led to successful outcomes. Odds of Success: 84%. Current price $23.86 is above $22.85 the highest resistance line found by Tickeron A.I. Throughout the month of 09/03/20 - 10/06/20, the price experienced a +5% Uptrend. During the week of 09/29/20 - 10/06/20, the stock enjoyed a +7% Uptrend growth.
Bullish Trend Analysis
The Momentum Indicator moved above the 0 level on October 05, 2020. You may want to consider a long position or call options on HUN as a result. In 63 of 75 past instances where the momentum indicator moved above 0, the stock continued to climb. The odds of a continued upward trend are 84%.
The Moving Average Convergence Divergence (MACD) for HUN just turned positive on October 06, 2020. Looking at past instances where HUN's MACD turned positive, the stock continued to rise, Tickeron A.I. shows that in 41 of 49 cases over the following month. The odds of a continued upward trend are 84%.
Following a +6.35% 3-day Advance, the price is estimated to grow further. Considering data from situations where HUN advanced for three days, in 251 of 316 cases, the price rose further within the following month. The odds of a continued upward trend are 79%.
HUN may jump back above the lower band and head toward the middle band. Traders may consider buying the stock or exploring call options.
The Aroon Indicator entered an Uptrend today. Tickeron A.I. detected that in 214 of 262 cases where HUN Aroon's Indicator entered an Uptrend, the price rose further within the following month. The odds of a continued Uptrend are 82%.

HUNTSMAN CORP Analysis Hey traders, HUNTSMAN CORP is in a bullish continuation with a strong buying volume, it is located on the vwap and on a strong trend support. So we have a strong propability to break the vwap in force to reach more than half of the equilibrium zone. So it's going to breakout the area to arrive in a new one and go to the next higher which corresponds to the top of the equilbre zone.
Please LIKE & FOLLOW, thank you!

$HUN daily #chart with potential triple bullish #breakout$HUN stock price has been range trading / consolidating for 12 months inside the purple rectangle (with the exception of 2 failed breakout attempts in FEB and APR 2019)
After the summer bottom around the end of AUG'19 stock has rallied towards the top of the range around 23.81 but failed to breakout and instead started to form an ascending triangle ( dotted black lines )
Company posted earnings in late OCT'19 and since then the price is trading inside a symmetrical triangle (blue lines)
As seen on the chart the price will reach the tip of both triangles soon, so watch the stock for a potential BREAKOUT AND CLOSE above the resistance line at 23.81
Targets are as follows:
T1 - 26.85 measured move from the symmetrical triangle
T2 - 29.13 measured move from the ascending triangle
T3 - 30.04 measured move from the rectangle
As a side anecdote GS just upgraded the stock to strong BUY and 29.00 target, so don't know if is good or bad :)
Good luck,
TA


HUN -- I'm Home!Williams Trader loving this one suddenly
manage your own risk
much love
gl hf
xoxo
snoop


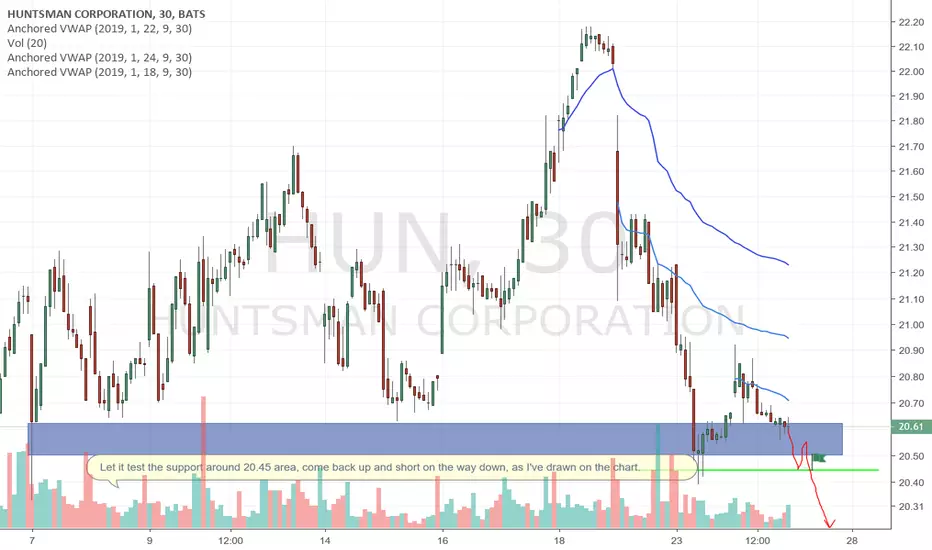
Potential breakdown!!!NYSE:HUN Let it test the support around 20.45 area, come back up and short on the way down, as I've drawn on the chart.
Please like and comment if you like my ideas. THANK YOU!!!
Please note that this information is not a recommendation to buy or sell. It is to be used for educational purposes only.
Descending Triangle HUN Hourly A descending triangle formed on HUN's hourly time frame. Looking for break lower as the weekly and daily charts are both bearish based on price trading below 50/200 MAs.


Huntsman Hey Folks,
First time on here. I like to trade HUN because it is predictable from a technical analysis standpoint. Looks like we should be headed down, so I am prepared to close out my buy position.
Have a great day,
