Microsoft on CD leg of Crab patternA break above 441 for confirmation, will lead prices to 516, 20% upside
MSF trade ideas

Microsoft Mega DistrubitionWhile everyone is paying attention to:
1)SPX ATH
2)Small Caps
3)Crypto
and soon to:
4)Stonks meme plays
One of the leaders of the cycle that started in 2009 is silently on distribution mode in my most honest opinion.
Crazy how nobody... is talking about this...
And it's not only Microsoft that is in this mega distribution all the rest BIG TECH that drove the indices to ATH are in somehow similar positions. What is left? Small caps!!!
And nothing diverts your attention better than the adrenaline of crypto and memes!

" stock market is all about emotions " #1 Catalyst, MicrosoftYesterday was crazy..
dealing with some people who needed some help
and were not happy
that i could only help so little
i had no referee or someone
to direct them to for more help
and that made me feel sad
as i could feel their anger
The stock market is all about emotions
and you and i have to learn how to
control our emotions.
Yesterday i saw this stock NASDAQ:MSFT
but i was too tired to write an article about it
and so i had opted to write about
This stock NASDAQ:META instead..
But either way, after seeing this
one on my screen
I am thinking its a good swing trade.
Also note that the dividend report is happening
this month..this could be the main
catalyst for this stock as well.
Watch this video to learn more about
->the breaking news
->the key facts
->the rocket booster strategy
Rocket boost this content to learn more
Disclaimer:Trading is risky please learn risk
management and profit taking
strategies because you will lose money
whether you like it or not.

$MSFT Burn Baby, BurnIt does not take a rocket scientist to see that NASDAQ:MSFT is forming a well developed Head and Shoulders Bearish Pattern.
Plan on a moderate target but expect the dump is my motto.
When she goes, she will take the market with it. Is there any surprise BITSTAMP:BTCUSD will dump at the same time too?
The tech sector is trading near 82 times their forward earnings. It won't be long now.

Round Two MSFT for a Second Shot at $456After being stopped out previously, Microsoft (MSFT) is once again positioned for a potential breakout. With renewed bullish momentum building around the $423 entry level, MSFT aims to push through key resistance at $441.85, targeting a move to $456. The updated setup offers an appealing risk-to-reward ratio, with a stop-loss set at $407 to manage downside risk.
Microsoft's robust fundamentals remain a driving force, with its leadership in cloud computing through Azure and continued advancements in AI with Copilot. Demand for these solutions continues to grow, positioning Microsoft as a critical player in tech innovation and enterprise software.
With both technical support and strong growth drivers, MSFT is primed for another attempt at reaching the $456 target.
Follow on X @The_Trading_Mechanic for more prescriptions for market gains!

consolidationMICROSOFT IS consolidating in an asymmetrical Triangle close to an important resistance level highlighted in yellow and support in Blue. Keep and eye out for breakouts and volume and possible retest.
Thank you all for your kindness

MICROSOFT: Channel Down bottomed. Bullish wave starting to 540.MSFT is neutral on its 1D technical outlook (RSI = 48.171, MACD = -0.910, ADX = 23.585) as since the September 6th Low it has been ranging sideways. Despite the lack of trend, this price action still hit the bottom of the long term Channel Up and technically the new bullish wave should start. The conditions for that are perfect as the 1D MACD just formed a Bullish Cross. The last bullish wave touched the HH trendline of the Channel Up after surpassing the 1.786 Fibonacci extension. That is our current target (TP = 540).
See how our prior idea has worked out:
## If you like our free content follow our profile to get more daily ideas. ##
## Comments and likes are greatly appreciated. ##

MSFT Long: Multi-Timeframe Analysis and Elliot Wave InsightMicrosoft is presenting a strong long opportunity, with a setup confirmed across multiple timeframes: the 2-day, 4-hour, and weekly charts.
Trend Positioning: MSFT is trending upward, with current price action situated near the lower boundary of its ascending channel (highlighted by green trendlines). This area also aligns with key moving averages (7, 20, 50, and 100-day MAs), adding strong confluence at this support zone.
Elliott Wave Perspective: The weekly chart suggests that Microsoft is in a corrective Wave 4 within a larger upward trend. This Wave 4 correction has respected common Fibonacci retracement levels (38.2% and 50%) and appears set to complete, potentially paving the way for a Wave 5 move toward new highs.
Hard Invalidation: If price falls below ~366 (lower orange horizonal line on 2-day), the Elliott Wave structure would be invalidated, signaling a break in the uptrend.
Intermediate Support: A drop below 385-389 range would reduce confidence in this path, although it wouldn’t fully invalidate it.
Trade Targets:
Primary Price Target: ~468, representing approximately an 11% gain (Risk-Reward Ratio: 3.5 based on current price).
Secondary Price Target: >520, representing a ~25% gain (Risk-Reward Ratio: ~7.0). This target aligns with the upper boundary of the rising channel.
Estimated Timeline:
Given that the primary analysis is based on the 2-day chart, this move is expected to unfold over the next 3-4 months.
Risk Management:
Stop Loss: Suggested stop loss is within the 399.95 - 405.33 range, beneath key support on 4 hour. For those with large risk appetite, can set it for the identified bearish turn point int he 385-389 range.

Microsoft Golden Upside Potential Opportunity (+20%?) In my opinion and for the long run, I think Microsoft is well positioned to benefit from the AI Boom. Especially the fact that it owns significant stake of OPENAI (49%). Also many companies are using Microsoft's infrastructure (Azure) to build on their products. Hence, they will be almost forever customers if they to avoid transfer costs. Essentially, the company will be making money from charging those companies directly through the company and indirectly through it's ownership of OpenAI. Also, technically speaking and considering the potential impact of the election. I think this company is very well positioned.
What are your thoughts? I'd like to hear any agreeing or opposing perspectives?

Assessing Low-Risk Opportunities
Microsoft Corporation (MSFT) has recently been under scrutiny as its stock price
faces pressure amidst a mixed performance in the tech sector. Last week's
trading session reflected a cautious sentiment among investors, especially as
major tech players like Microsoft appear to be struggling. Despite a strong
brand and proven market position, Microsoft's stock movement exhibited a bearish
pattern.
Recent Performance: Microsoft's performance has shown a decline, as seen in its
challenges against key resistance levels. The stock has remained around its
50-day in addition to its 200-day moving averages without significant upward
momentum. The current trading environment has underscored the importance of
watching for possible recovery signals, as the broader technology sector is
displaying an overall mixed sentiment.
Key Actionable Insights:
- Monitor key resistance levels closely; MSFT's recent price action suggests a
struggle around these points.
- Given that MSFT is deemed a low-risk investment, it may provide a more secure
entry point for investors looking for stability amidst broader market
fluctuations.
Expert Opinions:
Experts remain cautious about Microsoft due to underperformance compared to
other tech giants. Current discussions are focusing on the importance of
innovation and responsiveness to market changes. While many see potential for
recovery, they recommend a wait-and-see approach before making significant
investments.
Sentiment Analysis:
- Current sentiment: N/A
- Last week's sentiment: N/A
- Sentiment change: N/A
- Total mentions across all sources: 0
Technical Levels:
Based on the wisdom of all professional traders, MSFT has identified key levels
to monitor moving into next week:
- Target 1: $345
- Target 2: $350
- Stop 1: $330
- Stop 2: $325
If you're looking for longer targets with expected timelines, keep an eye on the
potential breakout at $360 over the next month for possible resistance
challenges.
Notable News:
The recent earnings reports from Microsoft have further emphasized the
divergence in performance among major tech companies. While brands like Nvidia
are hitting all-time highs, Microsoft's stagnant movement has raised eyebrows in
the investment community. This highlights the need for a renewed focus on
innovation in its product offerings.

MSFT GOOD OR BAD TRADESo let me know your thoughts on this trade. Should I stay in it or get out while I'm behind.

Microsoft Head & Shoulders, $MSFTMicrosoft, the third largest company by weight continues to struggle since July. The troublesome part is that it appears to be building up a massive head and shoulders pattern all of this year. Additionally, the third shoulder is also looking like a huge bear flag and remains weak compared to the overall market.

Microsoft: Progress!The Microsoft stock has now successfully completed wave B in turquoise at $444.95. So, now we locate the price in the subsequent wave C, which is set to finalize the overarching three-part wave in dark green. This suggests further declines, with an ideal low just below $400. Following the low of the overarching wave , Microsoft should initiate a new upward impulse. While there’s a 25% chance that wave alt. in dark green has already hit its low, this alternative scenario will only be confirmed if the stock breaks above $469.55.

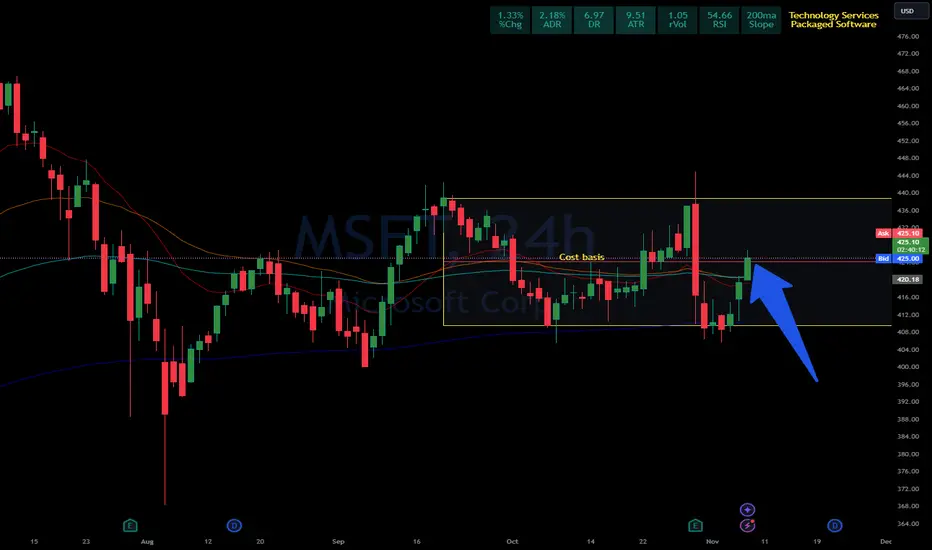
MSFT Microsoft 24Hr potterboxMicrosoft is above the cost basis line . or the red line in the middle. If Microsoft opens above $423.71 cost basis it will be going up. It has to break the top of the box in order for it to be a breakout in my opinion. we shall see tomorrow.
$MSFT - gap entry to $432. looking for gap fillMSFT - stock is in the earnings gap to $432.72. looking for strong reversal here. calls good to add as long as $420 holds. stock is decent on indicators.

Microsoft LONG Longing MSFT here targeting the gap fill to 430 took bottum liq creating a double bottom with increasing rsi causing the divergence. Will take profits going up but final target will be a complete gap fill to 431.
Idea is invalidated if the 4H closed below red line at 405.9 going for a 3R:R

MICROSOFT has bottomed. Dont miss this once/year buy opportunityMicrosoft (MSFT) has been trading within a Fibonacci Channel Up since the October 2022 market bottom following the Inflation Crisis. Since the August 05 2024 Low on the 1W MA50 (blue trend-line), the stock has struggled to get detached from it and stage a sustainable rally.
This prolonged volatility can be seen however on both previous Lows of the Channel Up, while the price was attempting to price a bottom. Technically it is around the same levels as February - March 2023 (again below the 1W MA50).
As you can see, this kind of buy opportunity emerges roughly once a year on MSFT and posts a rise or roughly +50% from the bottom, with the last Higher High priced on the 1.5 Fibonacci extension.
As a result, our long-term Target is now set at $550.
-------------------------------------------------------------------------------
** Please LIKE 👍, FOLLOW ✅, SHARE 🙌 and COMMENT ✍ if you enjoy this idea! Also share your ideas and charts in the comments section below! This is best way to keep it relevant, support us, keep the content here free and allow the idea to reach as many people as possible. **
-------------------------------------------------------------------------------
💸💸💸💸💸💸
👇 👇 👇 👇 👇 👇

IS THIS MAG7 DARLING ABOUT TO CRASH?!NASDAQ:MSFT
🔥 IS NASDAQ:MSFT ABOUT TO FALL OVER 21%?! 🔥
Let's not panic yet, but Microsoft's weekly charts are flashing some intriguing signals. Here’s the lowdown:
As long as NASDAQ:MSFT stays within its symmetrical pattern, we’re in the clear. But if it breaks downward, we’re looking at a potential 6% drop from the Volume profile shelf and possibly a dangerous 22% plunge, breaking the 2024 Head & Shoulders pattern. Enter the "Low Five Setup"—the bearish counterpart to my "High Five Setup."
Key factors to watch:
- Williams %R: Lower High
- MACD: Dangerously close to crossing below the zero line (BEARISH)
- RSI: Below RSI MA with lower highs, at 46—lots of room before oversold
- Trend: Lower high, red through yellow downward move indicating a downtrend on the weekly chart
Microsoft has been Wall Street’s golden goose, untouched by the FUD that hit the MAG7 stocks. Apple had China FUD, Tesla faced the ELON BAD FUD, Google with AI SEARCH FUD, Amazon with spending and margins FUD, Meta with metaverse spending FUD, and Nvidia with growth concerns FUD.
But as Willy Wonka taught us, every golden goose lays a bad egg sometimes. This is a weekly chart setup, so it will take time to play out. No one's immune to Wall Street’s FUD wrath, not even Microsoft. We shall see what happens...
P.S. I’m not in this name yet—just putting it on your radar. We’re early to the party, just like I always am with my setups. If you’re still here, you value solid, well-thought-out market analysis. Props to you!
Have a great Sunday, friends! 👊
Not Financial Advice #HighFiveSetup #LowFiveSetup

Weekly Implied Volatility Move Is 437.50 From the options chain on 10-11 exp. Its telling me prices wants 437.50 by end of week.
Pop to the 420 and a move lower is possible before the rally hits.
If my pink level breaks, were so screwed lmao

MSFT Channel BreakPretty significant channel break here on MSFT. This is the uptrend from January and it may be coming to an end if it can't recover soon. We also have a shorter term uptrend/bear flag on the 15m that has been broken to the downside as well.
Doesn't look good IMO, first downside target is around $390 - $385.

MICROSOFT SELL SETUPI have a Weekly uptrend with a BOS. Im looking for a weekly retest for a continuation, so Im waiting for a choch on the Daily tf to start the retracement for the weekly retest


Microsoft Corp.Hello,
Daily chart of Microsoft stock, with regression line and volumes.
The price has just broken out of the channel.
Make your opinion, before placing an order.
► Thank you for boosting, commenting, subscribing!
