Microsoft Weekly AnalysisMicrosoft Corporation is an American multinational computer company based in Redmond, Washington State. Created by Bill Gates and Paul Allen on April 4, 1975, it changed its name on June 25, 1981, and then took its current name again in 1983.
MSF trade ideas

WOW Massive Double Top on #MSFTMr Softee looks like it wants to melt
Incredible if this triggers fulfils this pattern.
Linear target is actually worse than the Logarithmic target.
massive bearish divergence on the Monthly RSI
If was an #microsoft stock holder and in considerable profit...
I would definitely want to lock in those gains!

MSFT Entry, Volume, Target, StopWhen price clears: 318.35
With daily volume greater than 28.16M
Target: 367.50
Stop: Depending on your risk tolerance; 302.00 gets you 3/1 Risk/Reward.
This trade idea is not trade advice. This swing trade idea is strictly based on my ideas and technical analysis. No due diligence or fundamental analysis was performed while evaluating this trade idea. Do not take this trade based on my idea, do not follow anyone blindly, do your own analysis and due diligence. I am not a professional trader.

Attractive MSFT short trade?There appears to be some downward momentum, evidenced by a bearish RSI divergence in the one-day timeframe of MSFT. A potentially good trade strategy might be to initiate a short position at the 50 EMA, with a target to exit at the midpoint between the current resistance and support.

MSFT finding support on lower daily trend line.MSFT finding support on lower daily trend line in larger region.
Go long: 12/23 327.5 Calls.

MICROSOFT: Last chance to rebound. Selloff under this trendline.Microsoft is on a neutral technical setting on the 1D timeframe (RSI = 47.707, MACD = 0.040, ADX = 29.959) despite trading on the HL of the Rising Megaphone for the second time in 30 days. As long as this trendline holds, MSFT is a buy signal, targeting R1 (TP = 366.50). A cross under the Bullish Megaphone, will be a sell signal aiming at the 1D MA200 (TP = 300.00).
It is worth mentioning that the 1D MACD formed today a Bearish Cross, the first since July 21st. The pattern could be replicating the price action of September-November 2022.
## If you like our free content follow our profile to get more daily ideas. ##
## Comments and likes are greatly appreciated. ##

Potentiel short On MICROSOFT Hello,
Microsoft could potentiely going down to hit 314 point with stop loss of 332,

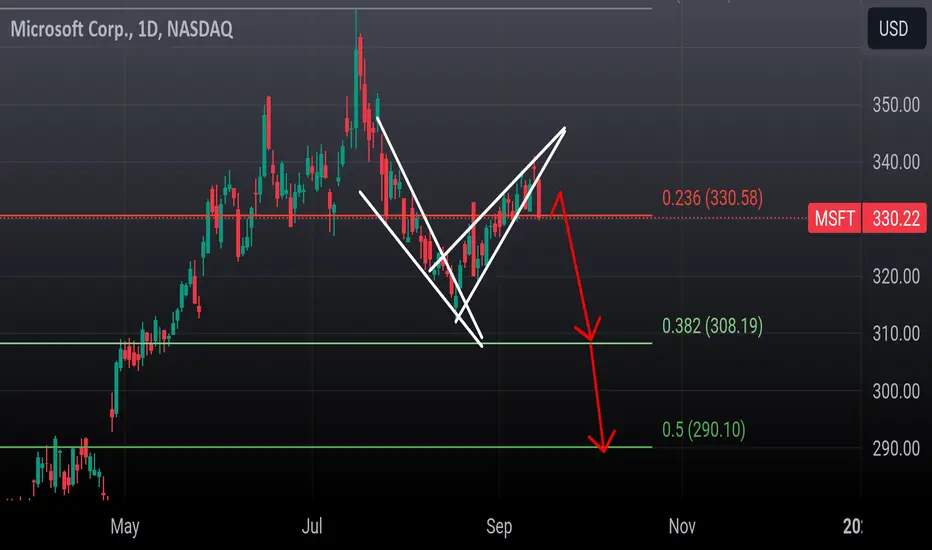
MsftGap down below a rising wedge here.
Has been distributing since late June. Early in the week I'm looking for a retest of 334-336 max.
After that retest I think we will begin the correction down to the 200sma or 290.
1st target is 323
2nd target 308
Final target 290
The Bearish divergence on the daily RSI will go oversold before msft bounces
Microsoft accidentally revealed that Xbox Series X|S Microsoft accidentally revealed that Xbox Series X|S sales exceeded 21 million units worldwide
As posted by Twitter user 'John Welfare' after being spotted by @Lukastaves Microsoft held a presentation during this year's BIG Festival in Brazil which is taking place from June 28th through July 2nd. Interestingly, during this presentation, Microsoft showed a sheet revealing Xbox console sales numbers, including sales numbers for the Series X|S.
I don't think this is news at all.
Graphically, the price is testing its monthly high.
In two years, a test of the level.
I think it's a great zone to sell the stock and buy it back cheaper.
marked the green zone.
Waiting for the decline.
if you like the idea, please "Like" it. This is the best "Thanks!" for the author 😊 P.S. Always do your own analysis before a trade. Put a stop loss. Fix profits in installments. Withdraw profits in fiat and please yourself and your friends.

Microsoft to $390/$400 by year end. Great cup & handle set up here playing out in Microsoft Corp. October -> December we likely see a catch up trade by institutional investors who missed the tech rally in the first half of the year.

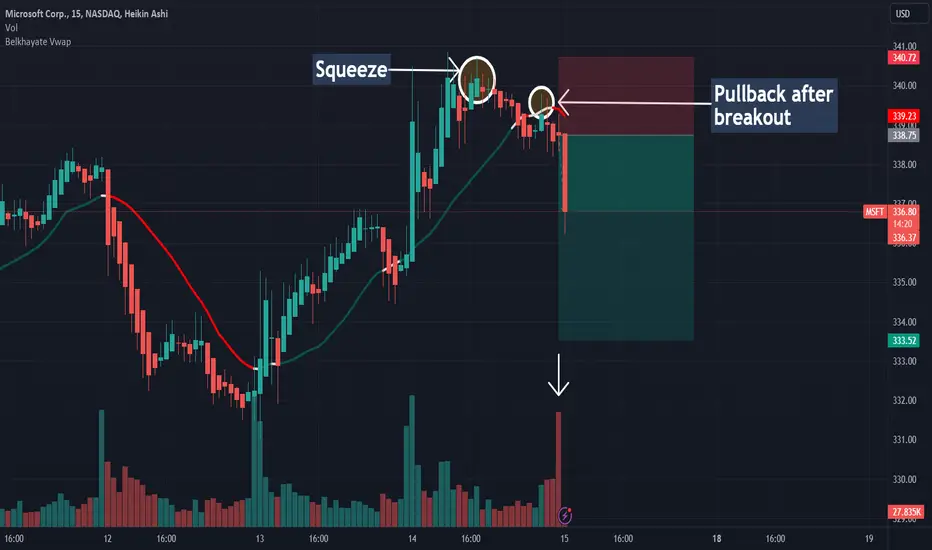
MSFT: Sell ideaSell idea on MSFT as you see on the chart because we have:
- Squueze with a large green volume;
- Pullback on vwap after breakout.
Microsoft's Remarkable Ascent in AI: A Key to its 40% YTD Stock Microsoft's Remarkable Ascent in AI: A Key to its 40% YTD Stock Surge
Microsoft's stock has experienced an impressive 40% year-to-date surge, driven significantly by its dominant position in the realm of artificial intelligence (AI). With its early investments in AI, Microsoft has gained a substantial lead over its competitors. Companies like Amazon and Alphabet have been playing catch-up in the first half of the year, striving to match Microsoft's strides in the AI arena.
However, Microsoft's strength extends beyond AI, as it boasts a portfolio of high-performing productivity services with millions of users worldwide. This strong brand recognition and extensive user base position Microsoft as a potential go-to choice for anyone seeking AI services. Here are three key insights that savvy investors are aware of regarding Microsoft's current standing:
Charting a Course Towards $10 Billion in AI Revenue:
During the recent Goldman Sachs Communacopia & Technology Conference, Microsoft's Chief Financial Officer, Amy Hood, reaffirmed the company's ambitious projection: the AI division is poised to surge past the $10 billion revenue milestone at an unprecedented pace, surpassing all previous business endeavors.
Microsoft's strategic investment of $1 billion in the ChatGPT developer, OpenAI, in 2019, has been instrumental in catalyzing its ascendancy in the AI realm. This partnership has granted Microsoft exclusive licenses to numerous OpenAI AI models, leading to transformative enhancements across various in-house platforms. Iconic products like Word, Excel, Bing, and Azure have all undergone substantial AI-driven upgrades. Furthermore, Microsoft's subscription-based Microsoft 365 office suite is on the brink of introducing an array of AI-infused products, ushering in a new era of productivity.
The transformative potential of AI extends across various industries, including education, healthcare, consumer goods, robotics, autonomous vehicles, and more. Persuading businesses to integrate AI tools into their daily operations holds great promise, and Microsoft is well-positioned to capitalize on this trend.
With a commanding presence through its cloud platform, Azure, and an extensive suite of productivity tools, Microsoft is poised to become the preferred destination for enterprises seeking AI services to enhance operational efficiency. The combination of iconic brands—Windows, Office, and Azure—may give Microsoft an edge over formidable rivals like Amazon in the AI-driven landscape.
Strategic Investment in the Semiconductor Arena:
Microsoft's deep involvement in semiconductor technology lays a strong foundation for the long-term growth of the AI market. Recognizing the importance of robust hardware in the AI industry, Microsoft has made steady investments in various chip manufacturers to diversify the ecosystem, which has long been dominated by Nvidia.
Earlier this year, Bloomberg reported Microsoft's substantial financial and engineering support for Advanced Micro Devices (AMD) in its AI chip expansion efforts. This month, the chip startup d-Matrix secured $110 million in funding, with Microsoft among its prominent backers.
D-Matrix focuses on the "inference" facet of AI processing, avoiding direct competition with Nvidia in training large AI models. Microsoft's investment strategy here represents strategic diversification, aligning with a distinct segment of the chip market, separate from its engagements with AMD and Nvidia.
While d-Matrix's 2023 revenue projection is around $10 million, primarily from chip testing, it anticipates substantial growth as demand for AI chips rises. The company targets annual revenues ranging from $70 million to $75 million within the next two years.
Sustained Dividend Growth:
Unlike tech giants like Amazon and Alphabet, which have forgone dividend offerings, Microsoft has remained a dividend-friendly player, positioning itself at the forefront of the market. The company boasts a dividend yield of 0.81%, a notable figure compared to Apple's 0.53%.
What truly underscores Microsoft's appeal to dividend-seeking investors is its consistent upward trajectory in dividend yield over the past decade. Microsoft's cash dividend has grown from $0.28 in 2013 to an impressive $0.68 this year. As Microsoft expands its presence in the AI landscape, which is projected to sustain a robust compound annual growth rate of 32% until 2030, the potential for amplified earnings augments the possibility of further dividend increases.
While Microsoft's dividend yield may not rival that of industry peers like Verizon, which offers a substantial yield of approximately 7%, the company's unwavering commitment to growth solidifies its status as an attractive investment proposition, making its stock increasingly compelling.
In conclusion, Microsoft's strategic positioning in the AI industry, its investments in the semiconductor sector, and its consistent dividend growth make it a standout choice for investors seeking long-term value and potential growth in their portfolios.

MSFT26.07.2023 shortAsset and Time frame -MSFT 4H/DAILY
Entry Price -335
Exit(Stop Loss) -349.73
Exit(Take Profit) -293.27
Price made a divergence on the daily time frame with a big engulfing bearish candle and proceeded to build momentum to the downside by breaking the 100 MA of the 4H chart.
Shorting is always troublesome, not to mention shorting a big company like Microsoft, so a smaller risk of 0.70% instead of the regular 1%.

MSFT MicrosoftTechnically, only on the weekly chart, which is not a short period of time. The stock has reached a support area to raise it to the upside, and the stock is still rising, and it is very likely that it will rise to $350. The area between $330 and $325 is considered a good area for buying in the medium term, taking into account that breaking the trend line downward. It can be considered dangerous for speculators

Microsoft will continue uptrend For all trade on my Auto Harmonic patterns indicator trade setup -
Risky trades can take trade after crossing 23.6% on either side and safe traders can take trade after 41% We can start buying when our Trailing SL hit at 23.6% with SL of recent low our Target will be 41%, 78.6% , 127.2% 161.8% and 223.6 % , when reversal pattern appears on chart we have to trail our SL if trailing SL hit exit from long trade and initiate sell trade ,

MSFT: Buy ideaBuy idea on MSFT as you see on the chart after the breakout with force the vwap and the resistance line by a big green candle with alarge green volume.Thanks.

MSFT Potential Rise and fall from today until until the 13MSFT will continue its bullish rise until the 13 of september

MICROSOFT Final chance to buy for $380.Microsoft (MSFT) has been trading within a Channel Up on the 1D logarithmic time-frame since December. At the moment, it is on the 1D MA50 (blue trend-line) which was previously the short-term Resistance. We are also near the 0.5 Fibonacci retracement level, an important benchmark for this recovery attempt. Practically this is the new bullish leg following the bottom on the Higher Lows trend-line of the Channel Up on August 18.
The 1D RSI got rejected on the Symmetrical Resistance of the January 27 High and even since the Support Zone, the pattern seems to be on a perfect symmetry. It appears that we are on the respective 1D MA50 pull-back as on January 30. That bullish wave targeted the 1.236 Fibonacci extension before the next 1D MA50 pull-back.
As a result we are bullish, targeting the new 1.236 Fibonacci level at $380.00.
-------------------------------------------------------------------------------
** Please LIKE 👍, FOLLOW ✅, SHARE 🙌 and COMMENT ✍ if you enjoy this idea! Also share your ideas and charts in the comments section below! **
-------------------------------------------------------------------------------
💸💸💸💸💸💸
👇 👇 👇 👇 👇 👇

MSFT: Sell ideaSell idea on MSFT as you see on the chart. We will have a big probability to have a downtrend if only if we have the breakout with force the support line and the vwap indicator by a big red candle with a large red volume.Thanks!

#MSFT $20 Higher From Support, What Next?In this update we review the recent price action in Microsoft and identify the next high probability trading opportunities and price objectives to target
PAST PERFORMANCE NOT INDICATIVE OF FUTURE RESULTS

MSFT, Flag Confirmed As Mentioned, Next Steps At The Horizon!Hello Traders Investors And Community, welcome to this update-analysis where we are looking at recent events, the current price-structure-formation, and what we can expect from MSFT currently the second-largest stock from the market capitalization aspect. As I mentioned in previous analysis MSFT was forming a possible bull-flag which then confirmed rightfully to the upside and reached its first bull-flag-target I pointed out it will reach when confirmed if you did not saw this analysis already I highly recommend that you watch it when going to my account. Overall there are some interesting signals and signs I detected in the chart which are important to look at and can determine the further outcome of MSFT sustainable therefore we are looking at the 4-hour chart. As the corona cases increasing again this can indicate new supply and bearishness entering the market therefore a smaller when not bigger pull-back also in MSFT is not far from sight as the major market begins to struggle we have to examine if important support levels keep holding or bigger bearish pullbacks awaiting in destiny.
Initial Analysis According The Subject with MSFT (4-Hour Timeframe):
As you can eliminate when looking at my chart now is that the stock is trading clearly above the previously established all-time-high-condition and formed some new higher highs in the structure which are building a rising resistance line that you can see marked in blue within my chart. This resistance line serves as strong resistance as the stock already bounced to the downside several times there which is marked in my chart, therefore, this third touch of the line will highly likely provide a pull-back which will end in the minimum a correction when not a bigger pull-back and bearishness. The next important support when this more possible scenario plays out is the previously established support/resistance level at 198 which you can see marked with the black line in my chart that level was also the first bull-flag target which reached now.
When the stock plays out the scenario properly and visits the suspected support level it is from high importance for the further development of bullishness that it confirms this level as support and forms a solid and substantial support base there, otherwise when this does not happen and the stock shows more bearish pressure the further uptrend is in danger, this can confirm together with the possible incoming bearish pressure we have in the main market showing in the major indices like the S&P or the RUSSELL. Therefore we should keep in mind that a clear break of 182.5 will invalidate and inactivate the further bull-flag scenario which can cause more bearish signs and alteration of the dynamic otherwise when the stock holds the level and manages to move higher we can expect it to reach the further bull-flag targets which are far above.
In comparison with the main market, we have this stock as a clear winner from the corona-crisis where we have others which are clearly bearish and showing up bearish formations which are likely to confirm bearish to the downside. As this stock reached all-time-highs, where many stocks are away from it, is stronger than the market but we should remember that this can change especially when corona fears increase again and new bearish fears entering the market which can drag the price down similarly to the scenarios we have seen in March this year where everything fell to the downside, therefore we should be prepared and keep the downside also in mind to not get surprised when it will develop to wage opportunities and possibilities and take the appropriate action in each individual case, this means we need to trade what we see and not what we think as this and mere speculation happens too often these days. After the expect correction provided we will see how it is going further with this stock and if it can hold its established bullish growth or fall back below important support lines.
In this manner, thank you for watching, support for more market insight, have a great day and all the best to you!
Good luck is when opportunity meets preparation, while bad luck is when lack of preparation meets reality.
Information provided is only educational and should not be used to take action in the markets.

Microsoft (MSFT) -> Retesting The All Time HighMy name is Philip, I am a German swing-trader with 4+ years of trading experience and I only trade stocks , crypto , options and indices 🖥️
I only focus on the higher timeframes because this allows me to massively capitalize on the major market swings and cycles without getting caught up in the short term noise.
This is how you build real long term wealth!
In today's anaylsis I want to take a look at the bigger picture on Microsoft.
Looking at the higher timeframe you can see that Microsoft stock is once again retesting the previous all time high at the $340 resistance level.
Furthermore Microsoft is also creating an ascending triangle formation so I would love to see another bearish rejection and then the longer term bullish breakout.
- - - - - - - - - - - - - - - - - - - -
I know that this is a quite simple trading approach but over the past 4 years I've realized that simplicity and consistency are much more important than any trading strategy.
Keep the long term vision🫡

MSFT, Breakout Of The Flag, Targets Ahead After Confirmation!Hello, Traders Investors And Community, welcome to this update-analysis of the MSFT stock where we are looking at the recent events, the current price-structure and what we can expect the next times. As I already mentioned in past analysis MSFT was trading in a possible bull-flag formation which confirmed recently bullish to the upside, if you did not watch this analysis already I highly recommend it to you when going to my account and look at it to have a full-depth-overview. At the moment MSFT is trading at a preeminent level which is the all-time-high and MSFT provided other important technical signals which I detected therefore we are looking at the 4-hour local timeframe.
Initial Analysis According The Subject (4-Hour Timeframe):
As we can examine now when looking at my chart is that MSFT confirmed the bull-flag with solid bullish volatility to the upside where it is trading near the all-time-high which is currently still a decent resistance where we can get a pull-back to confirm the bull-flag a second time, this will be realized when we confirm the level at 190 as resistance and visit the upper boundary of the bull-flag to test it for a confirmation when this happens we need to hold the upper boundary and do not fall back into the channel again because this can possibly invalidate the bull-flag. Therefore it is important to hold the upper boundary and the EMA structure because when we close below these levels we will see increasing of bearish pressure within a high probable spectrum.
At the moment it is possible at hand that MSFT just runs away to make a new high but that will be an unhealthy movement which can turn out to be a bull-trap and confirm to the downside again, the best way will be that MSFT confirms the bull-flag properly a second time, when this happens it can be traded either with an aggressive entry immediately at the higher boundary or with a conservative entry when MSFT visits the highs again which will provide a breakout entry scenario. In both cases, it is wise to wait on the proper confirmation as there is still a possibility given that MSFT falls back into the channel and confirms bearish which is not high at the moment but it should be kept in mind to succeed in this situation with the proper risk-preference.
When we exemplify the fundamental side of things we can explore that MSFT is a decent winner in the current corona-crisis because we had a massive digitalization boom during the lockdowns which is still holding on because more and more people rely on digital economic and ecologic tools increasingly within this crisis. This digitalization boom can increase the next times or decrease as the real economy gets more important, to have a healthy market environment not only within MSFT but also within the rest market we need similar growth in the real economy and stock-market to confirm also fundamentally bullish, without that given we have a speculative rally which is an unhealthy market environment that can turn fastly to the downside, in this case, MSFT will be anticyclical to the rest of the market when it manages increasing growth in the fundamental and technical aspect otherwise it can add to the overall bearish shape we will get in the main rest of the market.
In this manner, thanks for watching, support for more market insight and all the best!
There is a kind of conformity to come in modern markets which is almost a paradise.
Information provided is only educational and should not be used to take action in the markets.
