NVDA Squeezes to $187 or Pullback from Supply? Jul 31NVDA Explodes into Gamma Cloud! Squeeze to $187 or Pullback from Supply?
🔍 GEX & Options Flow Insight (1st Image Analysis)
NVDA just broke through major resistance and is trading at $183.35, sitting in the middle of stacked Call Walls and a strong positive GEX zone. Gamma positioning is highly bullish—but a stall near current levels is possible as dealers begin to hedge less aggressively.
* Call Walls & Resistance:
* ✅ $180.00 → Highest positive NET GEX zone
* ✅ $182.5 → 2nd Call Wall (68.77%) — current area of battle
* 🧱 $187.5–190.0 → GEX9 and GEX10 zones = possible squeeze targets
* Put Support:
* 🛡️ $175.18–175.51 → Strong PUT Support zone and demand on price chart
* 🔻 $172.5 → HVL zone = invalidation for breakout thesis
* Volatility Insight:
* IVR 12.6, IVx Avg 41.7 → Neutral-to-low IV
* Calls Bias: 15.4% → Slightly bullish, but not euphoric
* GEX sentiment: 🟡🟢🟢 = Cautiously Bullish
✅ Option Trading Suggestion:
Bias: Bullish with caution around 185
Strategy: Vertical debit call spread
* Entry Idea: Buy 182.5C / Sell 187.5C for Aug 2 or Aug 9
* Stop: Close below 179.65 (trap candle base)
* Target: 187.5 (GEX9 ceiling)
Why this works: NVDA is entering a highly stacked gamma region. If bulls hold above 182.5, momentum may carry price toward the outer GEX bands at 187.5. However, IV is not stretched, so premium decay is a risk—spreads protect against it.
🧠 Technical Analysis (1H Chart) (2nd Image Analysis)
Market Structure & SMC:
* ✅ CHoCH → BOS → BOS confirmed since July 29
* 🚀 Strong bullish continuation from discounted OB area near 175
* NVDA is currently riding mid-upper range of an ascending channel
Trendlines:
* Perfect channel structure respected since July 25
* Currently touching upper channel resistance around 183.35–184.50
SMC Zones & Supply/Demand:
* 🟩 Demand Zone: 175.18–177.32 → Last bullish OB
* 🟥 Supply/Exhaustion Zone: 183.5–185 (purple box) → caution here
🔄 Price Action & Key Levels
* Support:
* 📌 179.65 → Key structure base (trap candle)
* ✅ 177.32–175.18 → Demand + OB + GEX Put Support
* ❗ Below 172.5 = structure breaks
* Resistance:
* 🚩 183.35–185.00 → Supply + top channel + GEX7
* 🧨 187.5–190.0 → GEX9/GEX10 extension zone = possible parabolic breakout
🧭 Scalping / Intraday Trade Setup
🟩 Bullish Setup (Preferred):
* Entry: 182.50–183.00 breakout
* Target 1: 185.00
* Target 2: 187.50
* Stop: 179.65 break & hold
🟥 Bearish Pullback Setup:
* Entry: Rejection at 184.5 supply zone
* Target 1: 180.00
* Target 2: 177.30
* Stop: New high above 185.5
🔁 Summary Thoughts
* NVDA is showing classic breakout behavior with gamma fuel behind the move.
* SMC and structure are fully bullish, supported by rising channel and BOS continuation.
* Price is approaching a key exhaustion zone, so either it breaks through to 187.5 or pulls back to retest 179–177.
* Intraday long trades are favored above 182.5. Swing traders should wait for a dip to demand or a clean breakout above 185.
🚨 Disclaimer:
This analysis is for educational purposes only and does not constitute financial advice. Always do your own research and manage your risk accordingly.
NVD trade ideas

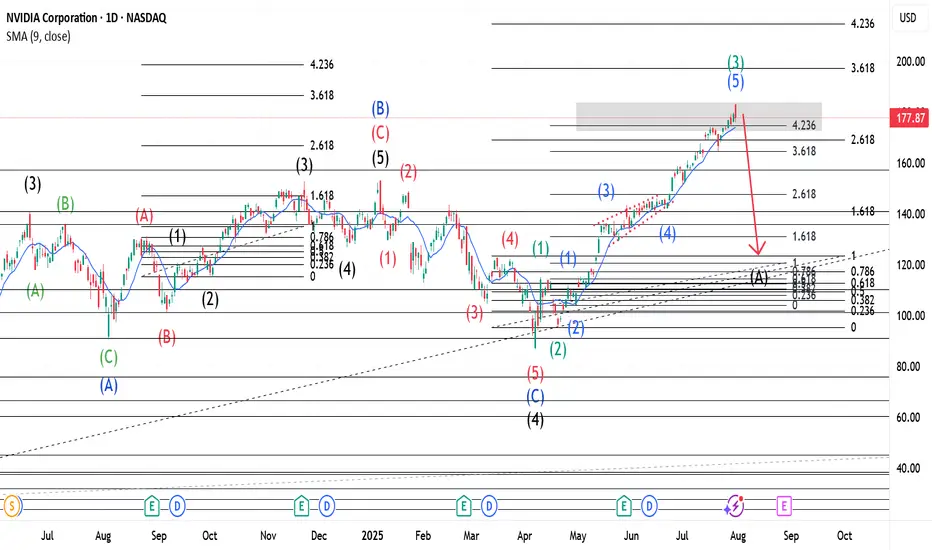
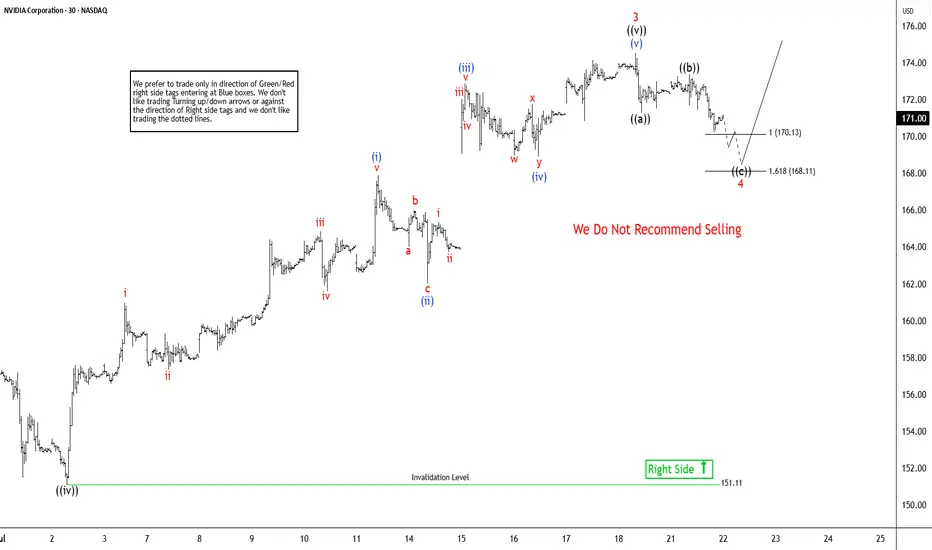
$NVDA ~ An Elliott Wave Breakdown.(Detailed Spectrum)Our Wave 2(Black) of the main wave was a Zigzag hence a Flat for Wave 4(Black). When Wave 3(Black) completed a three wave move, shown in Green, was made, hence A(Blue). Wave B(Blue) went beyond the end of 3(Black) and had 3 waves, shown in Red, also(as expected for Flats). The last of this 3 wave move(Wave c-Red) had 5 waves shown in Black. Upon completion, our Wave B(Blue) was over and we expected a Wave 4(Black). Our Wave 4 made a 5 wave move(Shown in Red) that retested at the 261.8% Fib. level. With Wave C(Blue) complete, it was coined Wave 4(Black). Wave 5(Black) was launched and has a 5 wave move shown in Green. With a Zigzag for Wave 2(Green), a Flat should be expected for Wave 4(Green). Wave 3(Green) has 5 waves with a triangle for Wave 4(Blue). A confirmation at its current location(423.6% Fib. level) would mean that Wave 3(Green) is complete and a Wave A(Black) of the previously mentioned Flat should be anticipated.
NB: The placement of Wave A(Black) of the Flat mentioned above is purely for demonstrative purposes.
NVIDIANVIDIA Corporation is a leading American technology company known for designing and manufacturing graphics processing units (GPUs), system-on-a-chip units (SoCs), and AI computing platforms. Founded in 1993, the company originally focused on gaming graphics but has since evolved into a global powerhouse in artificial intelligence, data centers, autonomous vehicles, and high-performance computing. NVIDIA’s GPUs are widely used not only in gaming and visual computing but also in scientific research, AI model training, machine learning, and cloud infrastructure.
In recent years, NVIDIA has been at the forefront of the global AI boom. Its data center business, powered by its high-end GPU architecture (like the H100 and newer generations), has become a critical backbone for tech companies, cloud providers, and governments seeking to build large-scale AI systems. The company also made major strategic moves through acquisitions and software integration, further solidifying its dominance in the AI hardware space. NVIDIA’s strong financial performance and technological leadership led to rapid growth in its market capitalization, briefly making it one of the most valuable companies in the world.
As of August 2025, NVIDIA’s stock is trading at $173.60 per share, following a stock split that adjusted its price while increasing liquidity. Despite broader market volatility, NVIDIA remains a key player driving the AI revolution and is closely watched by investors and analysts. Its valuation continues to be shaped by demand for AI chips, innovation in GPU architecture, and its ability to maintain technological leadership amid growing global competition. NVIDIA stands at the intersection of multiple megatrends, making it a critical stock in both the technology and semiconductor sectors.

NVDA Sitting at a Crossroads. Jul 28NVDA Sitting at a Crossroads: Will Gamma or Liquidity Take Control? 🔍
Overview:
NVDA is currently consolidating below a 15-min supply zone after a clear BOS (Break of Structure) on the intraday chart. Price is compressing near a rising trendline support and forming a triangle, hinting at an explosive move early this week.
📊 Market Structure (15m + 1H):
* BOS confirmed near $175 with rejection from the supply zone.
* Currently building a higher low around $173.00–173.30, sitting on trendline support.
* Price is compressing in a tight range — breakout likely on Monday.
🔍 GEX & Options Sentiment (1H GEX Chart):
* Highest Call Resistance near $176–$178 → strong gamma wall.
* Major GEX Support: $167.74 (GEX10) and heavy PUT wall at $165 (17.99%).
* IV Rank: 8.3, IVX: 37.3 (relatively cheap options).
* Call$/Put$ Flow: Heavily biased toward Calls (9%), signaling bullish sentiment.
* GEX Sentiment: Mild Bullish → neutral into highest positive gamma.
🔄 Key Zones:
* Demand Zone: $167.7 → aligns with HVL and GEX10.
* Support Below: $165 (GEX PUT wall), then $162.5 (2nd PUT wall).
* Resistance Above: $174.72 → $176 (gamma wall) → $180.
📈 Trade Scenarios:
Bullish Play (Scalp/Swing):
* Entry: Above $174.14 reclaim (supply zone flip).
* Target 1: $176
* Target 2: $178 → $180 (gamma squeeze zone).
* Stop-Loss: Below $172.90 or break of trendline.
* Notes: Needs a clean BOS and demand reclaim — watch volume + open interest shift.
Bearish Play (Only if support fails):
* Entry: Break and close below $172.90
* Target 1: $170
* Target 2: $167.7 → possible bounce at GEX10.
* Stop-Loss: Back above $174.00
💭 My Thoughts:
NVDA is in a coiled setup — either breaking out into a gamma squeeze above $176 or failing trendline support and testing $167–165 for liquidity. GEX suggests institutions are defending $165 while sellers may reload near $176. Favoring bullish bias unless $172.90 breaks.
🧠 Strategy Tip:
Watch for FVG fill on 1-min or 5-min chart if it retests trendline before launching. A strong reclaim of $174.14 may trap shorts and trigger fast moves toward gamma walls.
This analysis is for educational purposes only and does not constitute financial advice. Always do your own research and manage your risk before trading.

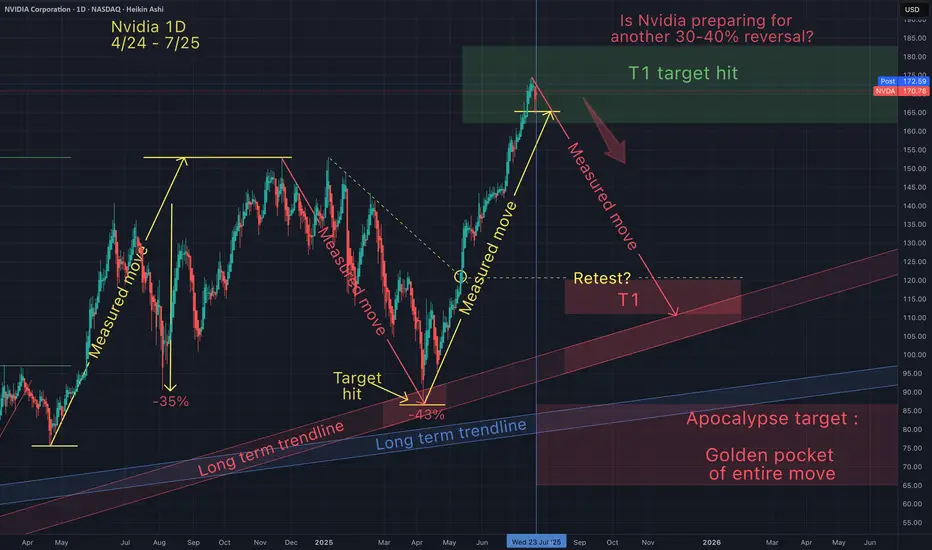
NvidiaIs Nvidia preparing for another 30-40% reversal. I hope not!
But I do want to be prepared in case we do get another dip buying opportunity.
Quantum's TSLA & NVDA Trades 8/1/25Simply breaking down what I look at going into the trading day. Premarket watchlist was short but nailed TSLA short for 150% and could have made double that on TSLA and NVDA longs. Due to hitting my daily goals I had to walk away to avoid overtrading but what an amazing day.

NVDA: 177.87Bullish Entries: 174.00/178.50 Stop 177.00 Target 182.00–184.00
Bearish Entries: 178.50/176.00 Stop 177.00 Target 172.00................Note if you find it somewhat confusing, here is the clarification 178.50 possible bullish reach zone wait for confirmation. 174.00 possible rebound zone or rejection of the bearish entry wait for confirmation for the bearish entry.

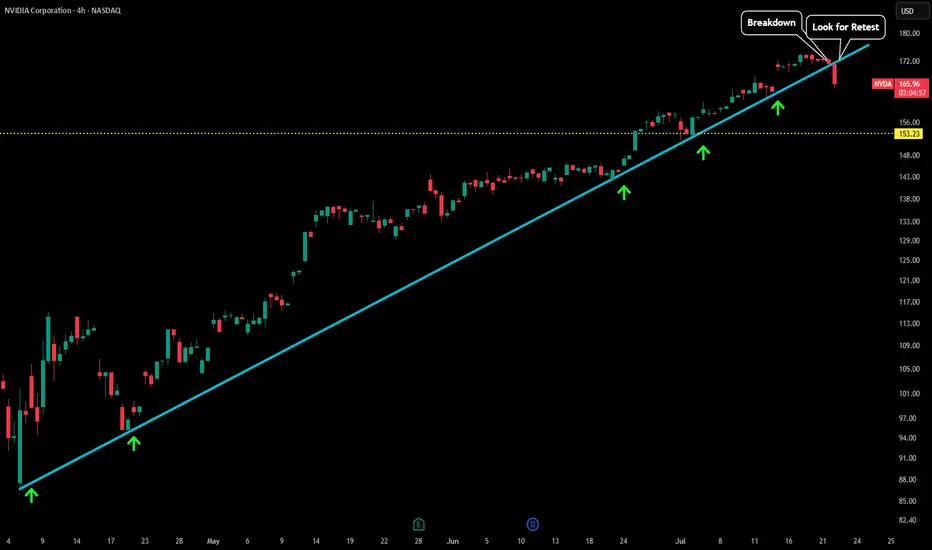
NVDA - LTF Breakdown This is an update to our last post:
After finding support upon this trendline for so many test we are now seeing the first signs of weakness. As soon as price fell below our trendline we saw a very sharp decline in price.
Now that trendline could act as a new level of resistance. Any test back to the upside could be a test of blue trendline as resistance + test of last high (which could create some sort of double top). Will update this post when more developments occur.
NVDA stocks Buy Trade with Take Profit - Stocks SPOT ACCOUNTStocks SPOT ACCOUNT:
NASDAQ:NVDA stocks my buy trade with take profit.
This is my SPOT Accounts for Stocks Portfolio.
Trade shows my Buying and Take Profit Level.
Spot account doesn't need SL because its stocks buying account.

$NVDA filled the gap. NASDAQ:NVDA filled the gap on the downside. A lot of bearish flow came in yesterday. But today the flow was bullish early.
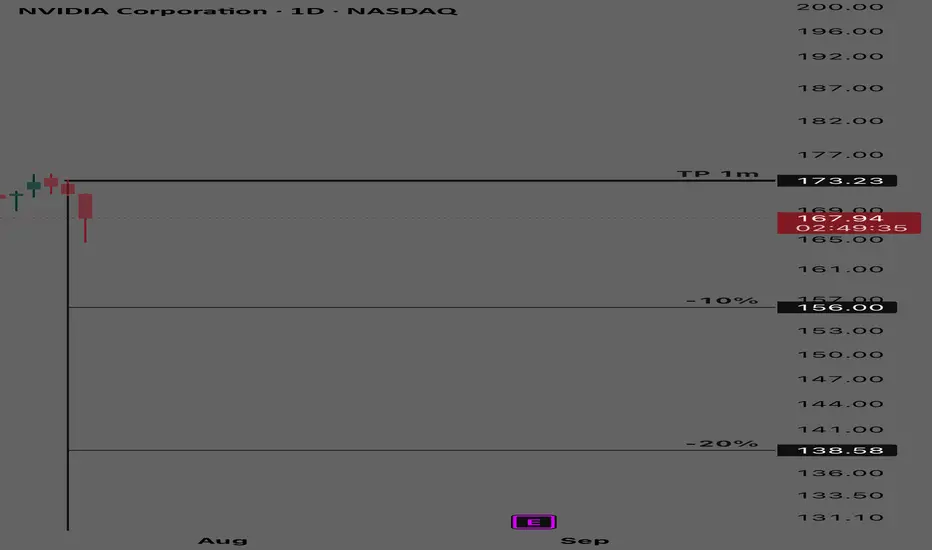
NVIDIA - Short Term Buy CycleNvidia
Short term buy cycle
TP at 173.23
% bubble ratio
Today NVIDIA entered into a short term buy cycle (negative bubble) with fair value at 173.23
Spot trading plan:
Start to buy at (-10% bubble ratio) and below
TP at 173
Elliott Wave Sequence In NVDA Suggests Rally From SupportNvidia (NVDA) continues rally to new all-time highs from April-2025 low and reinforcing a robust bullish outlook. In daily, it ended 7 swings pullback at 86.62 low in 4.07.2025 low started from 1.07.2025 high. Above April-2025 low, it confirmed higher high bullish sequence & pullback in 3, 7 or 11 swings should remain supported. Since April-2025 low, it favors rally in (3) of ((1)), while placed (1) at 115.44 high & (2) at 95.04 low in 4.21.2025. Above there, it placed 1 of (3) at 143.84 high, 2 as shallow connector at 132.93 low & 3 at 174.53 high. Wave (3) already extend beyond 2.0 Fibonacci extension of (1) & yet can see more upside. Within 1 of (3), it ended at ((i)) at 111.92 high, ((ii)) at 104.08 low, ((iii)) at 137.40 high, ((iv)) at 127.80 low & ((v)) at 143.84 high. Above 2 low, it placed ((i)) of 3 at 144 high, ((ii)) at 137.88 low, ((iii)) at 159.42 high, ((iv)) at 151.10 low & ((v)) at 174.53 high as 3 of (3).
It already reached the minimum area of 170.04 as inverse extension of connector. But it can see more upside as daily move showing highest momentum from April-2025 low. In 1-hour, above ((iv)) low, it placed (i) of ((v)) at 167.89 high in 5 swings, (ii) at 162.02 low, (iii) at 172.87 high, (iv) at 168.90 low & (v) of ((v)) at 174.53 high ended as 3. Currently, it favors pullback in 4 targeting into 170.13 - 168.11 area before rally in 5 or at least 3 swing bounce. Within 4, it ended ((a)) at 171.26 low, ((b)) at 173.38 high & favors lower in ((c)) of 4. It should find support in extreme area soon to turn higher for two more highs to finish ((1)). The next move in 5 of (3) can extend towards 175.9 or higher, while pullback stays above 168.11 low. The next two highs expect to come with momentum divergence to finish cycle from April-2025 low. Later it should see bigger pullback against April-2025 low in 3, 7 or 11 swings. But if it extends higher & erase momentum divergence, then it can see more upside.
Nvidia Hits New Highs, But Is the Rally Losing Steam?NVIDIA (NVDA) just keeps climbing in 2025! It's been an incredible run, fueled by insatiable demand for AI technology and a wave of investor optimism. The stock has rocketed to fresh highs, pushing its P/E ratio above 54. That's way higher than what we typically see in the industry, making many wonder if it's getting a bit too pricey.
Now, looking at the charts, NVDA was actually caught in a rising wedge pattern. Think of it like a funnel narrowing at the top – it often hints that a stock might be ready for a pullback. Last week, it seemed to break out of the top of that wedge, which usually signals more good times ahead. But here's the kicker: this breakout happened on weakening momentum. Both the RSI (a measure of how fast prices are changing) and trading volume were telling a different story, showing a divergence that suggests the underlying buying power might be fading.
So, despite this impressive climb, these technical signals are whispering a word of caution. While the overall uptrend is still intact, that fading strength behind the move could mean we're heading for some consolidation or even a short-term pullback. Investors might want to keep a close eye on things and wait for clearer signs before jumping in at these elevated levels.
(Disclaimer : This is not financial advice. Always do your own research)

Rare Buying OpportunityBig players are quietly accumulating NASDAQ:NVDA — time to join in.
NASDAQ:NVDA isn’t just a stock — it’s the future of AI.
This pullback? A gift in disguise. #BuyTheDip
Expect to take profits very soon.

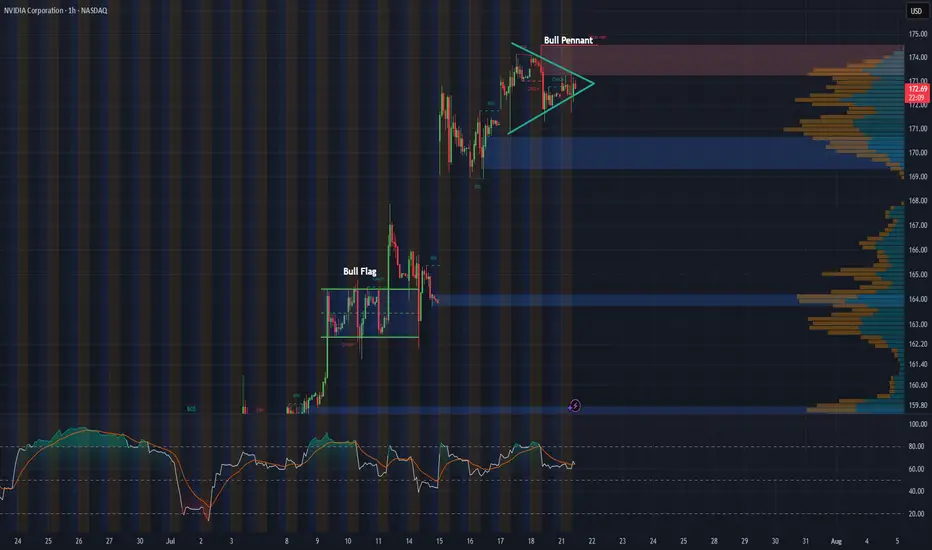
NVDA 1-Hour Chart UpdateHey everyone, just wanted to share a quick update on NVDA’s 1-hour chart. Following last week’s bull flag breakout, the stock appears to be consolidating into what looks like a solid bull pennant formation.
With major tech earnings on the horizon and the recent approval to sell H20 chips to China, this pattern could be setting the stage for another breakout. Will NVDA continue its impressive rally, or is this just a breather before the next move?
$NVDA WEEKLY TRADE IDEA – JULY 21, 2025
💥 NASDAQ:NVDA WEEKLY TRADE IDEA – JULY 21, 2025 💥
🔥 Bullish Options Flow + Weekly RSI Strength = Controlled Momentum Play
⸻
📊 Trade Details
🔹 Type: Long Call
🎯 Strike: $180.00
📆 Expiry: July 25, 2025 (4DTE)
💰 Entry: $0.51
🎯 Target: $1.02 (💯% Gain)
🛑 Stop: $0.20 (~40% Risk)
📈 Confidence: 65%
🕰️ Timing: Monday Open
📦 Size: 1 Contract (Adjust based on risk tolerance)
⸻
📈 Why This Trade?
✅ Call/Put Ratio = 1.48 → Bullish bias confirmed
📈 Weekly RSI = 77.0 → Strong momentum
🔻 Daily RSI = 80.8 (falling) → Short-term pullback risk
📉 Volume = flat (1.0x) → Weak confirmation = tighter risk mgmt
🧠 Strike Clustering: $177.50 & $180 = strong OI zones
🌬️ VIX = 16.7 → Favorable for long premium plays
⸻
⚠️ Risks & Strategy Notes
❗ Daily RSI = caution: short-term exhaustion possible
📉 Weak volume = lack of institutional chase
⏳ Exit before Friday – avoid IV crush and gamma slam
🔐 Set alerts at $178.75 and $179.80 – pre-breakout signals
⸻
🎯 Plan:
• Enter Monday open
• Scale partials if price hits +30–50%
• Full exit by Thursday unless price is breaking through $180 early with strong volume
⸻
🏁 Quick Verdict:
This is a momentum continuation setup, not a fresh breakout.
Play the trend, respect RSI signals, and cut fast if flow dries up.
NASDAQ:NVDA 180C — Risk $0.20 to Target $1.02
Let the call ride… just don’t overstay.
⸻
#NVDA #OptionsTrading #CallOption #WeeklyPlay #MomentumTrade #FlowBasedSetup #TradingViewIdeas #GammaPlay #BullishBias #NVIDIA

Is it finally time for a rally?Looking at NVIDIA (NVDA) on the weekly chart over the past two years, a significant gap up becomes apparent around April, which persisted for much of the year. Considering the recent news and the stock's pullbacks lately, this may be the moment for NVDA to resume its upward grind. The coming weeks will reveal its direction.
Additionally, it's worth noting the formation of a massive bull pennant on the weekly chart. If history repeats itself and this pattern holds, the next 2 to 6 weeks could prove to be a thrilling period for NVDA.

$NVDA Tradespoon – Long Entry $172.41Tradespoon model generated long signal for NASDAQ:NVDA . Predicted range: $172.41–$175.21. Trend: +0.65%. NASDAQ:NVDA

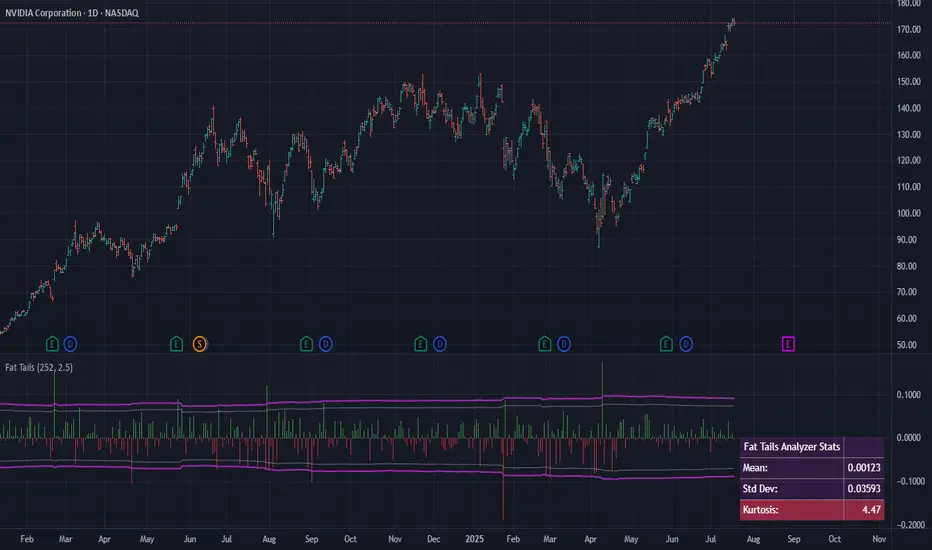
Fat Tails: Why Mean Reversion is a Rarity in Financial MarketsIn financial markets, volatility is a measure of how much asset prices change over time. Traditionally, finance assumes that asset returns fit neatly into a "bell-shaped" normal distribution curve. This implies that prices usually stay close to their average, and extreme surges or drops (beyond three standard deviations) are very rare, with approximately a 0.3% probability. However, reality consistently refutes these expectations, showing that powerful fluctuations occur much more frequently in markets. This is the phenomenon of "fat tails".
What are "Fat Tails"?
"Fat tails" occur when the probability of large price changes (up or down) is significantly higher than predicted by a normal distribution. Instead of a neat "bell-shaped" curve, we see distributions with "thick tails," like Lévy, Pareto, or Cauchy distributions. Such distributions are characterized by "excess kurtosis" (kurtosis > 3). Kurtosis is a statistical measure that shows the "peakedness" of a distribution and the "thickness of its tails." If kurtosis > 3, the tails are "heavier" than those of a normal distribution, and the peak is often higher—meaning that small deviations from the mean also occur more frequently, but extreme events are not as rare as they seem. These distributions better describe how markets behave, especially volatile ones like cryptocurrencies, where extreme movements happen 5-10 times more frequently than normal distribution models would predict.
For example, in October 1987 (Black Monday), the Dow Jones index plummeted by 22% in a single day—an event that a normal distribution would estimate as practically impossible. In 2020, WTI crude oil prices turned negative (–$40 per barrel), which also doesn't fit standard models. And Bitcoin, throughout its history, has repeatedly shown daily movements of ±20%, which is 50–100 times more frequent than a Gaussian distribution would predict.
Imagine two graphs:
Gaussian Bell Curve (Normal Distribution): Most events fall within ±3σ, and extremes are almost imperceptible.
Fat-Tailed Distribution (e.g., Pareto): The "tails" are thick, and rare events (like crises) stand out like icebergs.
These cases illustrate why classical risk models like VaR often fail. Let's explore how science attempts to address this problem.
What Does This Mean for Risk?
"Fat tails" change the rules of the game for risk management. Nassim Taleb, a prominent voice on this topic, argues that they invalidate conventional methods of financial analysis. Standard estimates of the mean, variance, and typical outliers of financial returns become unreliable. Models like VaR (Value at Risk), which rely on a normal distribution, often underestimate how badly things can go wrong. They are simply unprepared for "black swans"—rare but devastating events that can crash the market. As Taleb stated, "ruin is more likely to come from a single extreme event than from a series of bad episodes".
"Tail risk" is when an asset or portfolio experiences a significant change in value (more than three standard deviations from its current price) due to an unusual and unexpected event. Such events not only impact prices but can also trigger panic, liquidity issues, and spill over into other markets.
Although "fat tails" seem obvious, some economists (e.g., proponents of the efficient market hypothesis) argue that extreme events are merely rare but explainable deviations. They contend that if all factors (geopolitics, liquidity changes) are properly accounted for, the distribution isn't as "heavy-tailed" as it appears. However, the crises of 2008 and 2020 demonstrated that even the most sophisticated models often underestimate tail risk.
How Does Science Address "Fat Tails"?
To grapple with these tails, researchers have developed several approaches:
Extreme Value Theory (EVT): This method focuses specifically on the "tails" of the distribution to better predict extreme events. EVT helps to more accurately estimate risks and VaR, especially when a normal distribution clearly doesn't apply, and data more closely resembles Fréchet or Pareto distributions.
Jump-Diffusion Models: These models explicitly incorporate sudden, discontinuous price changes, or "jumps," in addition to continuous diffusion movements. Robert Merton, as early as 1976, proposed combining smooth price movements with Poisson jumps to better describe the market. Jumps are interpreted as "abnormal" price variations caused by important news or systemic shocks.
Intraday Data Analysis: Barndorff-Nielsen and Shephard (2004) developed a method to decompose total price variation into a continuous component and a jump component using high-frequency data. This helps to more accurately forecast how much the market can fluctuate.
GARCH Models: These models capture "volatility clustering"—the tendency for periods of high volatility to be followed by more high volatility, and periods of calm by more calm.
But if "fat tails" are so prevalent, why do many still believe in "mean reversion"? Here's the catch...
Why Mean Reversion Doesn't Work
The idea of "mean reversion" is that asset prices or returns will eventually revert to their long-term average. It's popular in finance, but with "fat tails," it's not so simple:
Unstable Mean: In markets with "fat tails," the "mean" itself is constantly shifting. If the average value is unstable, then talking about reverting to it becomes less predictable and meaningful. Moreover, in such distributions, the sample mean often doesn't align with the theoretical mean.
Extreme Events Dominate: A single powerful fluctuation can turn everything upside down. Instead of "returning to normal," the market can enter a new regime of high volatility for an extended period.
Jumps Are Not Just Noise: Significant price changes due to news or shocks are not temporary outliers that can be easily smoothed out. They represent serious risks that cannot simply be waited out.
Volatility Clustering: Markets tend to "get stuck" in periods of high or low fluctuations. After a strong move, the market may not calm down but continue to fluctuate, which breaks the idea of mean reversion. Interestingly, "fat tails" arise not only from fundamental reasons but also from irrational crowd behavior. When the market falls, investors massively sell assets, exacerbating the crisis (a positive feedback effect). This explains why tails are "heavier" in cryptocurrencies—there are more speculators and fewer institutional players stabilizing the market.
Conclusion
Mean reversion works only in "calm" times when the market behaves predictably. But in reality, "fat tails" and powerful fluctuations are not rare, but a part of financial market life. To cope with this unpredictability, more sophisticated models and risk approaches are needed. Understanding "fat tails" is key to managing risks in the chaotic financial world.
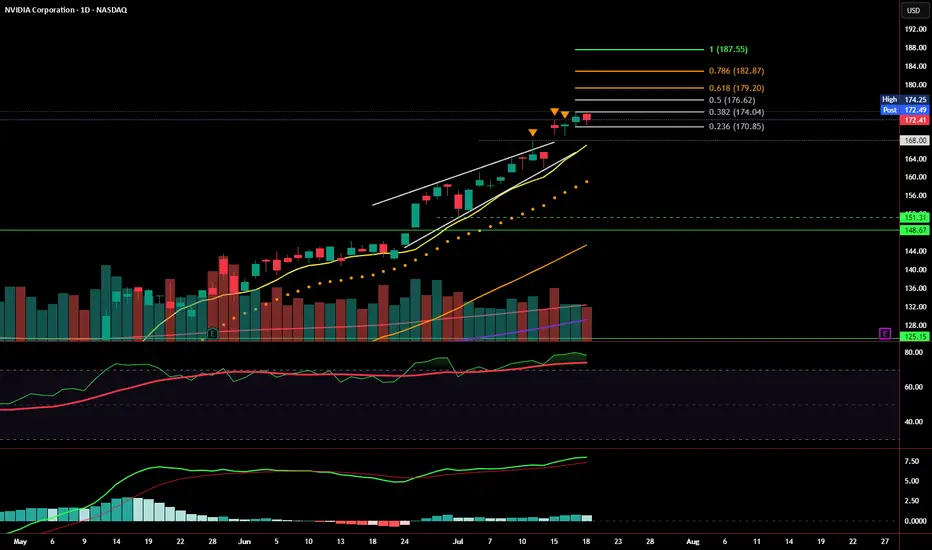
Weekly Close: Still Bullish, But Momentum Is SlowingNVDA closed the week at $172.41, just under short-term resistance and holding well above the prior rising wedge structure. Price action remains technically bullish, with a healthy consolidation forming just below the 0.382 Fibonacci retracement at $174.04.
That said, momentum is beginning to cool, and the next few sessions will be key.
📊 Current Read: Mildly Bullish
Price is holding above key support levels: 9 EMA, $170.85, and prior wedge resistance
No breakdowns — structure remains intact
However, volume is fading, and MACD is flattening, suggesting possible buyer fatigue
RSI remains elevated, not yet signaling reversal, but approaching caution territory
A confirmed breakout above $174.25 sets the stage for Fibonacci targets at:
🔸 $176.62, $179.20, $182.87, and $187.55
A close below $170.85 , and especially $168, would invalidate the current bullish structure and shift bias to bearish — targeting the $151.31–148.67 support zone.
Summary:
📈 Bias: Bullish - but cautious.
Price is consolidating near highs with no signs of breakdown yet. Continuation likely if bulls step in early next week.
NVDA HAGIA SOPHIA!The Hagia Sophia pattern has now fully formed; it just needs the crack! and the Hook!
No matter what your vague hunches and feelings are about AI, the charts will always win.
You can't "buy the dip" unless you know when to "Sell the Rip"!
If you can't see this resistance area, I don't know what to tell you.
Everyone is bullish at the top of a bubbliotious market without exception!
Click boost, Like, Subscribe! Let's get to 5,000 followers. ))
Potential NVIDIA Pullback: Watch These Key SupportsWe might witness a correction on one of the strongest stocks – NVIDIA
The level 177 is a very critical support.
Followed by the level 188 as another key level.
Correction targets are clearly illustrated on the chart in front of you.
NVIDIA: Stay heavy on positionsNVDA position size is adjusted in line with US market signals for underweight or overweight allocations. During panic phases, 2x leverage ETFs are on the table
Stay heavy on positions.
