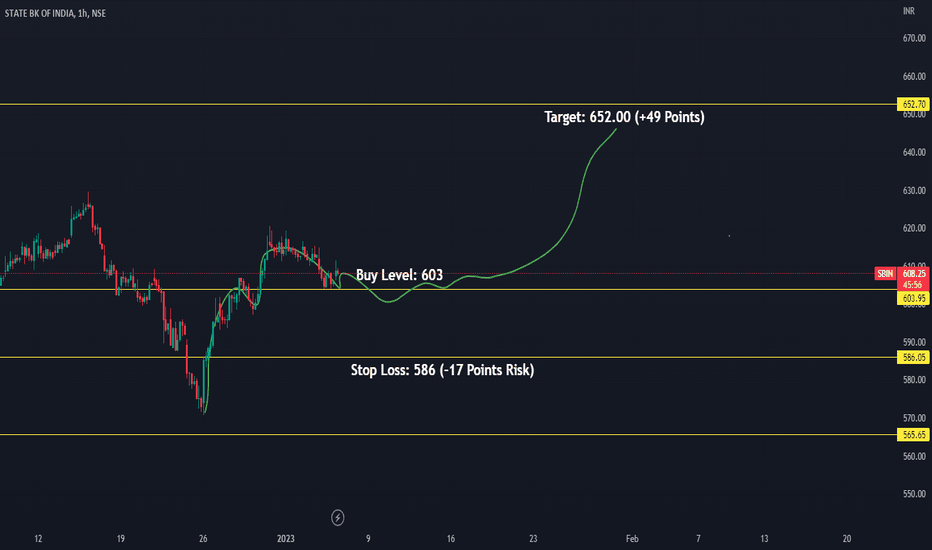
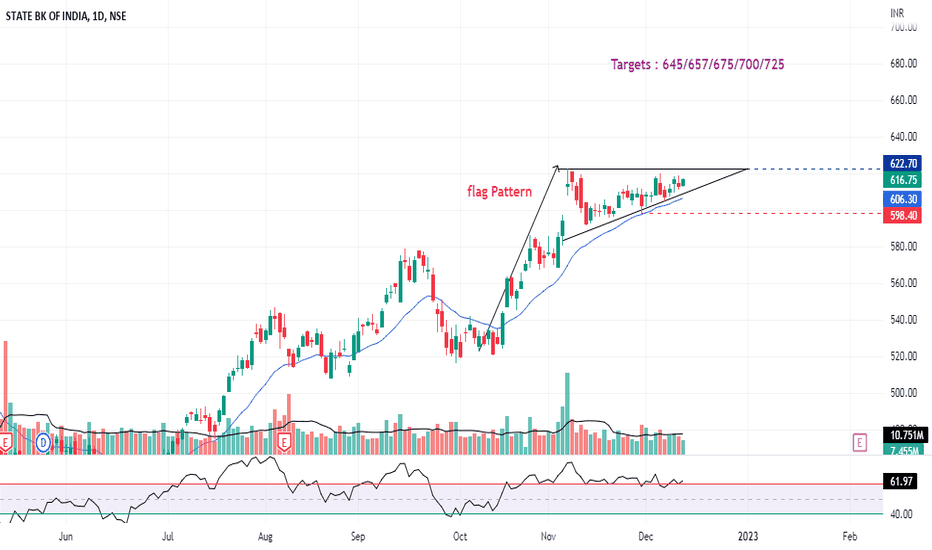
SBIN IN 1D TFSBIN broke a strong resistance and ready to give a nice up move. You can Set your own targets according to your Risk Management.by Saahhhil4
SBINALL TARGETS HAS BEEN ACHIVED. It had given a BO, it was low risk high reword setup.Longby Alzubair151
Chart of the week. SBI Best of our government bank, SBI has finally given breakout out after 10 months of consolidation. Since last November the stock was taking resistance around 540. This week, however, it has managed to give a weekly closing above 540. SBI is a great Techno-Funda pick and each investor should have this stock in their portfolio. Targets as per Fibonachi are very aggressive so one should keep a deep SL and hold this share for long term view. CMP - 553 W Target - 620, 741, 862, 940 W SL - 515 W View - Medium to long term.Longby AbNamjoshi0
STATE BANK OF INDIA...BuyThis has gone into new territory...and loooks bullish...should go up...Longby JUDEBOY119
STATE BANK OF INDIA #SBIN LONG VIEWMy analysis for NSE:SBIN If 15min candle sustain above. My target would be 546 & Stop Loss will 535 only. Note: My personal view, only for learners.Longby thetradeterminal110
SBIN - TRADE PLANCheck out the trade plan for SBIN today based on the technical analysis. Hope this analysis is useful, make sure to hit the thumbs and also follow my tradingview profile for future updates. Thank you! SBIN has Revisited the resistance and is now in consolidation under this resistance and support zone.by traderchamp_19
STATE BANK OF INDIA Long for 546 #SBINNSE:SBIN If 15 min candle close above 538.50 then my target would be 546. SL will be 534 Only. This is my personal view. Only for learnersLongby thetradeterminal112
Buy Long-SBIN at 531 for target of 623,SL-524,Exp.returns-17.32%NSE:SBIN Up flag pattern break out with high volume, Timeframe-16 daysLongby tradewithvijay115
SBI Stock Trade Setup Idea for 29 August, 2022SBIN looks bearish in the daily chart. SL: 529 Target: 500(a round level) Rish:Reward: 4 The next support level is 490. Shortby GenkeiFutura111
SBI DAY CHART breakout or fakeoutSbin day chart traying to break pattern What do you thik guys breakout or fakeout Comment you thoughtsLongby hedamayur0
#SBINSBIN cmp 528 Buy above 530 sl below 507 Target 550++ SBI coming out of range.. Good buy at CMP for swing tradersLongby wowoptiontrade0
Bearish in SBIBearish in SBI AS PER SECIFIED PRICES IN CHART. There is a possible bearish move HEAD. The movement is fast and so stop loss should be followed strictly.Shortby AFZALKHAN143Updated 0
SBIN Long on dips..SBIN on good setup with long as theme on dips....all in chart check your risk and play it right. Longby dsureshUpdated 110
SBI Daily Chart - Evening Star Pattern with high selling volumesDear traders, I have identified chart levels based on my analysis, major support and resistance levels. Please note that I am not a SEBI registered member. Information shared for educational purpose. Please do take trade based on your own analysis and risk-taking abilities. Never ever worked with fixed mindset. Any news/result data may change the direction of the trend instantly. Focus on learning so you can take correct/better decision based on your analytical skills. PLEASE NOTE THAT NO ONE CAN BE 100% CORRECT. OVERALL, WE SHOULD CONTINUE TO LEARN & BE ABLE TO CLOSE IN PROFIT EVEN IF WE ARE 50% CORRECT WITH RISK REWARD RATIO 1:2 Evening Star Pattern near 52 W high- Reversal Pattern. Shall we expect profit booking after decent rally in SBI?by manishmgupta0
SBI fly or fallThe stock is trading near resistance area Immediate resistance is placed at 545 Breaking above the resistance will give a breakout and next level to watch will be 600 However trading below 520 will trigger some selling pressure and 477 level can not be ruled out.by nmcapital445
SBIN sell for intraday tradingSBIN sell for intraday trading if stock and BANKNIFTY was also weak then we will enter in trade.........Shortby Mitesh_Patel_65082
SBINMade very decent bottom at 430 levels. Divergence in 2 TFs - Hrly N Daily. Must have picked calls of 450/460 at 20June with SL 425/420 then and keep TSL later on. or hedged with 400PE. Tailwind of BNF. by sundeep20212
SBIN - DAILY TIME FRAMEThe Structure looks good to us, waiting for the this to correct and then give us these opportunities as shown on this instrument (chart). Note: its my view only and its for educational purpose only. only who has got knowledge in this strategy will understand what to be done on this setup. its purely based on my technical analysis only (strategies). we don't focus on the short term moves, we look for only for Bullish or Bearish Impulsive moves on the setups after a good price action is formed as per the strategy. we never get into corrective moves. because it will test our patience and also it will be a bullish or a bearish trap. we do not get into bullish or bearish traps. we anticipate and get into only big bullish or bearish moves (Impulsive moves). Just ride the bullish or bearish impulsive move. buy low and sell high concept. buy at cheaper price and sell at expensive price. Keep it simple, keep it Unique. please keep your comments useful & respectful. Thanks for your support....Longby TradelikemeeUpdated 0
long position on sbiChart of Sbi is showing a potential upward movement backed by the cup and handle.Longby rnath00984
SBIN starting for an UPTREND DIRECTION hey guys , SBIN stock was moving in a DOWNTREND. this stock was following a pattern called - TRIANGLE PATTERN but now , this stock has CROSSED it's RESISTANCE . this stock has crossed it's resistance before 5-6 days and now this ato k has retested, and we can see a great GREEN CANDLES ALSO , the 20 DAY EMA has crossed the 50 DAY EMA . THEREFORE, i think that you can buy this stock and i have marked the RR RATIO , TARGET AND SL for y'all . BUT FIRST CONSIDER THE GLOBAL SITUATION 1. INFLATION 2. WAR 3. RISING BANK RATES AFTERWARDS YOU CAN BUY THIS STOCK AND EARN GIGH RETURNS SBIN - STATE BANK OF INDIA' 😀😀Longby TRADERS_AREA2
SBI BuyGood triangle breakout..along with Nifty and Bank Nifty augurs well for this stoc so buyLongby JUDEBOY1
tools of price action There are lots of ways to trade the market but the only indicator that will help you in all types of market is Price action first tool is horizontal lines go to different timeframes based on your trading time if you do intraday trading go to 1hour and 15 minute for swing trading go higher time frame and draw a horizontal line on important levels where market took support or resistance how it works is you buy at support and sell at resistance because it has a higher chances of reversal than breakout second tool is trend line make sure that your trendline touch no less than three point and that is a valid trendline with the help of trend line you can trade high and low of the stock you're trading although price action and chart pattern technical analysis will help you find a trade and give you entry points none the less it is not gonna help you with the psychological issues you have and you will become a profitable trade unless you get your psychology of successful profitable trader poor grammar by mehandijafriboyandyoukick0