SID trade ideas

SBI ABC setup is suggesting a sharp up moveThe stock is following wave ABC pattern.
As long as recent low holds we can see a sharp up move.
Let it pull back and do retracement
then it will be a confirm reversal for 550.


SBI | Longterm and Short term Viewbuy at 518
SUP levels mentioned in the chart
fundamentally strong
currently reached global maxima

Double Top (Premature)Spotted Double top structure(Premature) in #SBIN
Wait for neckline breakdown...
#StocksToTrade #StocksInFocus #StockToWatch #StockMarketindia
#breakdownstocks #StockMarket

BULLISH AT 486.9 , TARGET 492 , STOP LOSS 484I see an opportunity and momentum , with stop loss and tagret. The flow is bullish as per my workings , but a sudden sharp move may impact.

SBINHello and welcome to this analysis on STATE BANK OF INDIA
On FEB 15, it showed a very strong reversal after 5 days of steady decline from 550 to sub 500.
Currently on the hourly time frame it is completing a bullish flag and pole pattern suggesting upside levels of 535-540 as long as it does not break below 510.
Good Risk Reward set up here

SBIN | Good Sell Opportunity. Go Short!If you find this technical analysis useful, please like & share our ideas with the community.
What do you think is more likely to happen? Please share your thoughts in comment section. And also give a thumbs up if you find this idea helpful. Any feedback & suggestions would help in further improving the analysis.
Good Luck!
Disclaimer!
This post does not provide financial advice. It is for educational purposes only! You can use the information from the post to make your own trading plan for the market. But you must do your own research and use it as the priority. Trading is risky, and it is not suitable for everyone. Only you can be responsible for your trading.

option buyingput option buying banknifty 38200pe 17.2.222
frend you can use my stratgy for option buying with 110% precent surity

SBI , Bullish at 507 , 508 , Target510 , 512, 516, stop loss 505SBI weakened at 506 , but maintained momentum at 508 , if holds on it can cross 510 ,512 or even 516 today. Currently at 508
Stop loss 505.

SBIN - 1DSBI came up with very good numbers over the weekend. if the stock gaps down and bounces from 500-510 level this proposal is a high probability and can go up to 570-580 before reversing for the C wave correction. if this plays out then it will be bear trap followed by bull trap.
This chart is for educational purpose and not a trading idea.

SBI ready for pause SBI Weekly: PSUBank is a crowded sector now. It is always better to enter much before others do to maximise profits and exit when there is sign of lingering. Stay cautious around 550 level as -Ve divergence is forming.

#SBIN SHORTIt gives resistance at 544 and bearish engulfing also formed so we have to short there and it goes upto 500 level


SBI stock AnalysisThe stock is in ABC correction, which started the C wave and there is DOUBLE TOP with Bearish Divergence in MACD, it may correct till 1.68% Fibo levels which will be around 397 levels ..in coming days ..Don't take any long trades ..Do consult your Advisor before taking any trade..

SBINVery strong stock
Out parforme banchmark index and sectorel index.
Successfully break out.
For swing trading.

#SBIN LONGShin share goes to 550 as per our price action .the share may go bullish in very short term period.

SBIN chart for TradeThis chart will help to Trade easily in. if the market is negative or positive follow correct trend and tarde.

SBIN 15 MIN INTRADAY SETUPMorning star formation on trendline which is coming from a higher timeframe. Go long after closing above the mentioned levels & take the target. it may give you in one single day or within two trading session.

SBI trading setupOn 19/01/2022 we have seen strong bounce back from day's low.
On daily chart there is bullish engulfing pattern.
Buy above 520
Sl 500
Target 540, 560.

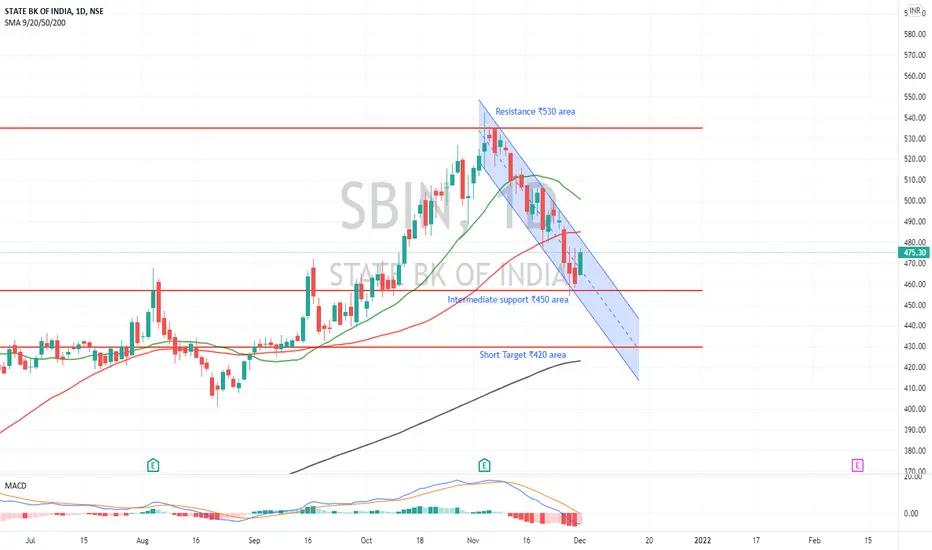
Short $SBIN CMP ₹475.30Short $SBIN CMP ₹475.30. Falling channel pattern. Stock price recently broke 50 SMA with volume. It may retest 50 SMA but MACD is showing no signs of positive volume so it may not be successful. Lowers lows on day chart. Intermediate support ₹450 area. Short term target is 200 SMA which is ₹420 area.
SBIN ANALYSIS - 11-JAN-2022 | Shall we go long in SBIN ???Hi Guys
Im bullish on SBIN, My target is 524.00
Reason for Buy
1. Trend line Breakout
2. Closed above Resistance level
Thank you

SBI Big TargetStock Is Consolidated from long time at this level but now time to start upside from this level.
Expecting target Above 500
