TSLA - $350 Magnet Update to my previous post, looking for for a nice technical bounce in March... would not want to be short here
Chart speaks for itself, with key pivot points shown. I'm out at $350 and will consider going short again there... otherwise take profits at $330 if bulls run out of steam
TL0 trade ideas

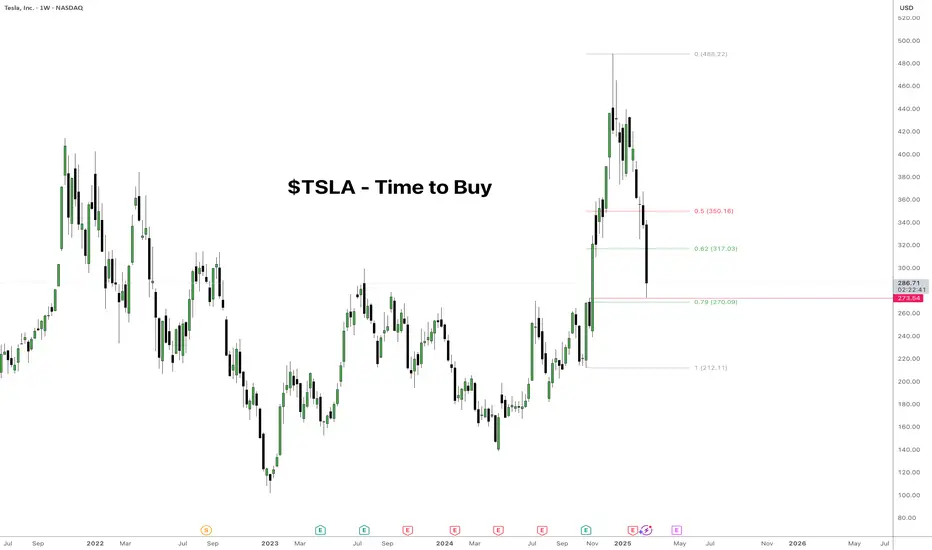
$TSLA - Time to BuyHello Friends,
We now have agreat opportunity to buy NASDAQ:TSLA after the price correction
Correction before global spaceAccording to logarithms, we follow the global cycle of 5 waves. But now there is a correction of wave 4, the target for it is in the area of the last lows in the region of $ 105. Next, you can prepare for the 5th wave, where the goals are above > $ 2000 on the horizon of 2-4 years.

Long Tesla (day traders only, investors stay away)
The chart speaks on its own behalf, when it gets to the top yellow line, you sell it. Follow me for more recipes

Telsa - Buy Cycle Tesla
Spot
Buy cycle
Tp@485.5
% bubble
Tesla Fair value in mid term is 485.5
it is in a negative bubble (-40% at the time i am writing)
Trading plan:
Entry 1: 388
Entry 2: 339
Entry 3: 291
Entry 4: 242
TP: 485.5

TSLA - support & resistant areas for today Feb 27, 2025Here are the key support and resistance levels for TSLA today, which may indicate where the price could reverse or consolidate. These levels might signal potential long (buy) or short (sell) positions for traders.
Calculated using mathematical models, these levels are relevant for today’s trading session and may change in the future.
If you find this helpful and want to receive these insights every morning at 9:30 AM, please support me by boosting this post and following me. Your engagement is appreciated! If this post doesn't receive more than 10 boosts, I may reconsider these daily updates. Thank you!

TSLA - TP#1 308-312TSLA dipped -40% into the support zone of the presidential election. This is monthly. I expect to rise towards #325 and a chance to TP in between without waiting.
I bought at $289.
TSLA IS A BUY at $280, add $270, bounces to $353TLA is becoming oversold here and we are at longer term support which is either $280 or $270 depending, I would start a position and be prepared to ADD on any further weakness. Fitsr target $353

TSLA Approaching a Critical Reversal Zone! Can $280 Hold? Feb.28Technical Analysis (TA) & Price Action
Tesla (TSLA) remains in a strong downtrend, trading within a well-defined falling wedge pattern. The stock is currently testing a major support zone around $280, which aligns with the highest negative NETGEX and significant PUT walls. A breakdown from this level could open the door for a steeper decline toward $250, while a bounce could lead to a sharp reversal rally.
Key observations:
* Trend Structure: TSLA is in a clear downtrend, but nearing exhaustion based on technical indicators.
* Support & Resistance:
* Major Resistance: $297-$300 (breakout confirmation level).
* Key Support: $280 → If this breaks, expect further downside toward $250.
* Breakout Target: $310 - $350 if momentum shifts.
* MACD Indicator: Showing a slight bullish divergence, which could signal an upcoming reversal.
* Stoch RSI: Oversold at 37.67, indicating potential upside pressure if buyers step in.
Options Flow & GEX Analysis
The GEX (Gamma Exposure) indicator suggests that TSLA is heavily weighted on the PUT side, with the highest negative gamma near $280. This implies that if $280 breaks, the next big support is around $250. However, if $280 holds, a short squeeze could push TSLA toward $300+ quickly.
* IVR (Implied Volatility Rank): 74, with IVx avg at 77.9%, showing high volatility expectations.
* Call Side Bias: 31.9% of options flow, indicating some bullish positioning.
* Key GEX Levels:
* PUT Wall & Key Support: $280 → A breakdown could bring $250 as the next stop.
* CALL Resistance & Upside Target: $300 → A move above this level could send TSLA toward $350+.
Trade Plan & Suggestions
📌 Bullish Reversal Setup (Preferred Play)
* Entry: Above $285 with strong volume confirmation.
* Target 1: $300
* Target 2: $310-$350 (Extended breakout target).
* Stop-loss: Below $278
📌 Bearish Breakdown Setup (Hedge Play)
* Entry: Below $278 with strong selling pressure.
* Target: $265 → $250
* Stop-loss: Above $285
Final Thoughts
TSLA is at a crucial inflection point, with $280 acting as the major battleground. If buyers defend this level, expect a short squeeze rally toward $300+. But if this level fails, the next leg down could accelerate toward $250. Volume confirmation is key before making a trade.
📢 Risk Management: Keep tight stop-losses, wait for confirmation, and be ready for volatility.
🔹 Disclaimer: This analysis is for educational purposes only and does not constitute financial advice. Always conduct your own research and manage risk accordingly before trading.

TSLA Update to price entry - $255 TSLA is giving us great info. Today's and yesterday's declines were indicative of a stock that is not yet ready to stop falling. We are not there yet, but we are getting pretty close. We may have made a small bottom that moves us to $312, and then under many scenarios makes a new low at $255 or so. That buy zone stops out near $222. Elliotwave, Murrey Math, Kumarwave.

TSLA Tesla 1week potterboxTSLA Tesla 1-week potterbox. well tesla is now sitting on the 50 percent line or cost basis $277.42 ish. Tesla should bounce here if it opens above the 50 percent line it should stay above it. It is also still above the 200 day MA. Well i geuss we will see where it goes over the next couple of weeks. Just remember folks Tesla is alot more than a car company. Happy Trading.

TSLA - Starting to DCAI think we are in a good range to start accumulating, down 41% from the top and every indicator I test out seems to be oversold. Potentially it can go lower to ~$225 - this is why I'm not throwing all my money. Definitely a company of the future.

Important Support and Resistance Zone: 252.75-268.07
Hello, traders.
If you "Follow", you can always get new information quickly.
Please click "Boost".
Have a nice day today.
-------------------------------------
(TSLA 1M chart)
The 252.75-268.07 zone is an important support and resistance zone.
If it falls below 252.75, it is likely to fall to around 173.22.
-
(1D chart)
In order to turn into an uptrend, it must rise above the M-Signal indicator on the 1D chart.
Therefore, the key is whether it can be supported and rise near the M-Signal indicator on the 1M chart.
-
Thank you for reading to the end.
I hope you have a successful trade.
--------------------------------------------------

Tesla - Elon Is Playing The Charts!Tesla ( NASDAQ:TSLA ) is perfectly respecting structure:
Click chart above to see the detailed analysis👆🏻
Two months ago Tesla perfectly retested the previous all time high resistance and closed with a massive rejection wick. This means that a correction - which is currently happening - is expected and after the bullish break and retest, we will then finally see new all time highs.
Levels to watch: $280, $400
Keep your long term vision,
Philip (BasicTrading)

Multiple charts2.28.25 a lot of the markets we talked about yesterday looked like they were going higher. this video looks at all of those markets from yesterday... and so today would have been a good day to follow yesterday's setups. Tesla went a little bit lower today but it's a setup for a long trade when you find a two-bar reversal. coffee did trade a little lower but it's at a support area that is significant so I would be looking for this to show me a two-bar reversal going higher if I wanted to go long in this trade. we took a good look at gold and silver. oil went up about $2000 or 2 points I was reluctant to tell you whether you would stay long or not.... but that's okay because we can look at the market tomorrow and see what it did and what might happen once it starts Trading later tonight after the market takes a break. just a little caveat here: in the last couple of days it's been easy to evaluate the market but generally it has not been easy to trade the markets in the past couple months in my opinion. I tell you this because markets contract and they become very difficult to make decisions regarding what direction they will move.... and you can't change that but you can avoid overtrading and recognize that there are times in the market which you can see if you teach yourself to look.... and at the very least trade less or take a break until the market becomes more clear.

TSLA Support by Trendline, 200 Day MA, and previous resistanceToday February 27th, 2025 NASDAQ:TSLA has bounced off of the 200 Day SMA, a trendline with a positive slope that had it's first touch on April 22, 2024, and a price level of significant previous resistance from September 15th, 2023. With all of these put together I anticipate that a significant reversal will occur off of this price level of around $280.
