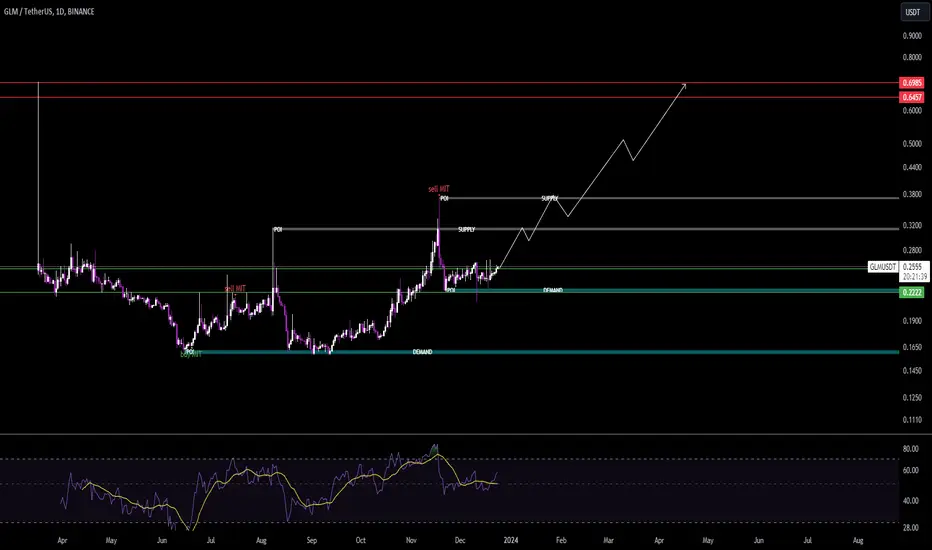
GLM After Successful Last Trade Here is The new one
GLM Coin: Short Fundamentals, Recent News, and Disclaimer
Fundamentals:
Golem (GLM): A decentralized platform for sharing computing power.
Launched: November 2016.
Market Cap: ~$xxx million (as of March 8, 2024, unable to find recent data).
Rank: #xxx on CoinGecko (unable to find recent data).
Unique Features:
Distributed computing: Enables users to rent out or purchase unused computing power.
Variety of applications: Can be used for rendering, simulations, scientific computing, and more.
Golem Token (GLM): Used to pay for computations on the network and participate in governance.
Recent News:
News unavailable: Due to limited data availability, I couldn't find recent news about Golem.
Disclaimer:
This information is for educational purposes only and should not be considered financial advice.
Cryptocurrency investments are highly volatile and carry significant risks.
Do your own research before making any investment decisions.
Additional Notes:
GLM price data is unavailable at this time.
The lack of recent news items makes it difficult to assess Golem's current development status.
It's important to be aware of the risks involved in cryptocurrency investments before making any decisions.
GLMUSDT.P trade ideas

ScalpAccording to the waves analysis we can expect that price rise again to the green zones.
This is my personal opinion and is not an offer to buy or sell, please act according to your trading plan
follow me for more ideas

Golem - GLMUSDT - Bullish *GLMUSDT - Golem - CMP - $0.40 / Positional Trade*
*Buy At Current Price $0.38 / Strict Stop Loss $0.30*
Target 1 - $0.55
Target 2 - $0.75
Target 3 - $0.95
Disclaimer: This is my view and for educational purpose only.

Golem Goes Bullish (450% Profits Potential)We looked at Golem vs Bitcoin but the Tether pair (GLMUSDT) is also looking great, for sure.
We can see a very, very strong breakout recently with the highest volume in more than a year.
The accumulation phase also lasted more than a year. When the accumulation phase is long, the bullish wave that follows tends to be super strong.
The RSI is high up and we can expect fast growth... And it is already here; the trick is to buy and hold.
Of course, make sure to develop a take profits strategy on the way up.
This not financial advice.
Market conditions can always change... With that said, the timing right now is great.
Namaste.

GLMUSDT.PGLMUSDT.P is in bearish trend.
Potentially printing LH and LL.
sellers are strongly active
Risign wedge reversal pattern also form.
We sell at CMP.

GLM Rally Mode: Your Chance to Buy and Prosper!"## GLM Coin: Short Fundamental Analysis, Recent News, and Disclaimer
**Disclaimer:** I am not a financial advisor and this is not financial advice. Please do your own research before making any investment decisions.
**Fundamentals:**
* **Purpose:** GLM is the native token of the Golem Network, a decentralized supercomputer that allows users to rent out spare computing power.
* **Tokenomics:** There is a total supply of 1 billion GLM, with no maximum supply.
* **Use Cases:** GLM is used to pay for computational resources on the Golem Network. It can also be used for staking and governance.
* **Current Price:** $0.245 (as of February 20, 2024)
* **Market Cap:** $245 million (as of February 20, 2024)
* **Ranking:** #236 on CoinMarketCap
**Recent News:**
* **February 16, 2024:** Golem Network announces partnership with Render Network, a decentralized GPU rendering platform.
* **February 14, 2024:** Golem Network releases Golem v0.14.0, a major update to the network software.
* **February 9, 2024:** Golem Network announces integration with Chainlink, a decentralized oracle network.
**Overall Sentiment:**
The overall sentiment for GLM is mixed. Some analysts believe that the recent partnerships and updates are positive developments for the network, while others are concerned about the lack of a maximum supply and the current market conditions.
**Disclaimer:**
This is just a brief overview of GLM Coin. It is important to do your own research before making any investment decisions. Please consider your own risk tolerance and investment goals before investing in any cryptocurrency.
**Additional Resources:**
* Golem Network website: (golem.network)
* CoinMarketCap page: (coinmarketcap.com)
* CoinGecko page: (www.coingecko.com)
I hope this information is helpful!

5000 TO 60000Hello friends
In continuation of the challenge I defined for myself, I went looking for a cryptocurrency that has almost just started its work and the previous cycle of Bolran was not in the market. Like the previous analyzes in the demand range, i.e. the green lines, I make my purchase and wait until I reach my desired target and exit in several stages, finally I exit in complete red lines.
For sure it will up to 1.8$After its arrival, I invite you to discuss and i will explain how a goal was determined

GLMUSDT TODAY1-Apply your own risk management.
2-Daily Targets
3-Hunt the profits at any level you see convenient for you.
4-Move Your SL to protect your profits
5-Use Less 10%

GLMUSDT4-hour time form GLM analysis
The price is between the supply and demand area. According to the yellow trend line. Its support in several areas is more likely to fail in the SUPPLY ZONE, and in case of full target, we will have a profit of up to 20%. Pay attention to the green support lines.

GLM looks good for Next MoveGLM looks good for Next Move
A resistance flip breakout trade is a trading strategy used in technical analysis, typically applied to financial markets like stocks, forex, or cryptocurrencies. Here's a breakdown of the components:
1. **Resistance**: Resistance is a price level at which an asset historically struggles to move above. It represents a point where selling pressure is significant, preventing the price from rising further. Traders often use resistance levels to make trading decisions.
2. **Breakout**: A breakout occurs when the price of an asset moves above a key level of resistance. It signifies a potential shift in market sentiment and the possibility of an uptrend. Traders seek to capitalize on breakouts for potential profit opportunities.
3. **Flip**: In the context of trading, a "flip" refers to a change in the role of a support or resistance level. For instance, a resistance level that was previously preventing the price from rising may "flip" to become a support level, helping to keep the price from falling too far. This change in role can indicate a strong shift in market dynamics.
A resistance flip breakout trade, therefore, involves:
1. Identifying a resistance level on a price chart.
2. Monitoring the asset's price action as it approaches this resistance level.
3. Executing a trade if the price breaks decisively above the resistance level, signaling a potential trend reversal or continuation.
4. Additionally, traders may use the former resistance level as a new support level to manage their risk and set stop-loss orders.
This strategy is based on the idea that when a resistance level flips to become a support level, it can provide a strong foundation for a new upward trend. However, like any trading strategy, it carries risks and requires careful analysis and risk management. Traders often use technical indicators, chart patterns, and other tools to confirm potential breakouts and validate the strength of the resistance flip.

✴️ Golem Long-Term + Medium-Term Targets (128% Growth Potential)Golem (GLMUSDT) established a long-term support range with the low it hit back in May 2022. After this date, a series of attempts by bears to push prices lower all failed.
On this chart, we have 6 major attempts when the "Long-term support" was challenged, all leading to a small bounce/upwards correction.
We saw lower highs coupled with a flat bottom, a classic accumulation pattern.
Mid-September was the last attempt at support, GLMUSDT started to move up and is now gaining in bullish momentum. Right now we have 5 consecutive weeks closing green, a rare event and a strong bullish consolidation signal. After this type of behaviour, a sudden surprise move tends to develop in the same direction the consolidation is taking place. We see 5 green weeks, the next major move therefore is likely to happen up.
Long-term support has been confirmed, a challenge of resistance is set to happen next.
There can be additional growth long-term, many times higher than what is shown on this chart.
Thank you for reading.
Your support is truly appreciated.
Namaste.


GLM/USDT Next possible move? 👀 GLM Today Analysis💎 Paradisers, turn your focus to GLMUSDT. After facing resistance from a robust supply zone, it's now navigating within a demand zone, presenting intriguing possibilities.
💎 Historically, GLM has been repelled by the 0.1909 supply level on three occasions, leading to a bearish trajectory. Currently, as it operates within the demand zone, we foresee two potential outcomes.
💎 Firstly, if the price sustains its momentum within this demand zone, there's a high chance it will challenge the supply level once again. Alternatively, should the momentum wane and the price dips below the demand zone, we anticipate a descent towards a significant support level.
💎 Remember to employ prudent trading strategies and use proper stop-loss measures! Stay alert to market movements and look forward to more insight

GLMUSDT 12HBullish structure on #GLM chart.
-MACD & RSI are good.
-Double bottom.
You can see support and resistance(targets) on my chart.

✴️ Golem Early Recovery Signals (130% Potential Mapped)Here we have a mixture of strong, classic, early bullish signals, all pointing towards a recovery.
Golem (GLMUSDT)
First: We have a short-term higher low which I mentioned in several previous charts. August (higher low) vs June (low).
Second: Golem is trading above long-term support. GLMTUSDT trading above its May 2022 low as well as November and December 2022.
Third: We have rising volume as a bullish breakout starts to develop.
The latest retrace was very steep and so we are likely to see an inverse reaction, this one can go fast.
This is a "bottomed out" pair.
Low risk vs high potential for reward.
Namaste.

GLMUSDT TODAYPLZ DO NOT SELL MY SIGNALS
1-Apply your own risk management.
2-Daily and Weekly Targets
3-Hunt the profits at any level you see convenient for you.
4-BLUE Zone for entry,
5-Yellow levels are targets.
have a good day guys.

Golem (GLM) formed bullish Gartley for the next price reversalHi dear friends, hope you are well and welcome to the new trade setup of Golem (GLM) token with US Dollar pair.
Previously we caught almost 37% pump of GLM as below
On a 4-hr time frame, GLM has formed a bullish Gartley for the next price reversal.
Note: Above idea is for educational purpose only. It is advised to diversify and strictly follow the stop loss, and don't get stuck with trade.

$GLM woke up saw this, in a degen mood got a bag
targeting range high on weekly been dormant for a while so may keep going
elf, storj om look interesting as well
momentum play as soon as the volume comes down am out
safer to buy on flip of .2679 with a stop tad under

LOngAs per my Elliott Wave analysis, we are prepared for the third impulse wave to the upside. The third wave is usually the strongest, so you don't want to miss it.

✨Golem GLM - On fire! +2000% | Bullish flag + Huge breakout!
Golem is on fire! You really want to buy Golem right now because the bullish flag is breaking out and an ascending triangle on the GLMBTC pair also!
How can you not love the name of the coin? But you definitely will with the massive profits!
As per my Elliott Wave analysis, we are prepared for the third impulse wave to the upside. The third wave is usually the strongest, so you don't want to miss it.
The ABC correction has been completed, and we are forming a bullish flag pattern that is currently breaking out. You often find ZigZags corrections in bullish flags.
1:1 FIB extension is the next profit target (wave 3).
Look at my idea about the GLMBTC pair in the related section down below.
For more analysis, hit "Like" and "Follow"!

Golem GLM Bearish SentimentSeptember has major catalysts for the crypto market as well as for the stock market.
The Ethereum merge on September 6th, that will end on Sept 20, the inflation report on September 13 and the next FOMC meeting afterwards with the new interest rates hike.
That is reflected in the crypto space in general as a bearish outlook.
Golem GLM has a negative overall sentiment recently.
I have the following price targets:
GLM/USDT short
Entry Range: $0.21 - 0.26
Price Target 1: $0.19
Price Target 2: $0.166
Price Target 3: $0.149
Stop Loss: $0.285

Golem GLM Price Targets and Stop LossGLM/USDT
Entry Range: $0.43 - 0.46
Price Target 1: $0.49
Price Target 2: $0.53
Price Target 3: $0.59
Stop Loss: $0.39
