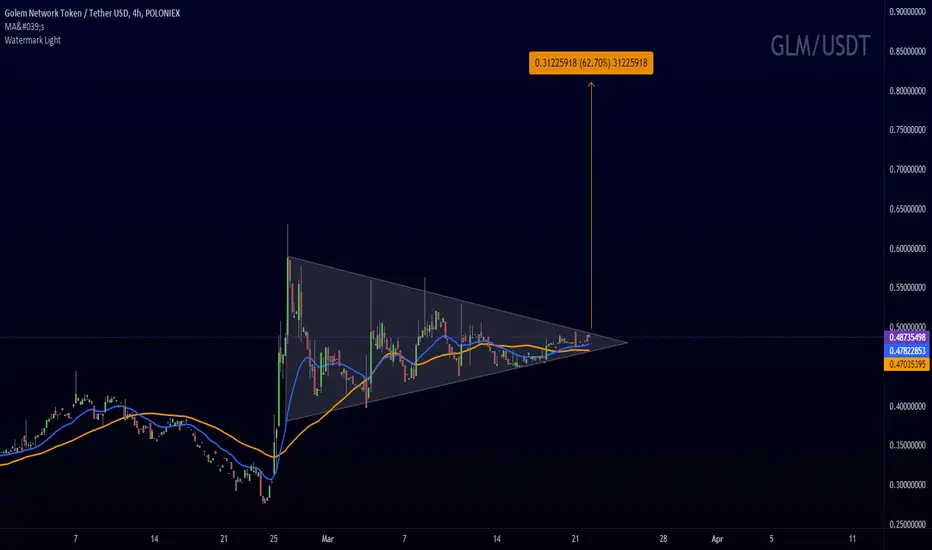
GLM looks good for Next MoveGLM looks good for Next Move
A resistance flip breakout trade is a trading strategy used in technical analysis, typically applied to financial markets like stocks, forex, or cryptocurrencies. Here's a breakdown of the components:
1. **Resistance**: Resistance is a price level at which an asset historically struggles to move above. It represents a point where selling pressure is significant, preventing the price from rising further. Traders often use resistance levels to make trading decisions.
2. **Breakout**: A breakout occurs when the price of an asset moves above a key level of resistance. It signifies a potential shift in market sentiment and the possibility of an uptrend. Traders seek to capitalize on breakouts for potential profit opportunities.
3. **Flip**: In the context of trading, a "flip" refers to a change in the role of a support or resistance level. For instance, a resistance level that was previously preventing the price from rising may "flip" to become a support level, helping to keep the price from falling too far. This change in role can indicate a strong shift in market dynamics.
A resistance flip breakout trade, therefore, involves:
1. Identifying a resistance level on a price chart.
2. Monitoring the asset's price action as it approaches this resistance level.
3. Executing a trade if the price breaks decisively above the resistance level, signaling a potential trend reversal or continuation.
4. Additionally, traders may use the former resistance level as a new support level to manage their risk and set stop-loss orders.
This strategy is based on the idea that when a resistance level flips to become a support level, it can provide a strong foundation for a new upward trend. However, like any trading strategy, it carries risks and requires careful analysis and risk management. Traders often use technical indicators, chart patterns, and other tools to confirm potential breakouts and validate the strength of the resistance flip.
GLMUSDT trade ideas

✴️ Golem Long-Term + Medium-Term Targets (128% Growth Potential)Golem (GLMUSDT) established a long-term support range with the low it hit back in May 2022. After this date, a series of attempts by bears to push prices lower all failed.
On this chart, we have 6 major attempts when the "Long-term support" was challenged, all leading to a small bounce/upwards correction.
We saw lower highs coupled with a flat bottom, a classic accumulation pattern.
Mid-September was the last attempt at support, GLMUSDT started to move up and is now gaining in bullish momentum. Right now we have 5 consecutive weeks closing green, a rare event and a strong bullish consolidation signal. After this type of behaviour, a sudden surprise move tends to develop in the same direction the consolidation is taking place. We see 5 green weeks, the next major move therefore is likely to happen up.
Long-term support has been confirmed, a challenge of resistance is set to happen next.
There can be additional growth long-term, many times higher than what is shown on this chart.
Thank you for reading.
Your support is truly appreciated.
Namaste.


GLM/USDT Next possible move? 👀 GLM Today Analysis💎 Paradisers, turn your focus to GLMUSDT. After facing resistance from a robust supply zone, it's now navigating within a demand zone, presenting intriguing possibilities.
💎 Historically, GLM has been repelled by the 0.1909 supply level on three occasions, leading to a bearish trajectory. Currently, as it operates within the demand zone, we foresee two potential outcomes.
💎 Firstly, if the price sustains its momentum within this demand zone, there's a high chance it will challenge the supply level once again. Alternatively, should the momentum wane and the price dips below the demand zone, we anticipate a descent towards a significant support level.
💎 Remember to employ prudent trading strategies and use proper stop-loss measures! Stay alert to market movements and look forward to more insight

GLMUSDT 12HBullish structure on #GLM chart.
-MACD & RSI are good.
-Double bottom.
You can see support and resistance(targets) on my chart.

✴️ Golem Early Recovery Signals (130% Potential Mapped)Here we have a mixture of strong, classic, early bullish signals, all pointing towards a recovery.
Golem (GLMUSDT)
First: We have a short-term higher low which I mentioned in several previous charts. August (higher low) vs June (low).
Second: Golem is trading above long-term support. GLMTUSDT trading above its May 2022 low as well as November and December 2022.
Third: We have rising volume as a bullish breakout starts to develop.
The latest retrace was very steep and so we are likely to see an inverse reaction, this one can go fast.
This is a "bottomed out" pair.
Low risk vs high potential for reward.
Namaste.

GLMUSDT TODAYPLZ DO NOT SELL MY SIGNALS
1-Apply your own risk management.
2-Daily and Weekly Targets
3-Hunt the profits at any level you see convenient for you.
4-BLUE Zone for entry,
5-Yellow levels are targets.
have a good day guys.

Golem (GLM) formed bullish Gartley for the next price reversalHi dear friends, hope you are well and welcome to the new trade setup of Golem (GLM) token with US Dollar pair.
Previously we caught almost 37% pump of GLM as below
On a 4-hr time frame, GLM has formed a bullish Gartley for the next price reversal.
Note: Above idea is for educational purpose only. It is advised to diversify and strictly follow the stop loss, and don't get stuck with trade.

$GLM woke up saw this, in a degen mood got a bag
targeting range high on weekly been dormant for a while so may keep going
elf, storj om look interesting as well
momentum play as soon as the volume comes down am out
safer to buy on flip of .2679 with a stop tad under

LOngAs per my Elliott Wave analysis, we are prepared for the third impulse wave to the upside. The third wave is usually the strongest, so you don't want to miss it.

✨Golem GLM - On fire! +2000% | Bullish flag + Huge breakout!
Golem is on fire! You really want to buy Golem right now because the bullish flag is breaking out and an ascending triangle on the GLMBTC pair also!
How can you not love the name of the coin? But you definitely will with the massive profits!
As per my Elliott Wave analysis, we are prepared for the third impulse wave to the upside. The third wave is usually the strongest, so you don't want to miss it.
The ABC correction has been completed, and we are forming a bullish flag pattern that is currently breaking out. You often find ZigZags corrections in bullish flags.
1:1 FIB extension is the next profit target (wave 3).
Look at my idea about the GLMBTC pair in the related section down below.
For more analysis, hit "Like" and "Follow"!

Golem GLM Bearish SentimentSeptember has major catalysts for the crypto market as well as for the stock market.
The Ethereum merge on September 6th, that will end on Sept 20, the inflation report on September 13 and the next FOMC meeting afterwards with the new interest rates hike.
That is reflected in the crypto space in general as a bearish outlook.
Golem GLM has a negative overall sentiment recently.
I have the following price targets:
GLM/USDT short
Entry Range: $0.21 - 0.26
Price Target 1: $0.19
Price Target 2: $0.166
Price Target 3: $0.149
Stop Loss: $0.285

Golem GLM Price Targets and Stop LossGLM/USDT
Entry Range: $0.43 - 0.46
Price Target 1: $0.49
Price Target 2: $0.53
Price Target 3: $0.59
Stop Loss: $0.39

GLMUSDTDISCLAIMER:
This is not financial advice! This is an opinion-based show. I am not a financial adviser. Please only invest what you can afford to lose, and we encourage you to do your own research before investing.
everyone should buy and sell according to their own strategy.
Everything you need to know is outlined in the chart and keep in mind that we are moving forward with probabilities and the analysis may be wrong so take capital management seriously.
Golem (GLM)Waiting for the trigger
Support with price: 10-15%
(Personal archive for situation review and troubleshooting, watchlist.)

Golem is another old coin looking really goodFirst of all like DCR & ATOM, GLM didn't have a huge move to the upside in the previous alt season and is consolidating really hard in BTC terms. Like ATOM its chart has been a huge sideways move. GLMUSDT is looking great because it retested its old key resistance zone and bounced very nicely. The current rally is looking very healthy and actually stronger than that of DCR and ATOM.
GLM keeps having little test pumps in BTC terms and I think that's a signal for a big pump to come. GLMBTC is where it was back in 2016-2018 and has reclaimed those ATLs.
Golem is listed on Coinbase and Binance, but doesn't have many pairs. The addition to Coinbase Pro or the addition of USDT & BUSD pairs on Binance could definitely push it higher.

GLM TO 1 USDT The Golem Network fosters a global group of creators building ambitious software solutions that will shape the technological landscape of future generations by accessing computing resources across the platform.

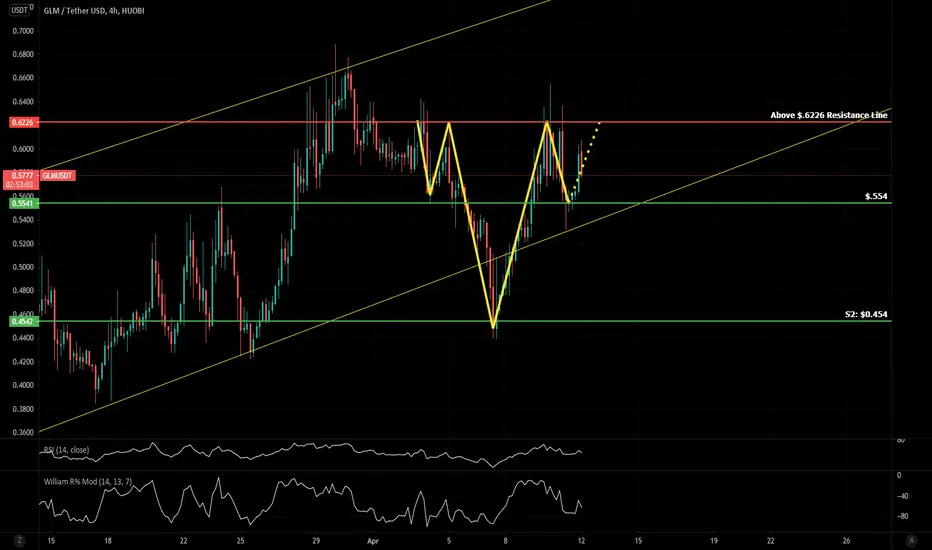
GLM - IH&S Pattern DetectedForming right shoulder of the IH&S pattern. Above neckline (red line) at $.6226 (lowest risk entry) has an implied move of $.168 and PT of $.791. Support zones are the green lines. A drop below the left shoulder support would invalidate this pattern and where your stop loss should be (a few cents under)

GLM explode and achieveFinally GLM did an amazing rally to the top of the extension and more (reaching %40 more of my signal).
I expect a retrace to the bottom of the channel seraching for more buy setup

Strong support for GLMWe can see in the graph how there is a strong support around 0.44 that works as a strong consolidation.
We can also see how it topped the historical trend line bouncing with a healthy rise.
If it falls back to the resistance of 0.44, do not panic because we will have more setup to buy for a new rise unless it breaks the resistance by moving it down.
Trade safe
If u like the idea thumbs up

GLMUSDT is Ready for a quick moveHello traders!
GLMUSD is in a perfect position to buy. It has broken all the resistance and it is ready to pick the strength.
The target is 0.7 which is 55% of the investment.

