GMT more range 💡Based on the chart, the price has been stuck in the channel for a while ✔️
we
expect to see more range for the price before more gain 💡✔️
and if
we lose the channel support, we will see brief correction to the downside ❌🧨
Please, feel free to ask your question, write it in the comments below, and I will answer.🐋
GMTUSDT.P trade ideas

GMT trade set upGMT has had a nice run. Market structure has been broken to the downside so looking for shorts at the range high aiming for range lows.
NFA DYOR

GMT - we can take Long at $3 - volume at bottom is best confirmGMT - we can take Long at $3 - volume at the bottom is best confirmation for our trade

GMT/USDT Sitting at the support? Where it will go?Hey Traders,
Our attention caught GMT/USDT. Last week GMT tried to break its ATM and for now it has stopped at $3.33 support zone.
From here we see 2 options that can happen.
Firstly - GMT will hold $3.33 zone and it will bounce to $4 to break its ATH
Secondly - Support zone at $3.33 will break and next stop would be at $2.65 from where we expect it to bounce right back up
If you like ideas provided by our team you can show us your support by liking and commenting.
Yours Sincerely,
Swallow Team
Disclamer:
We are not financial advisors. The content that we share on this website are for educational purposes and are our own personal opinions.

GMTUSDT can go lower to FIB 0.5 level
GMTUSDT can potentially break below the trend line after forming a double top. We also see that the price can't get away from the trendline which is another indication that there is no buying pressure at this level which can lead then price go lower
💎 GMTUSDT
🔵 Entry zone 3.32891 - 3.61485
🟢 TP1 2.67000
🟢 TP2 2.06000
🟢 TP3 0.90000
🔴 SL 3.90000
Good Luck 🎲

#TOBTC #LQR GMT > Ressistance Zone about 3.5687 is to much important , breaking this level will lead the price up otherwise we going to re-test support again

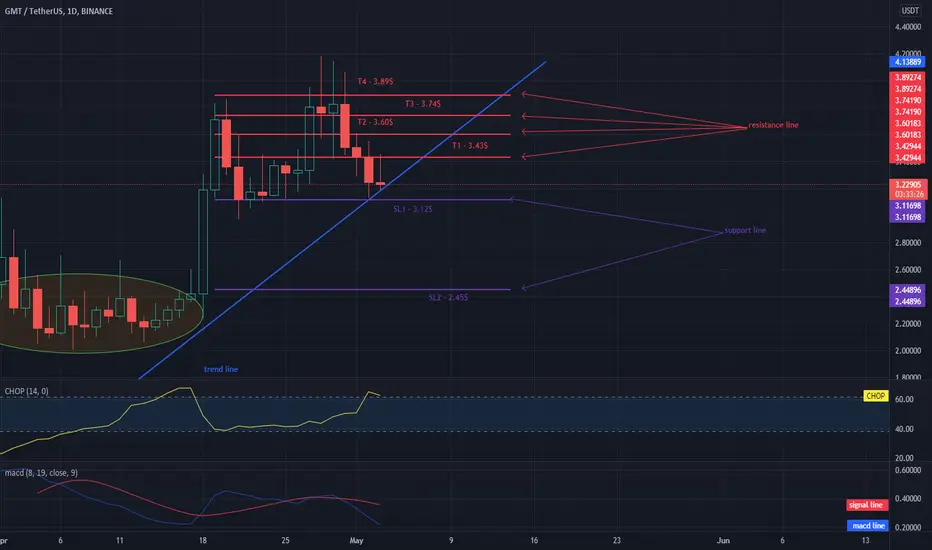
GMT has a price adjustment but has collected a lot of 1D energyHello everyone, let's take a look at the 1D GMT to USDT chart. As you can see, price is moving above the local uptrend line.
Let's start with the designation of the support line and as you can see the first support in the near future is SL1 - $ 3.12, if the support breaks, the next one is SL2 - $ 2.45. It is worth choosing at least one stop loss.
Now let's move from the resistance line, as you can see, the first resistance is T1 - $ 3.43, if you can break it, the next resistance will be T2 - $ 3.60 and T3 - $ 3.74 and T4 - $ 3.89.
Looking at the CHOP indicator, we can see that on the 1D m interval, we have a lot of energy for the next move, while the MACD indicator shows a downward trend because the blue line is below the red one.
GMTUSDT_TIME FRAME:4HHELLO EVERYONE
according to this chart:
we expecting
Despite the break of the long-term uptrend line Prices move towards lower targets
Targets were marked on the chart
Be profitable....


GMT/USDT back in accumulation zone to prepare next pump movementHello dear traders, we here new so we ask you to support our ideas with your LIKE and COMMENT, also be free to ask any question in comments, we will try to answer for all, thank you guys.
Price is tried to break ath and go higher to 5$ or so,
But this is not happened and price back to Accumulation/Support zone.
Stepn is still very popular token at this moment.
And gmt already gave 40x or around 4000% profit.
I still think stepn will continue to rise .
Target 5$ us still possible but now I would like to highlight the following targets.
First is previous ath level 3.85 and second is 4.60 level at resistance line.
Price can some time trades inside accumulation zone.
Maybe even go to 3-2.90 before pump movement.
But anyway I'm expect gmt above 4$ and close 5$ soon.
I expect this scenario, so be prepare for next movements.
Thanks for your time, we hope our work is good for you, and you are satisfied, wish you a good day and big profits.

GMTUSDT_TIME FRAME:4HHELLO EVERYONE
according to this chart:
we expecting
Despite the break of the long-term uptrend line Prices move towards lower targets
Targets were marked on the chart
Be profitable....

GMTUSDT 15M SHORT TRIANGLEgmt 15M short with triangle breakout
shorted from 3.30 tp 3.25 with 25x lev

Trading opportunity on GMTUSDTBased on technical factors there is a short position in :
📊 GMTUSDT STEPN
🔴 Short Now 3.32000
🧯 Stop loss 3.75000
🏹 Target 1 2.85000
🏹 Target 2 2.37000
🏹 Target 3 1.78000
💸Capital : 1%
We hope it is profitable for you ❤️
Please support our activity with your likes👍 and comments📝

GMTUSDT shortGMT forming bear flag after yesterdays drop. Seems like it will drop further. Good luck.

Long GMTHello, considering the range of Tetr and the ascending channel of GMT, it seems that the price will move up to the middle of the channel. Good luck.

GMT could break to 2.95, or reverse if there's more volumeBINANCE:GMTUSDT
Hello everyone,
Gmt shows weakness last few dayes, coud break to 2.95 and 2.65
Trade wisely, and remember that this is not financial advice.
Do your research, and do not forget to like and subscribe if you find this analysis helpful. Thanks
