GMT/USDT Breakout Alert! Major Downtrend Broken🔻 End of a Long-Term Downtrend?
GMT has been in a strong downtrend since late 2024. A clearly defined descending trendline has acted as strong resistance—until now. The price has bounced from the major support zone between $0.0364 and $0.0425, which has held multiple times since March 2025.
🚀 Break
Related pairs

GMTUSDT 1D AnalysisGMT ~ 1D Analysis
#GMT Buy back gradually from here if you still have confidence in this coin with a short term target of at least 15%+ from here.

forsah GMTFirst-class forsah based on the conditions of the forsah Indicator by Technical Analyst Abu Hammam 🚀📈🔥
GMTUSDT 1D AnalysisGMT ~ 1D Analysis
#GMT Buy gradually from here if you still have confidence in this coin with a short term target of at least 10%++ from here.

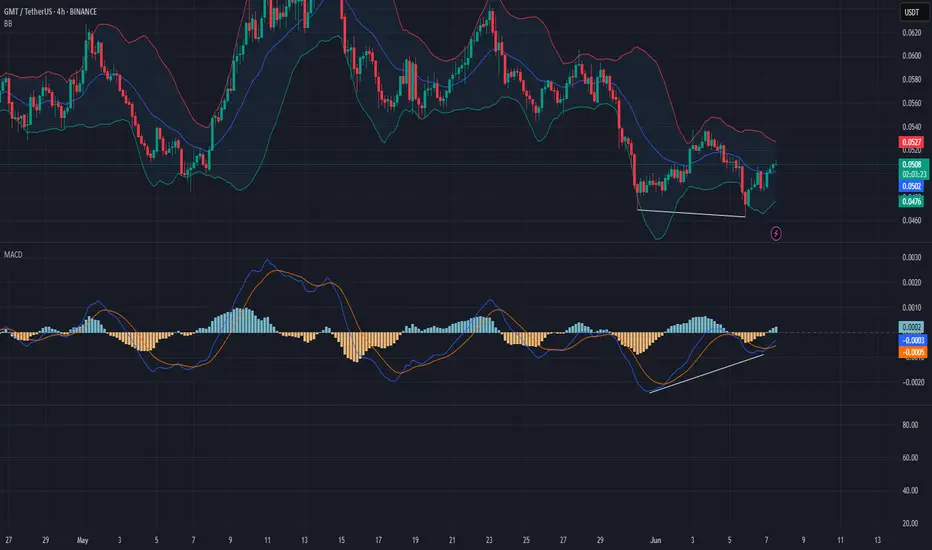
GMT New Update (The bullish wave is continuing) 12HThis analysis is an update of the analysis you see in the "Related publications" section
The previous setup is canceled due to the risk of being left behind.
The wave structure has been reanalyzed. It appears that GMT is in a large corrective pattern, likely a diametric, and wave F has completed.

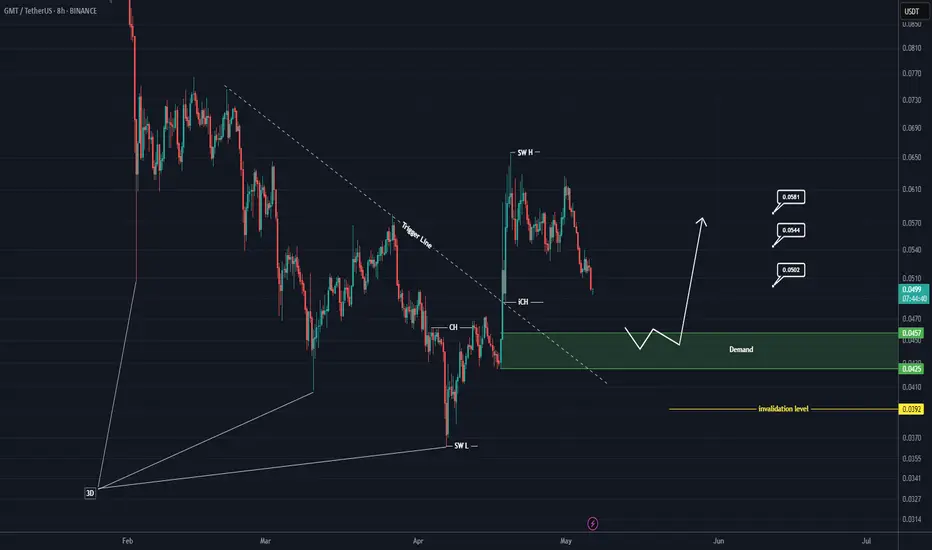
GMT Rebuy Setup (8H)Given the broken 3D pattern at the bottom and the trendline break, our demand zone is considered highly valuable. Therefore, we will look to enter a buy position within the green zone, which has been the origin of a strong move.
The price is currently in a support zone, but we will only enter a pos
GMT Daily Analysis | Bearish Continuation Toward Key Support👀 Welcome to my Trading View Analysis and Trading Channel Here , we share the latest market analysis, trading signals, and key insights together .
Ready for smarter trades ? ⭐️
🧠 Technical Analysis of GMT Coin – Daily Timeframe
This analysis reviews the recent price behavior of GMT coin on the d

GMT Buy breakoutSuccessfully penetrating this resistant line with a short -term target of at least 10%+ from here.

GmtusdtGmt is looking promising and could see an increase in price after the completion of a corrective pattern

GMTUSDT – Trendline Breakout, and Potential for Continuation!GMT has finally shown signs of strength after a prolonged downtrend. The pair has broken out of its descending trendline, a key structure that had been capping price action for weeks. This breakout is more than just a technical event — it signals a potential shift in market sentiment 🧠.
One of the

See all ideas
Summarizing what the indicators are suggesting.
Oscillators
Neutral
SellBuy
Strong sellStrong buy
Strong sellSellNeutralBuyStrong buy
Oscillators
Neutral
SellBuy
Strong sellStrong buy
Strong sellSellNeutralBuyStrong buy
Summary
Neutral
SellBuy
Strong sellStrong buy
Strong sellSellNeutralBuyStrong buy
Summary
Neutral
SellBuy
Strong sellStrong buy
Strong sellSellNeutralBuyStrong buy
Summary
Neutral
SellBuy
Strong sellStrong buy
Strong sellSellNeutralBuyStrong buy
Moving Averages
Neutral
SellBuy
Strong sellStrong buy
Strong sellSellNeutralBuyStrong buy
Moving Averages
Neutral
SellBuy
Strong sellStrong buy
Strong sellSellNeutralBuyStrong buy
Displays a symbol's price movements over previous years to identify recurring trends.
Curated watchlists where GMTUSDT is featured.

Metaverse tokens: VR crypto for a VR world
21 No. of Symbols
See all sparks
Frequently Asked Questions
The current price of GMT/TETHERUS (GMT) is 0.0457 USDT — it has risen 0.71% in the past 24 hours. Try placing this info into the context by checking out what coins are also gaining and losing at the moment and seeing GMT price chart.
GMT/TETHERUS price has fallen by −2.53% over the last week, its month performance shows a −14.52% decrease, and as for the last year, GMT/TETHERUS has decreased by −69.78%. See more dynamics on GMT price chart.
Keep track of coins' changes with our Crypto Coins Heatmap.
Keep track of coins' changes with our Crypto Coins Heatmap.
GMT/TETHERUS (GMT) reached its highest price on Dec 4, 2024 — it amounted to 0.2639 USDT. Find more insights on the GMT price chart.
See the list of crypto gainers and choose what best fits your strategy.
See the list of crypto gainers and choose what best fits your strategy.
GMT/TETHERUS (GMT) reached the lowest price of 0.0364 USDT on Apr 7, 2025. View more GMT/TETHERUS dynamics on the price chart.
See the list of crypto losers to find unexpected opportunities.
See the list of crypto losers to find unexpected opportunities.
The safest choice when buying GMT is to go to a well-known crypto exchange. Some of the popular names are Binance, Coinbase, Kraken. But you'll have to find a reliable broker and create an account first. You can trade GMT right from TradingView charts — just choose a broker and connect to your account.
Crypto markets are famous for their volatility, so one should study all the available stats before adding crypto assets to their portfolio. Very often it's technical analysis that comes in handy. We prepared technical ratings for GMT/TETHERUS (GMT): today its technical analysis shows the neutral signal, and according to the 1 week rating GMT shows the sell signal. And you'd better dig deeper and study 1 month rating too — it's sell. Find inspiration in GMT/TETHERUS trading ideas and keep track of what's moving crypto markets with our crypto news feed.
GMT/TETHERUS (GMT) is just as reliable as any other crypto asset — this corner of the world market is highly volatile. Today, for instance, GMT/TETHERUS is estimated as 4.78% volatile. The only thing it means is that you must prepare and examine all available information before making a decision. And if you're not sure about GMT/TETHERUS, you can find more inspiration in our curated watchlists.
You can discuss GMT/TETHERUS (GMT) with other users in our public chats, Minds or in the comments to Ideas.