GMT/USDT Breakout Alert! Major Downtrend Broken🔻 End of a Long-Term Downtrend?
GMT has been in a strong downtrend since late 2024. A clearly defined descending trendline has acted as strong resistance—until now. The price has bounced from the major support zone between $0.0364 and $0.0425, which has held multiple times since March 2025.
🚀 Breakout Confirmation in Progress:
The chart shows a potential breakout from the descending trendline (yellow). A confirmed breakout with volume would indicate the start of a bullish reversal pattern.
🎯 Key Resistance / Profit Targets:
$0.0474 – Initial minor resistance
$0.0555 – First bullish confirmation
$0.0665 to $0.0744 – Medium-term target
$0.0977 to $0.1302 – Strong upside potential
$0.2108 to $0.2471 – Full bullish target zone if momentum continues
📌 Additional Notes:
The highlighted yellow area is a demand zone signaling potential accumulation.
This setup aligns with classic breakout-reversal formations.
Excellent risk/reward due to proximity to strong support.
#GMTUSDT #GMT #CryptoBreakout #AltcoinSeason #CryptoReversal
#TechnicalAnalysis #BreakoutCrypto #TradingSignals #CryptoTA
#BinanceTrading
GMTUSDT trade ideas

GMTUSDT 1D AnalysisGMT ~ 1D Analysis
#GMT Buy back gradually from here if you still have confidence in this coin with a short term target of at least 15%+ from here.

forsah GMTFirst-class forsah based on the conditions of the forsah Indicator by Technical Analyst Abu Hammam 🚀📈🔥
GMTUSDT 1D AnalysisGMT ~ 1D Analysis
#GMT Buy gradually from here if you still have confidence in this coin with a short term target of at least 10%++ from here.

GMT New Update (The bullish wave is continuing) 12HThis analysis is an update of the analysis you see in the "Related publications" section
The previous setup is canceled due to the risk of being left behind.
The wave structure has been reanalyzed. It appears that GMT is in a large corrective pattern, likely a diametric, and wave F has completed. Wave F was a symmetrical structure that has now ended.
As long as the POI zone holds, the price can move toward the targets. The targets are marked on the chart. This movement is considered wave G of a higher degree.
A daily candle closing below the invalidation level will invalidate this view.
For risk management, please don't forget stop loss and capital management
When we reach the first target, save some profit and then change the stop to entry
Comment if you have any questions
Thank You

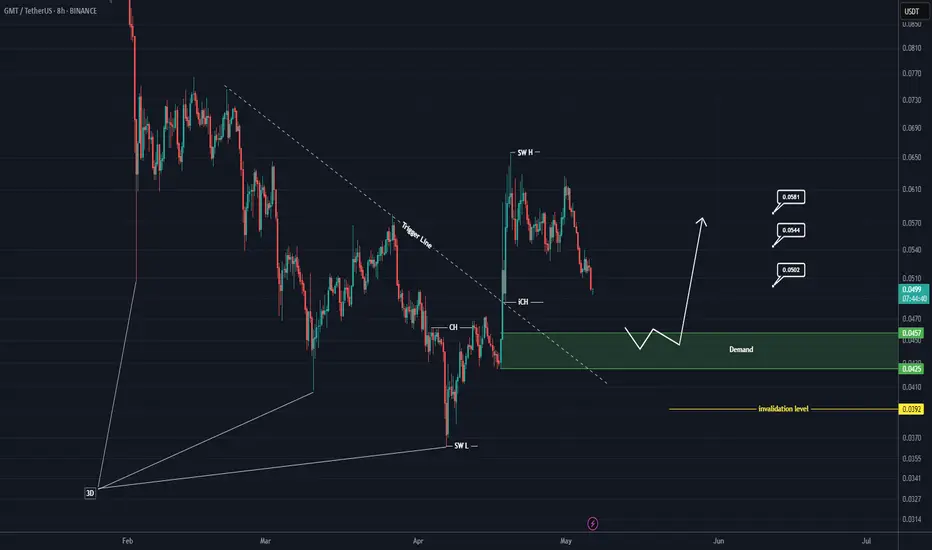
GMT Rebuy Setup (8H)Given the broken 3D pattern at the bottom and the trendline break, our demand zone is considered highly valuable. Therefore, we will look to enter a buy position within the green zone, which has been the origin of a strong move.
The price is currently in a support zone, but we will only enter a position if it reaches the green zone marked on the chart.
A daily candle closing below the invalidation level will invalidate this analysis.
For risk management, please don't forget stop loss and capital management
When we reach the first target, save some profit and then change the stop to entry
Comment if you have any questions
Thank You
GMT Daily Analysis | Bearish Continuation Toward Key Support👀 Welcome to my Trading View Analysis and Trading Channel Here , we share the latest market analysis, trading signals, and key insights together .
Ready for smarter trades ? ⭐️
🧠 Technical Analysis of GMT Coin – Daily Timeframe
This analysis reviews the recent price behavior of GMT coin on the daily chart. Based on the current market structure, there are multiple technical signals suggesting the continuation of the downtrend and a possible entry into a consolidation phase.
1. 🚀 Sharp Uptrend Followed by a Correction Phase
Initially, GMT experienced a sharp bullish rally, accompanied by a noticeable surge in trading volume, pushing the price to higher levels. However, after the rally peaked, the price entered a corrective phase that still appears to be ongoing.
2. ❌ Breakdown of the Key $0.058 Support Level
One of the most critical developments during the correction was the breakdown of the $0.058 support zone. This level had previously acted as a strong support area. Its failure signals growing selling pressure and increases the likelihood of the downtrend continuing.
3. 📉 Bearish Reaction to the 3 SMA Indicator
During its downward movement, the price encountered the 3 SMA indicator (a combination of three Simple Moving Averages). The key observations are:
All recent candlesticks have closed below the SMA lines
This is considered a strong bearish confirmation in technical analysis
It also highlights the dominance of sellers at this stage of the market
4. 🛡 Major Support Area at $0.043
Given the ongoing bearish pressure, the $0.043 support level has become a critical area to watch. Historically, this level has successfully prevented further declines and may act as a strong support once again.
If the price reaches this zone, it may:
Show a supportive reaction (respect the level)
Enter a short-term consolidation range
Or potentially initiate a new bullish wave, depending on candlestick formations and trading volume around that level
✅ Final Summary:
The overall trend remains bearish for now
The break of $0.058 and candlestick closures below the 3 SMA confirm ongoing selling pressure
The $0.043 level is a critical support zone that could trigger a potential reversal or consolidation
🗞 Recent GMT Weekly Highlights
Here are the key developments from the past week in the GMT ecosystem:
1️⃣ 🔥 Buyback & Burn of 600M GMT Tokens
GMT DAO announced a massive buyback of 600 million tokens worth around $100M. After a community vote, these tokens may be burned — a move expected to reduce supply and potentially support price growth.
2️⃣ 👟 Adidas Partnership & NFT Sneakers
The STEPN project partnered with Adidas to launch 1,200 limited edition physical sneakers tied to NFTs. This collaboration aims to boost brand visibility and attract new users.
3️⃣ 🎁 Massive Community Airdrop
An additional 600 million GMT tokens will be distributed via airdrop to increase community engagement and encourage participation in DAO governance.
I love you all so much . 👀
don't forget about capital management and risk management .
Be careful with your positions . 🥇

GMT Buy breakoutSuccessfully penetrating this resistant line with a short -term target of at least 10%+ from here.

GmtusdtGmt is looking promising and could see an increase in price after the completion of a corrective pattern

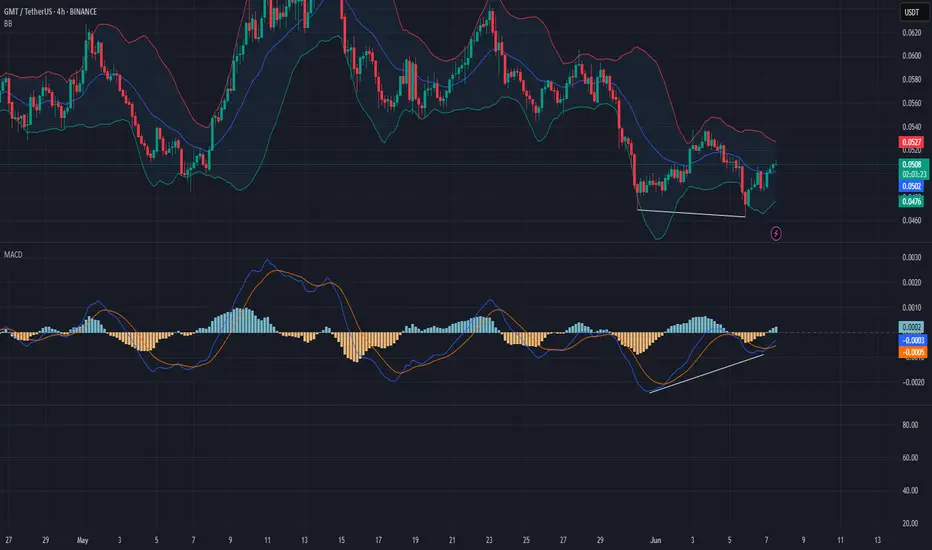
GMTUSDT – Trendline Breakout, and Potential for Continuation!GMT has finally shown signs of strength after a prolonged downtrend. The pair has broken out of its descending trendline, a key structure that had been capping price action for weeks. This breakout is more than just a technical event — it signals a potential shift in market sentiment 🧠.
One of the most important developments is the break above the previous lower high, which confirms a short-term bullish market structure. With this structure change, bulls have gained the upper hand — at least for now 🐂.
Currently, we are seeing what looks like a re-accumulation phase just above the breakout zone. This consolidation is healthy and typical after a strong impulse move. If GMT manages to hold above this area, we could be looking at the early stages of a bullish continuation, targeting the strong resistance zone around 0.074 🔥.
However, it’s also important to be prepared for a possible pullback. If that happens, the demand zone between 0.0487 and 0.0533 will be crucial. A retest of this zone could act as a springboard for the next upward move. 📈
🔍 Key Technical Highlights:
📉 Demand Zone: 0.0487 – 0.0533
📈 Next Target: 0.074 (Strong Resistance Area)
Final Thoughts:
Momentum is building, but confirmation is key. Watching how price reacts in the coming sessions — especially around the consolidation and demand zones — will be crucial for spotting the next big move. If bulls maintain control, we could see GMT pushing toward new short-term highs in the coming days. Patience and proper risk management are your best friends here.

GMTUSDT Analysis: Resistance and StrategyIn GMTUSDT, the red boxes represent key resistance zones . However, caution is essential as the price is currently in a strong bullish trend .
Key Highlights:
Red Boxes as Resistance: These zones are significant but require lower time frame confirmations for short entries.
Bullish Momentum: The price shows strength, aligning with my general long position target of 102k$ .
Hedge Strategy: I will consider these levels for hedge shorts while maintaining a broader long bias.
Confirmation Indicators:
Before trading these zones, I recommend using tools such as CDV, liquidity heatmaps, volume profiles, and volume footprints for confirmation.
Learn My Techniques: Interested in mastering these advanced tools to refine your trading? DM me, and I'll teach you step by step!
Support and Motivate: If this analysis helps, please boost and comment. Your engagement drives me to share more!
If you think this analysis helps you, please don't forget to boost and comment on this. These motivate me to share more insights with you!
I keep my charts clean and simple because I believe clarity leads to better decisions.
My approach is built on years of experience and a solid track record. I don’t claim to know it all, but I’m confident in my ability to spot high-probability setups.
If you would like to learn how to use the heatmap, cumulative volume delta and volume footprint techniques that I use below to determine very accurate demand regions, you can send me a private message. I help anyone who wants it completely free of charge.
My Previous Analysis (the list is long but I think it's kinda good : )
🎯 ZENUSDT.P: Patience & Profitability | %230 Reaction from the Sniper Entry
🐶 DOGEUSDT.P: Next Move
🎨 RENDERUSDT.P: Opportunity of the Month
💎 ETHUSDT.P: Where to Retrace
🟢 BNBUSDT.P: Potential Surge
📊 BTC Dominance: Reaction Zone
🌊 WAVESUSDT.P: Demand Zone Potential
🟣 UNIUSDT.P: Long-Term Trade
🔵 XRPUSDT.P: Entry Zones
🔗 LINKUSDT.P: Follow The River
📈 BTCUSDT.P: Two Key Demand Zones
🟩 POLUSDT: Bullish Momentum
🌟 PENDLEUSDT.P: Where Opportunity Meets Precision
🔥 BTCUSDT.P: Liquidation of Highly Leveraged Longs
🌊 SOLUSDT.P: SOL's Dip - Your Opportunity
🐸 1000PEPEUSDT.P: Prime Bounce Zone Unlocked
🚀 ETHUSDT.P: Set to Explode - Don't Miss This Game Changer
🤖 IQUSDT: Smart Plan
⚡️ PONDUSDT: A Trade Not Taken Is Better Than a Losing One
💼 STMXUSDT: 2 Buying Areas
🐢 TURBOUSDT: Buy Zones and Buyer Presence
🌍 ICPUSDT.P: Massive Upside Potential | Check the Trade Update For Seeing Results
🟠 IDEXUSDT: Spot Buy Area | %26 Profit if You Trade with MSB
📌 USUALUSDT: Buyers Are Active + %70 Profit in Total
🌟 FORTHUSDT: Sniper Entry +%26 Reaction
🐳 QKCUSDT: Sniper Entry +%57 Reaction
📊 BTC.D: Retest of Key Area Highly Likely
I stopped adding to the list because it's kinda tiring to add 5-10 charts in every move but you can check my profile and see that it goes on..

GMTUSDT - Sorry but Still Not Looking GoodCheck out our latest GMTUSDT analysis which is on %80 profit right now.
GMTUSDT is currently facing some challenges, and it’s not looking particularly favorable in the short term. The red boxes are acting as significant resistance zones, where the price has struggled to break through in the past. As we know, these levels are likely to continue attracting selling pressure, so we need to be cautious here.
From a strategic standpoint, I’m still maintaining a bearish outlook until proven otherwise. The price hasn’t shown any significant bullish momentum yet, and these red zones could prove to be difficult for buyers to break through. If you’re considering shorting, look for confirmations on lower timeframes around these red boxes. A clear rejection or failed break above these levels could present a strong shorting opportunity.
That said, if the price does manage to break above the red zones with volume and confirms these levels as support, I’ll be open to considering long positions. However, I won’t rush into any trades without seeing a confirmed change in momentum.
Remember, patience and smart trading with confirmation are key to avoiding unnecessary risks. Keep an eye on these red boxes, but don’t jump the gun—let the market show its intention before acting. We’re here to follow a well-defined strategy, not chase every move. If the price pushes above these levels and holds, it could be time to look for a possible long entry, but until then, staying cautious and following the flow is the way to go.
Always use proper risk management, and don’t forget to trade with the plan you’ve set, using the confirmations that matter most.
📌I keep my charts clean and simple because I believe clarity leads to better decisions.
📌My approach is built on years of experience and a solid track record. I don’t claim to know it all but I’m confident in my ability to spot high-probability setups.
📌If you would like to learn how to use the heatmap, cumulative volume delta and volume footprint techniques that I use below to determine very accurate demand regions, you can send me a private message. I help anyone who wants it completely free of charge.
🔑I have a long list of my proven technique below:
🎯 ZENUSDT.P: Patience & Profitability | %230 Reaction from the Sniper Entry
🐶 DOGEUSDT.P: Next Move
🎨 RENDERUSDT.P: Opportunity of the Month
💎 ETHUSDT.P: Where to Retrace
🟢 BNBUSDT.P: Potential Surge
📊 BTC Dominance: Reaction Zone
🌊 WAVESUSDT.P: Demand Zone Potential
🟣 UNIUSDT.P: Long-Term Trade
🔵 XRPUSDT.P: Entry Zones
🔗 LINKUSDT.P: Follow The River
📈 BTCUSDT.P: Two Key Demand Zones
🟩 POLUSDT: Bullish Momentum
🌟 PENDLEUSDT.P: Where Opportunity Meets Precision
🔥 BTCUSDT.P: Liquidation of Highly Leveraged Longs
🌊 SOLUSDT.P: SOL's Dip - Your Opportunity
🐸 1000PEPEUSDT.P: Prime Bounce Zone Unlocked
🚀 ETHUSDT.P: Set to Explode - Don't Miss This Game Changer
🤖 IQUSDT: Smart Plan
⚡️ PONDUSDT: A Trade Not Taken Is Better Than a Losing One
💼 STMXUSDT: 2 Buying Areas
🐢 TURBOUSDT: Buy Zones and Buyer Presence
🌍 ICPUSDT.P: Massive Upside Potential | Check the Trade Update For Seeing Results
🟠 IDEXUSDT: Spot Buy Area | %26 Profit if You Trade with MSB
📌 USUALUSDT: Buyers Are Active + %70 Profit in Total
🌟 FORTHUSDT: Sniper Entry +%26 Reaction
🐳 QKCUSDT: Sniper Entry +%57 Reaction
📊 BTC.D: Retest of Key Area Highly Likely
📊 XNOUSDT %80 Reaction with a Simple Blue Box!
📊 BELUSDT Amazing %120 Reaction!
I stopped adding to the list because it's kinda tiring to add 5-10 charts in every move but you can check my profile and see that it goes on..

$GMT is showing signs of a major breakout!NZX:GMT is showing signs of a major breakout! ⚡️
Currently bouncing from the bottom of the falling wedge on the weekly chart—a classic reversal setup.
Once we see a breakout from this pattern, a massive upside move could follow.
Potential 3.5x from here!
Keep it on your radar. Big move loading... 👀
DYOR, NFA.

GMT/USDT Analysis – 1D Chart (OKX)GMT/USDT Analysis – 1D Chart (OKX)
Support Levels:
First support: 0.0501 USDT
Next support: 0.0478 USDT
Key support: 0.0407 – 0.0401 USDT
Resistance Levels:
First resistance: 0.0953 USDT (Supply Zone)
Next resistance: 0.1517 USDT
Major resistance: 0.1974 – 0.2638 USDT
Entry Points:
If the price holds above 0.0501 USDT, it may be a potential long entry opportunity.
A breakout above 0.0953 USDT could lead to a further move towards 0.1517 USDT.
If the price drops below 0.0478 USDT, selling pressure may increase.
Risk Assessment:
If the price falls below 0.0401 USDT, it could drop further to 0.0107 USDT.
Stop-loss should be placed below 0.0401 USDT.
Trade Conditions:
GMT is in a strong downtrend but currently forming a potential bottoming structure.
If it breaks above 0.0953 USDT, there could be a bullish reversal.
If it fails to hold 0.0501 USDT, the downtrend may continue.
📌 Summary:
GMT is at a crucial support zone. If it holds above 0.0501 USDT, it could attempt a bullish recovery. However, if it fails to break above 0.0953 USDT, further downside movement is possible. Watch price action closely before making a decision. 🚀

gmtMy personal opinion is to check the channel bottom and those two green lines for buying. In the short term, there is a small resistance in the red lines that can go lower as long as it doesn't break.

GMT Buy/Long Setup (2H) RiskyFirst of all, be aware that this setup is not low-risk. However, the invalidation level is close to the entry zone, and if it gets hit, the setup will be stopped.
There are two liquidity pools on the chart, one above and one below. We anticipate that the upper liquidity pool will be collected first, and then the price will be rejected from the order block above this pool.
From a wave count perspective, we have completed wave A and are now in wave B, which is a diametric pattern. We are currently in the final wave of this diametric, wave G.
After wave B is completed, we expect a bullish wave C.
Manage your risk carefully.
For risk management, please don't forget stop loss and capital management
Comment if you have any questions
Thank You

GMT IS GONNA EXPLODE !#GMT was in a real down trend from 2022 and the price went down to 1/100 of its ATH !
i think coins like this can stop falling when we see a divergence in their RSI and also we can expect a rising if a harmonic pattern tells us this coin is on a demand which it is !
its a good price for this coin to make a buy and sell it when it hits the flip line
this trade can give us about 80% profit 1X leverage !

GMT looks like a rocket (1D)GMT, unlike other altcoins, is in a valuable range.
We have a symmetrical pattern with time-price similarities. Each bearish wave has dropped approximately 80%. Now, the last bearish wave of this symmetrical pattern has also dropped 80%.
The green zone is considered a valuable range for this coin.
The bullish legs of this pattern have usually exceeded 200%.
Since we are in the final bearish wave of this pattern, we should expect a post-pattern move.
This move will be sharper and faster than the previous bullish legs because it is not corrective but post-pattern. If the count is correct, we should see a +200% bullish move from this coin.
A buy opportunity can be considered in the spot market within the green zone.
If a daily candle closes below the invalidation level, this outlook will be invalidated.
For risk management, please don't forget stop loss and capital management
Comment if you have any questions
Thank You

GMTUSDT LOOKS OVERSOLDGMT is the native token of the FSL ecosystem, with a fixed supply of 6 billion tokens. GMT is well used in all FSL ecosystem products to be burned, used to unlock various functions and perks.

#GMT (SPOT-INVEST) entry ( 0.0850- 0.0910) T.(0.9500) SL(0.0846)BINANCE:GMTUSDT
#GMT/ USDT
Entry ( 0.0850- 0.0910)
SL 3D close below 0.0846
T1 0.3500
T2 0.5400
T3 0.7900
T4 0.9500
3 Extra Targets(optional) in chart, if you like to continue in the trade with making stoploss very high.
______________________________________________________________
Golden Advices.
********************
* collect the coin slowly in the entry range.
* Please calculate your losses before the entry.
* Do not enter any trade you find it not suitable for you.
* No FOMO - No Rush , it is a long journey.
Useful Tags.
****************
My total posts
www.tradingview.com
**********************************************************************************************
#Manta #OMNI #DYM #AI #IO #XAI #ACE #NFP #RAD #WLD #ORDI #BLUR #SUI #VOXEL #AEVO #VITE #APE #RDNT #FLUX #NMR #VANRY #TRB #HBAR #DGB #XEC #ERN #ALT #IO #ACA #HIVE #ASTR #ARDR #PIXEL #LTO #AERGO #SCRT #ATA #HOOK #FLOW #KSM #HFT #MINA #DATA #SC #JOE #RDNT #IQ #CFX #BICO #CTSI #KMD #FXS #DEGO #FORTH #AST #PORTAL #CYBER #RIF #ENJ #ZIL #APT #GALA #STEEM #ONE #LINK #NTRN #COTI #RENDER #ICX #IMX #ALICE #PYR #PORTAL #GRT #GMT #IDEX #NEAR #ICP #ETH #QTUM #VET #QNT #API3 #BURGER #MOVR #SKL #BAND #ETHFI #SAND #IOTX #T #GTC #PDA #GMX #REZ #DUSK #BNX #SPELL #POWR #JOE #TIA

#GMT (SPOT) entry ( 0.1400- 0.1960) T.(0.9500) SL(0.1300)BINANCE:GMTUSDT
#GMT/ USDT
Entry ( 0.1400- 0.1960)
SL 1D close below 0.1300
T1 0.3500
T2 0.5400
T3 0.7900
T4 0.9500
3 Extra Targets(optional) in chart, if you like to continue in the trade with making stoploss very high.
______________________________________________________________
Golden Advices.
********************
* collect the coin slowly in the entry range.
* Please calculate your losses before the entry.
* Do not enter any trade you find it not suitable for you.
* No FOMO - No Rush , it is a long journey.
Useful Tags.
****************
My total posts
www.tradingview.com
1Million Journey
www.tradingview.com
www.tradingview.com
**********************************************************************************************
#Manta #OMNI #DYM #AI #IO #XAI #ACE #NFP #RAD #WLD #ORDI #BLUR #SUI #VOXEL #AEVO #VITE #APE #RDNT #FLUX #NMR #VANRY #TRB #HBAR #DGB #XEC #ERN #ALT #IO #ACA #HIVE #ASTR #ARDR #PIXEL #LTO #AERGO #SCRT #ATA #HOOK #FLOW #KSM #HFT #MINA #DATA #SC #JOE #RDNT #IQ #CFX #BICO #CTSI #KMD #FXS #DEGO #FORTH #AST #PORTAL #CYBER #RIF #ENJ #ZIL #APT #GALA #STEEM #ONE #LINK #NTRN #COTI #RENDER #ICX #IMX #ALICE #PYR #PORTAL #GRT #GMT #IDEX #NEAR #ICP #ETH #QTUM #VET #QNT #API3 #BURGER #MOVR #SKL #BAND #ETHFI #SAND #IOTX #T #GTC #PDA #GMX #REZ #DUSK #BNX #SPELL #POWR #JOE #TIA

#GMT/USDT attempting to reclaim PWL $0.1074 as support.#GMT/USDT attempting to reclaim PWL $0.1074 as support.
⏳ Plan: Wait for a trendline breakout and retest for a long setup.
🚩 Key Levels:
Resistance: PML $0.126

Is GMTUSDT Primed for a Breakout?Catch the Wave: GMT on the Verge of a Key Move
As of today, GMTUSDT is trading at $0.1066, standing 97.43% below its historical high of $4.15 from April 2022 and recovering 26.15% from its August 2024 low of $0.0845. The asset’s recent movement shows potential for significant momentum, supported by critical technical markers and volume patterns.
Despite the broader market's indecision, GMTUSDT’s RSI hovers near 53.53, signaling a neutral yet cautiously optimistic stance, while the MFI indicates underwhelming buying pressure at 37.10. This mix of metrics places the asset at a crossroads: consolidation or breakout?
Yesterday, a VSA Manipulation Sell Pattern emerged, hinting at a short-term pullback, but this follows a sequence of "Buy Volume Max" patterns earlier in the week, showcasing a potential accumulation phase. With resistance clustering at $0.1228 and $0.1294, traders should watch for a break above these levels, as this could ignite a rally fueled by a mix of technical and fundamental catalysts.
The question remains: Is the market ready for GMT to reclaim the bullish narrative? For traders and investors, the coming days may offer a defining moment. Are you prepared to ride the wave or step aside?
Roadmap: Tracking GMTUSDT's Patterns to Decode Market Moves
2025-01-19 02:00:00 – VSA Sell Pattern 2
This pattern set the stage with a Sell direction, identifying a potential breakdown below the high_3_bars level of 0.1286. However, the next pattern on 2025-01-19 07:00:00, a VSA Buy Pattern Extra 1st, flipped the narrative, signaling bullish action. This suggests the Sell Pattern 2 failed to activate its trigger point at the high level, indicating limited influence on the market.
2025-01-19 07:00:00 – VSA Buy Pattern Extra 1st
Marked as the turning point, this Buy direction triggered a rally from its low of 0.1195, creating a bullish sequence. Confirmation came with subsequent Buy Volume Max patterns, solidifying the shift in sentiment. Price momentum surged upward, aligning with the main direction of this pattern.
2025-01-20 00:00:00 – Sell Volumes Max
After bullish patterns dominated, this pattern forecasted a Sell direction. The price, previously testing highs near 0.1238, reversed and validated the Sell setup as the market retraced. This indicates a well-executed pivot, setting up traders for potential downside plays.
2025-01-21 16:00:00 – VSA Sell Pattern 4
A critical pattern, forecasting a Sell direction with low_3_bars at 0.099. This confirmed a broader bearish sentiment. As the price failed to reclaim the 0.1051 resistance level, the downward trajectory suggested the market respected the triggers outlined in this pattern.
2025-01-21 17:00:00 – VSA Buy Pattern 5
This pattern followed shortly after, signaling a potential reversal. The Buy direction saw a quick test of prior lows near 0.0979, rallying to challenge 0.1045, providing strong short-term recovery opportunities. This validated the market's responsiveness to consecutive directional shifts.
Conclusion :
The roadmap reveals GMTUSDT's intricate dance between buying and selling pressures, with several patterns confirming their predicted directions and delivering actionable opportunities for traders. Successful patterns like VSA Buy Pattern Extra 1st and Sell Volumes Max provided clear guidance, while occasional misfires remind traders of the importance of trigger points and market confirmation.
Technical & Price Action Analysis: Key Levels to Watch
Support Levels:
The first safety net for GMTUSDT sits at 0.0845, marking the absolute low from August 2024. If buyers fail to hold this line, expect increased pressure, and this level will likely flip into resistance.
Resistance Levels:
GMT faces a series of resistance hurdles ahead. The immediate test is at 0.1228, followed by 0.1294 and 0.1344. If bulls break through these zones, the next battleground lies at 0.1384 and 0.1472. Should these levels reject price action, expect them to act as a ceiling for any upside attempts.
Powerful Support Levels:
Long-term bulls will eye 0.2448, 0.4541, 0.7402, and 0.9678 as key zones for accumulating positions during any deeper corrections. These levels are fortress-like and pivotal for significant reversals.
Powerful Resistance Levels:
While immediate focus remains on nearer resistances, traders should keep in mind these untouched levels that loom higher in the structure. For now, however, the chart shows no specific "powerful resistance levels," emphasizing the importance of breaking closer hurdles.
Pro Tip: Always keep an eye on price action around these levels. If a support gives way, it’s game over for bulls, and the same zone will likely serve as resistance for the next rally attempt. Conversely, breaking through resistance opens the door for extended bullish momentum. Adapt your strategy accordingly—don’t marry a bias, and let the market tell you the story!
Trading Strategies: Fibonacci Rays and Dynamic Factors
Concept of Rays
The "Rays from the Beginning of Movement" method combines Fibonacci mathematical principles with geometric precision to create dynamic levels that adapt to the market's behavior. Rays, drawn from the inception of a trend or corrective move, define boundaries for movement channels and offer insights into price interactions. These interactions, coupled with dynamic factors such as moving averages, provide robust signals for entry and exit points.
Why Rays Work
Predicting exact price levels is impossible due to the financial market's complexity. Instead, rays identify zones of probable reactions, signaling either reversals or continuations. Traders observe price behavior near these zones and make decisions based on confluence with patterns and dynamic support or resistance levels, such as Moving Averages.
Optimistic Scenario
If GMTUSDT interacts positively with ascending rays and surpasses key resistance zones:
First Target: $0.1228 – A breakout above this level confirms bullish momentum.
Second Target: $0.1294 – Continued strength can push the price toward this resistance.
Third Target: $0.1344 – If momentum persists, the next ray interaction will target this zone.
Bonus Levels: $0.1384 and $0.1472 – These levels represent extended bullish objectives based on ray progression.
Pessimistic Scenario
If GMTUSDT interacts negatively with descending rays or fails to hold support levels:
First Target: $0.1038 (MA50) – A breach here indicates bearish continuation.
Second Target: $0.0845 – Testing the absolute low from August 2024 suggests a significant downward shift.
Third Target: $0.0678 – If momentum is bearish, price may interact with this deep support zone, reflecting a broader sell-off.
Dynamic Interaction with Moving Averages
Moving averages play a vital role in confirming ray signals:
MA50 ($0.1038): A close above or below validates the ray's directional bias.
MA100 ($0.1102): Acts as dynamic resistance during upward attempts.
MA200 ($0.1217): A critical barrier to long-term trends and corrections.
MA233 ($0.1227): A key decision point, aligning closely with significant ray levels.
Suggested Trades Based on Rays
Long from $0.1066 to $0.1228: After confirming interaction with ascending rays, target the first resistance zone.
Short from $0.1228 to $0.1038: If price rejects at the resistance ray, aim for MA50 as the initial support target.
Breakout Trade above $0.1228 to $0.1344: A clean breakout signals strong bullish momentum, allowing traders to target subsequent rays.
Reversal Play at $0.0845 to $0.1038: If the price rebounds near the absolute low, capitalize on the recovery toward MA50.
Aggressive Long from $0.1294 to $0.1384: For experienced traders, momentum above the ray at $0.1294 suggests a run to the next dynamic zone.
Call to Action: Let’s Trade Smarter Together!
Hey traders, I hope this analysis gives you a fresh perspective and valuable insights! If you have any questions or want to discuss specific levels, drop your thoughts in the comments—let’s keep the conversation flowing. I’m always happy to engage and share ideas.
If this post resonated with you, hit that Boost button and save it to your favorites. Come back later and see how price respects the rays and levels I’ve highlighted—it’s a great way to sharpen your trading edge. Remember, understanding the key points for entries and exits is the heart of successful trading!
For those curious about my strategy: the rays and levels you see here are generated automatically using my proprietary indicator. It’s a private tool, but if you’re interested, feel free to message me directly to discuss how you can access it.
Got an asset you’d like analyzed? Let me know in the comments or via message. Some requests I’ll happily do for free and share with the community, while private setups can be tailored just for you—discreet and exclusive.
These rays aren’t just for GMT—they work across all assets. If you’re looking for personalized charting and analysis, I’m here to help. Just share the asset you’re tracking, hit Boost, and I’ll add it to my list.
Finally, don’t forget to follow me here on TradingView—this is where I post all my updates and ideas. Let’s build a strong community of traders who learn and grow together. Thanks for your support, and may the charts be ever in your favor!
