GMTUSDT trade ideas

GMT support break out - SHORTHello guys. GMT support has just broken. I think big short is coming. Be careful when entry long position.
This is not financial advise. DYOR

GMT (STEPN) : About to Break down#GMT / D1 : Break below the support will give these bearish targets. not shorting at support but waiting for a proper breakdown and a good R:R Ratio.

GMT/USDT looks bullish in long-termHey guys!
So let's take a look at GMT coin here. We see that is is sitting nicely on a support zone which is working as last support zone for this coin so we see a good possibility for a bullish movement in longer term! What do yo think?
If you like ideas provided by our team you can show us your support by liking and commenting.
Yours Sincerely,
Swallow Team 🔱
Disclamer:
We are not financial advisors. The content that we share on this website are for educational purposes and are our own personal opinions.

Trade #13 GMTDirection: (Hedging)
leverage: 10X
Long Positions
entry: 0.6234
stoploss: 0.6186 (0.77%)
! Please Keep an eye on stop loss, it could be become your entry !
Short Positions
Entry : 6.527
Stoploss : 6.608 (0.93%)
! Please Keep an eye on stop loss, it could be become your entry !

GMT Scalp longIdea is to take GMT trendline breakout while BTC is bullish too:
- We only opened daily candle
- We are under VWAP
- We were falling during american session
- 3rd touch
- At bottom we already collected liquidity. Reversal is close
If you like the idea, please, press a like to let me know that my work is valuable for you. Thank you and trade wisely!💓😊

GMT SELL SETUP TRADEHello, dear traders. how are you ? Today we have a setup to SELL/SHORT the GMT symbol.
For risk management, please don't forget stop loss and capital management

GMT/USDT about to breakoutHey guys,
GMT/USDT - Setup looks clean to us with uptrend working and clear breakout made near EMA100. Next stop should be EMA200 so let's see what will happen.
If you like ideas provided by our team you can show us your support by liking and commenting.
Yours Sincerely,
Swallow Team 🔱
Disclamer:
We are not financial advisors. The content that we share on this website are for educational purposes and are our own personal opinions.

GMT possible to increase more than 250%#GMT/USDT
$GMT broke out from descending resistance and price is above long term support zone.
🐮 so price is in a great risk/reward situation to enter, if it holds the support zone it is a high possibility to increase toward resistance zone and maybe even pupm to touch 0.5 fib level of whole swing down.

GMT - SHORT (scalp)GMT created triangle trend and in few days will propably have LONG break out
but for today and propably tomorrow it looks like BEARISH trend and might hit the area of 0.59 - 0.61
0.61 i would set as final target
0.595 additional target
0.59 additional target

GMT ShortLooks like head and shoulders forming in several time frames.
Strong resistance area 0.658/0.672
Short entry points 0.658 and 0.671
Take profit target 0.48 -> Final target 0.15
STL 0.70

One more basing asset!Holy I'm finding basing assets after basing asset.
Who knows, but this is finding absurd support.

STEPN GMTUSDT stepsas STEPN price ascend and descend through it's days, we've known several key points in GMTUSDT price chart.
here are these price ranges that price has ever bounced through.
but there is one important thing!
the volume indicator, doesn't show a strong vibe.
but there is still time for increase in this matter.
I think 0.55~0.65 is a safe place to start getting bullish.
also, RSI shows some good things.
hope you succeed.
DYOR

🔥 GMT Bearish Triangle: Patience For Break OutGMT has formed a bearish triangle over the course of several months now. Every time, the yellow support area holds and causes some kind of rally towards the purple dotted resistance line.
With both the resistance and support lines closing in on each other, a break out is to be expected soon.
I'm looking for a potential bearish entry. A daily close below the yellow support area would indicate significant weakness and signal a potential further decline, targets in blue.

GMTUSDT review 1D IntervalHello everyone, let's take a look at the 1D GMT to USDT chart as you can see the price has come out of the downtrend channel and is moving on the verge of returning to that channel.
Let's start by setting goals for the near future that we can take into account, in this case we have two zones of resistance
First from $ 0.7405 - $ 0.8305
and
Second from $ 1.0913 - $ 1.2240
Now let's move on to support in case of further market downturns, and as you can see in the chart, we have two important support zones
The first zone from $ 0.6099 - $ 0.5310 where the price is currently located
Looking at the CHOP indicator, we can see that in the 4H range the energy slowly starts to rise, while the MACD indicator shows a local upward trend.

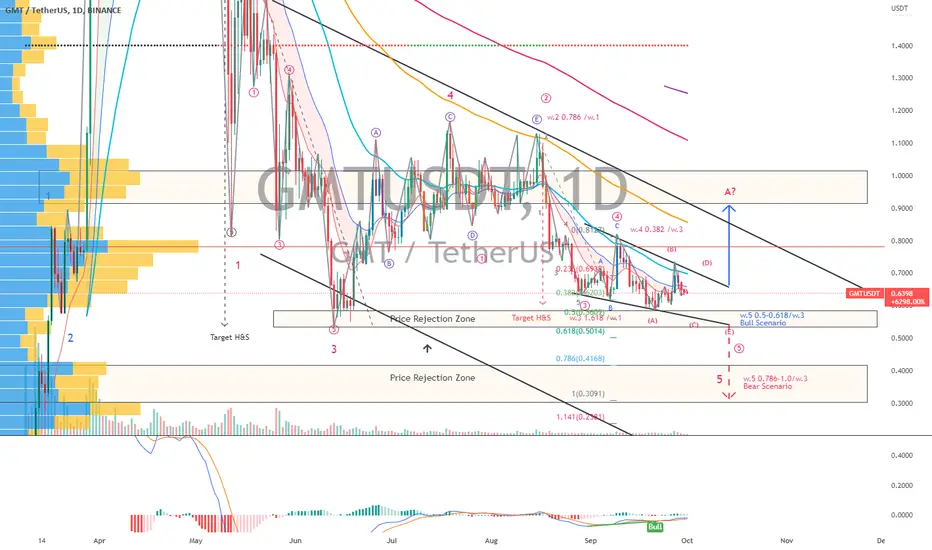
GMTUSDT | Wave Analysis | Target Triangle Breakout Projection Price action and chart pattern trading:
> A possible local 4-wave triangle pattern with a bullish divergence signal
> A bull scenario with the target downtrend triangle @ 0.5-0.618 fibonanci extension of current minor 3-wave once breakout current price rejection zone previous low.
> Short entry if breakout of triangle for a bear scenario, the target could reach upto 0.786-1.0 extension for the next support zone
Always trade with affordable risk and respect your stoploss, nothing is 100%.
GMT/usdtPrice is in a minor channel and losing the middle line of the price channel has strong demand at the static level, if it breaks that level it makes sense to sell.

GMT - LongGMT has benefited from buying pressure immediate before the announcement of the launch of GMT earnings plan on the 28th of September, but but price fell immediately after.
GMT is currently sitting on an support zone which, if holds, might give a bit of relief to GMT price, pushing it to 0.7 area.
If support doesn't hold, we might see price falling to the next support zone in area 0.59


STEPN GMT price it's time for growth ?Looking at the trading volumes, it seems that everyone trades only BTCUSDT, or everyone is interested in what is happening with the Bitcoin price
Well, here are our thoughts:
But capital is gradually flowing into altcoins, which in turn are also drawing global reversal patterns.
The GMTUSDT price is now in the liquidity zone of accumulation of positions.
A reversal double bottom is likely to form.
The minimum goal of working out this pattern in the area of $2.4. And this is not a little, not a lot x3.5-4 from the current purchase zone $0.56-0.80.
_____________________
Did you like our analysis? Leave a comment, like, and follow to get more


GMT RE-ACCUMULATION nice setup on GMT entries coming soon. chart looks more bullish then some of the others i covered
