STEPN Analysis , GMT Update 📈📉Hello traders, what's going on today ?!
Since 28 May 2022, that I posted the last analysis
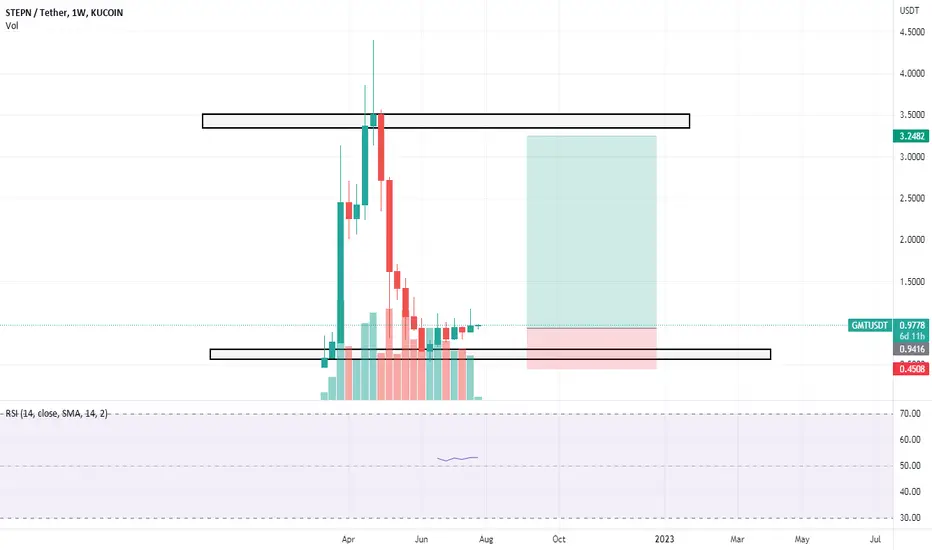
for GMTUSDT , STEPN has been trading in sideway and range zone , also as I expected it reject by higher red zone and lost the pivot zone for a while but rebounced back up one the positive divergence revealed (OBV and WMACD). (more than 50%💰 (1x)short).
SO today as you see in the Daily timeframe for gmtusdt , it seems after a long consolidation phase its ready to jumps over pivot zone ! so in this case you can take short position on the higher key resistance zone with a proper stop-loss!
anyway you also should consider any bearish scenario for gmt , thus although it can rise it short-term , but in my opinion it will correct more in the long-term perspective, so if it losses the curent pivot zone , in this case it may settle on the lower support and demand zone
✌️ Good luck with your trading and investing and remember: Trade smart…OR JUST DON’T TRADE!
--------------------------------------------------------------------------------------------------------------------
👉This analysis is my personal opinion ,not a financial advice ,so do your own research.
💜 if you're fan of my analyses please follow me , give a big thumbs 👍 OR drop a comment 🗯
GMTUSDT trade ideas


GMTUSDTGMT looks like too bulish IMO.
clear ABC Corrective moves printed on chart.
its time to open long trade on gmt.
thanks

wait till price goes back into 0.861and around this range try to buy as much as possible.
We will most

#GMT/USDT is testing resistance zone in 15-Mint TF!#GMT/USDT is testing resistance zone in 15-Mint TF!
Keep an eye on Long/Short position in $GMT

GMT/USDTGMT/USDT
It seems to be in a downward channel and considering the past behavior of currencies, it does not look very good.
It is expected that we will experience a drop of 17 cents.
#GMTUSDT #GMT #BTCUSDT #BTC #ETHUSDT #DOGE #DOGEUSDT

GMT - Selling SignalBYBIT:GMTUSDT
4 Hours trend
-
GMT is struggling around the uptrend.
Open short once the uptrend is broken with a red candle, and setup strategy as below.
-
Targets:
1) 0.8312~0.8021
2) 0.771
3) 0.6388
Stop: 0.9168
RRR: 2.18

GMT/USDT SHORT SCALP SETUP!!Hello everyone, if you like the idea, do not forget to support with a like and follow.
Welcome to this GMT/USDT trade setup.
GMT looks good here for short. Breaks down from the head and shoulder pattern and currently trying to retest the neckline. Open a short position here and add more to the upside.
Entry range:- $0.89-$0.91
Target1:- $0.86
Target2:- $0.82
Target3:- $0.78
Target4:- $0.74
SL:- $0.94
Use leverage 5x-10x
If you like this idea then do support it with like and follow.
Also, share your views in the comment section.
Thank You!

How to avoid✅the BULL trap and make a profit on GMT❓GMT is exit🔻the massive value area of $0.9-1.09 which was the support for the price. Now this value area become a resistance and GMT need to accumulate enough power✅to break it and grow higher.
GMT need to make a pullback to trap the long traders (bulls) and collect all the liquidity of retailers.
📊Preconditions to open a long:
🔥the false breakout of the key level $0.8035. The price start to pump if whales collect enough liquidity to open their longs. Additionally, there is the $0.8-0,82 value area which will be support for the price. So the rebounce is highly possible.
🔥the volume growth - confirmation ✅ of the whales` huge purchases
🔥bullish BTC help reach the targets for GMT
🚩After the false breakout the price start to squeeze to the trendline so it will be the good chance to open a trade with clear sl and tp.
The targets:
1️⃣ $1.165 - key level
2️⃣ $1.35-1.426 - value area
💻Friends, press the "like"👍 button, write comments and share with your friends - it will be the best THANK YOU.
P.S. Personally, I open an entry if the price shows it according to my strategy.
Always do your analysis before making a trade.

GMT inside ascending triangle🔺We can see the price of GMT has created an ascending triangle, I decided to enter a long position on the trendline support. We have tried to breakout this triangle which ended on a bull trap and if price manages to breakout again and close above I think we could move towards higher resistance levels.

GMTUSDT SHARK IN PLAYhark
The Shark pattern is a distinct 5-point reversal structure that was discovered by Scott Carney in 2011. It is similar to the Bat Pattern, except for the C point exceeding the BC leg. It can point to a strong counter-trend move. The potential Reversal Zone (PRZ) is defined by the following harmonic levels: the 0.886 retracement of initial leg and the 1.13 reciprocal ratio of the initial leg. Targets can be various retracements of the CD leg, all the way up to C itself. There are different methods of determining where the stop would go. Some put it beyond the next structure level after the D point, others choose the 1.41 extension of XA.
Conservative traders look for additional confirmation before entering a trade based on an indicator value, a specific candlestick pointing at a reversal or confluence with other methods. The Shark pattern can be either bullish or bearish. It is as effective as other harmonic patterns and a common variation on trading this pattern is to trade the last leg to completion. TradingView has a smart drawing tool that allows users to visually identify this price pattern on a chart.


GMTThe price has broken the upper limit of the bullish flag and is holding above the 50-200 EMA. If the RSI breaks through the middle line, the price will continue the uptrend.

DO YOU Know this BASIC Pattern!!!Hi guys.. I hope you are doing well. Today I am going to share a fundamental and most common pattern that you can see on mostly 15min TF.
Check the chart and trendline. These patterns always result or 90% results in a quick scalp.
But trade this pattern only on support or confirmation of support.
I hope you like this idea. happy trading
NOTE: NOTE: I ma not a financial advisor please do your own research before investing in market.
BYBIT:GMTUSDT


gmtIt is not a buying and selling signal and it is a personal analysis. Any buying and selling is the responsibility of the trader
this is my idea this is my idea berrish pattern
every thing is on fibonacci retrecment points my idea is long

GMTUSDTPERP/BINANECThis is not sure for 80 % and do your search before you enter in this position and you can do with your money whatever you want to do dont forget to follow me. Go with 0X leverage and the stop loss is less than 2% so if this trade loss we will nit less so much but if this trade going right we will take so much
WE WILL SEE A BIG DUMP ON THE CRYPTO SO BE CARFEL AND YOUR ATTANTION THIS DAYS I DONT IF THE CRYPTO WELL COME TO BREAK THE STOP LOSS AND GO OW OR HE WILL GO FROM THIS POINT TO -10%

GMTUSDT | RESISTANCE AHEADGMTUSDT is trading near the falling resistance. The Price action found support at horizontal zone. The trend is bearish. The price action is making lower lows and lower highs.
The bulls need to break the falling trendline and price action must sustain above horizontal resistance. While bears will be active below the horizontal resistance.
Manage your trades accordingly.

BINANCE: GMT/USDTSTEPN bounced up from rising wedge with nice volume and confident. Bitcoin reclaimed 22500 again and whole market will bounce with it and gives us an SCALP opportunity. i will spot buy with below set up.
RSI broken out and Stoch RSI curving up showing good momentum.
🛒 Pair: GMT/USDT 🛒
== SPOT==
⏰ 1401/05/02 ⏰
🕰 24/07/2022 🕰
Duration:
📈 SCALP - SHORT 📈
Ex: Binance
#93
🛒 Buy : 0.97 - 0.98 🛒
👉Sell Targets👈
🎯TP1: 1.06 🥉
🎯TP2: 1.14 🥈
🎯TP3: 1.20 🥇
⛔️ SL: 0.89 by closing H4 below

GMTUSDTPERP/BINANECThis is not sure for 80 % and do your search before you enter in this position and you can do with your money whatever you want to do dont forget to follow me. Go with 0X leverage and the stop loss is less than 2% so if this trade loss we will nit less so much but if this trade going right we will take so much

GMT - Run, BullRun :)Reasons to take long:
⭐️ BTC is bullish
⭐️ Made false breakdown
⭐️ There a lot of trapped bears
⭐️ Slowly squeezing to the trendline
⭐️ 3rd approach
⭐️ Over VWAP
Will enter when price squeezes to the trendline on 5m timeframe, the base will form and the tape will get faster.
If you don't understand the previous sentence, just use swing stop-loss 3-5%
Fix profit by parts:
1% - 1/3
2% - 1/3, stoploss to breakeven
What's left, hold to the maximum
What do you think of this idea? What is your opinion? Share it in the comments📄🖌
If you like the idea, please give it a like. This is the best "Thank you!" for the author 😊
P.S. Always do your own analysis before a trade. Put a stop loss. Fix profit in parts. Withdraw profits in fiat and reward yourself and your loved ones

GMTUSDT Upward channel for scalpersHello everyone
I have prepared a new signal for you, I write every day 10 profitable trades for the Russian and English audience, I think it will not be difficult to like and comment on the idea, your feedback is very important to me Go to the channel there is a lot of useful information.
Fast signal on 15M
The price continues to move in the channel, we buy from the support level and sell from the channel resistance level, everything is simple here, without further ado :)
