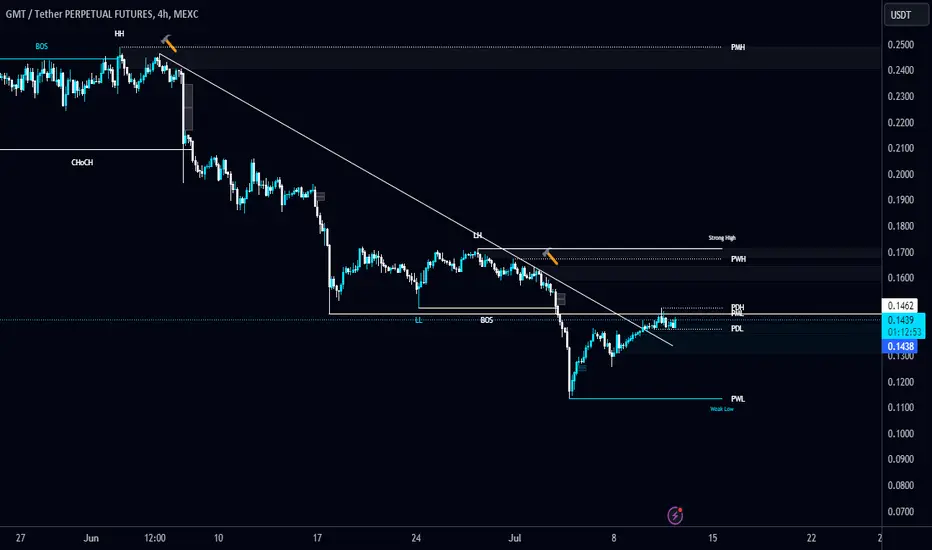
GMTUSDT.PGMTUSDT.P is in bearish trend.
Potentially printing LH and LL.
No sign of reversal here.
Sellers are strongly active .
We wait and watch for the breakout of last LL.
GMTUSDT trade ideas

GMT possible BIG move SoonerHolding at a very nice area.
Longed some here with Little risk(tight stop)
Entry: 0.12112
SL: 0.11900 Flat
Targeting
0.15500
0.19000
Can move strong for next up move targeting the supply area.
Note: Not a Financial advice.

GMTUSDT (GMT), falling to support after accumulationHi everybody. GMTUSDT have more then 500K contracts to short position. Resist level - 0.1356, support level and bears target in near time - 0.129. Levels thanks to x-lines script.
Have a nice trading day

GMT #20x🚀 GMT 🚀
just completed its triple zigzag correction
now impulsive move is about to start
2 targets i'm looking for
TP 1
0.7-0.9$
TP 2
2$
#NFA
#DYOR
Follow for more update
Like+ Follow = appreciation

GMT ANALYSIS (breakout)🔮 #GMT Analysis - Breakout Trading 💰💰
🌟🚀 #GMT was trading in a Ascending Triangle Pattern and here we can see that #GMT gave a great breakout. We can expect a long rally in #GMT if it sustain this breakout.💲💲
🔖 Current Price: $0.1170
⏳️ Target Price: $0.1370
⁉️ What to do?
- We have marked crucial levels in the chart . We can trade according to the chart and make some profits. 🚀
#GMT #Cryptocurrency #Breakout #DYOR


GMT accumulation and distribution zonesWhere to buy and where to sell GMT for middle term? BINANCE:GMTUSDT
Possible Targets and explanation idea
➡️W timeframe finally came in to 27 zone (accumulation zone)
➡️Most negative scenario test 27 level or sweep listing low
➡️Based on market mood now absolutely 0 interest from retail investors
➡️Distribution level will be at 0.23 lvl correction + same time its a M imb
➡️ Crucial level from sellers marked horizontal line
Hope you enjoyed the content I created, You can support with your likes and comments this idea so more people can watch!
✅Disclaimer: Please be aware of the risks involved in trading. This idea was made for educational purposes only not for financial Investment Purposes.
---
• Look at my ideas about interesting altcoins in the related section down below ↓
• For more ideas please hit "Like" and "Follow"!

GMT-LONG-Wyckoff PatternWyckoff Accumulation Phase
The Spring:
This phase is familiar in crypto, especially with altcoins that have bottomed out. It involves a sudden hard test of the low, misleading participants into believing the downward trend is resuming. This is essentially a shakeout or a “swing failure pattern.” It is not always required, but if it occurs, the price should quickly reclaim the prior structural level lost.

GMT Technical Analysis in 3-Day TimeframeHello everyone, I’m Cryptorphic.
For the past seven years, I’ve been sharing insightful charts and analysis.
Follow me for:
~ Unbiased analyses on trending altcoins.
~ Identifying altcoins with 10x-50x potential.
~ Futures trade setups.
~ Daily updates on Bitcoin and Ethereum.
~ High time frame (HTF) market bottom and top calls.
~ Short-term market movements.
~ Charts supported by critical fundamentals.
Now, let’s dive into this chart analysis:
NZX:GMT is in a downtrend and is currently holding support at $0.13. If the current support remains strong, we are likely to see a bullish rally in NZX:GMT very soon.
The RSI shows a rebound from the oversold range, and it is gaining momentum indicating a bullish move on $GMT.
Key levels:
- Support/Accumulation: $0.13 to CMP.
- Trade: Spot.
- Initial Target: $0.3.
- Higher Target: $0.7.
- Invalidation: A close below the support trendline.
DYOR, NFA.
Please hit the like button to support my content and share your thoughts in the comment section. Feel free to request any chart analysis you’d like to see!
Thank you!
#PEACE

GMT LONG GMT currency has returned to its support line, this is a bearish trap and the price will grow BINANCE:GMTUSDT

GMTUSDT Important Levels For Next Cycle - GridHello Dear Traders,
- Important Levels
On the Chart "Horizontal Lines" Based on Gann Square of 9
Works as Support/Resistance. Watch for Price action around those levels
- Jinny Gann Grid
- Vertical lines works as time lines. Expect Reversal around them.
For Today
Support : 0.1129
Resistance :0.172 then .206
Wish you Good Luck Trading.

GMTUSDTHM signal v5.1 (High momentum) spotted. Looking good with previous wave up with increasing volume and momentum.
- Heathy retracement and support well at good level @ 0.14663-0.14768
- Trending slow and steady if able to hold above the support zone
It is at extremely good reward to risk level now if able to hold above the support level.

#GMT/USDT breaks the Diagonal Trendline in 4-Hour TF!#GMT/USDT breaks the Diagonal Trendline in 4-Hour TF!
The volume is declining. NZX:GMT local resistance area is PML $0.1462. #GMTUSDT needs to reclaim this area as a support to turn bullish. Untill then it is bearish.
GMT bottom is in?
I have been tracking the movement of GMT and JASMY for some months and noticed that GMT tend to follow the YASMY's pattern. To illustrate this idea, the both charts are shown for better comparison.
I have started accumulating GMT around the current weekly support level. As long as this support holds, I do not plan to sell. My invalidation condition is a weekly candle closing below $0.125, which represents a 20% dip from the current price. My target price for GMT is $0.16, which would be a x4 increase from the current price.
Disclaimer:
This analysis is based on my personnal views and is not a financial advice. Risk is under your control.


GMTGMT looks undervalued here, with major correction and yet no bull run has happened to it yet
Main target 1.3$
Entry zone: 0.18 - 0.17
Good luck

#GMT Rally Mode: Your Chance to Buy and Prosper!**Technical Analysis Chart Description:**
Welcome to my Technical Analysis charts on TradingView! Before we dive into the analysis, it's essential to understand some important warnings:
1. **Subjectivity Alert:** Technical analysis involves interpreting market data and chart patterns, which can be subjective. Different analysts may interpret the same data differently, leading to varied conclusions.
2. **Historical Performance Doesn't Guarantee Future Results:** Past price movements do not guarantee future price movements. While historical data can provide insights, it's crucial to consider other factors that could influence price action.
3. **Risk of False Signals:** Technical indicators and chart patterns can produce false signals, leading to potential losses if relied upon blindly. Always cross-verify signals with other indicators or fundamental analysis.
4. **Market Volatility:** Crypto markets are highly volatile and can experience rapid price fluctuations. Be prepared for sudden and unexpected price movements, which may invalidate previously identified patterns.
5. **Risk Management:** Proper risk management is essential. Never invest more than you can afford to lose, and consider using stop-loss orders to mitigate potential losses.
6. **Emotional Bias:** Avoid emotional decision-making based on short-term price movements. Stick to your trading plan and strategy, and don't let fear or greed influence your decisions.
**Disclaimer for Crypto Trading:**
Trading cryptocurrencies carries inherent risks, and it's important to understand the following:
Cryptocurrency markets are highly speculative and can be subject to extreme volatility. Prices can fluctuate significantly within short periods, leading to substantial gains or losses.
Investing in cryptocurrencies involves the risk of total loss of capital. Unlike traditional assets, cryptocurrencies are not backed by any tangible assets or central authority, making them inherently risky.
Regulatory uncertainty and market manipulation are additional risks associated with cryptocurrency trading. Regulatory changes or negative news can have a significant impact on prices.
This analysis is for informational purposes only and should not be construed as financial advice. It's crucial to conduct thorough research and consult with a qualified financial advisor before making any investment decisions in the cryptocurrency markets.
By using this analysis, you acknowledge and accept the risks associated with cryptocurrency trading and agree to trade at your own discretion. The author of this analysis shall not be held responsible for any losses incurred as a result of using the information provided.

GMT (SETPN) COLD BE ON THE RISE AGAIN
I called for super bullish market for BINANCE:GMTUSDT sometime last year it happened but not the was I predicted it, however, the chart is becoming clearer for my prediction which brings me to this right now.
I fee STEPN will take off very soon and I love this setup because it give me that deal breaker we don't always get which is the fact that this last move down is an Ending Diagonal of a wave 5 of a wave C which represents the wave 2 if truly this is going to be a bullish market for GMT after all we have only seen 30% retracement from -90% drop from All Time High
Now is the best time to take position while the invalidation level is clearly on the chart (red dotted line) at $0.1758. This presents at least a clean 10 risk reward if it plays out. $0.65 is the nearest target while $2 is not an exception.
PREVIOUS ANALYSIS
OTHER ANALYSIS
BINANCE:ACAUSDT
BINANCE:PEOPLEUSDT
FX:USDJPY
FX:USDJPY

GMT - STEPN - UPDATE
This is an update to the previous analysis. Price will continue to soar higher, taking any of the two path I have highlighted on this chart. One being a 1-2/1-2 situation, price will reach and cross the box, make no significant retracement on the medium timeframe and continue to soar higher while the other being the idea that we are just about to finish an Expanding Diagonal for a wave 1 or A which should end just at the beginning of the yellow box or anywhere in between ($0.24 - 0.26)
Don't forget that since previous analysis BINANCE:GMTUSDT has gained approximately 10%. See below for previous analysis on the higher timeframe for context.
PREVIOUS ANALYSIS
OTHER ANALYSIS
PEOPLE - UPDATE
BINANCE:ARBUSDT
BINANCE:PEOPLEUSDT
BINANCE:RSRUSDT
BINANCE:NEARUSDT

GMT/USDT Breakout Alert | GMT Seems Ready to Rally 👀🚀💎Paradisers, gear up for an exciting trading journey with #GMTUSDT! After a bullish breakout from the descending channel and a successful retest, #GMT is showing formidable strength at the $0.199 support. Now, it’s gearing up for another retest of the falling resistance of the descending channel before moving up.
💎If #GMT fails to maintain its position above the $0.199 support and dips below, we might see an extension of the bearish trend. The subsequent critical demand zone at $0.1858 is known for igniting major bullish rebounds due to its high liquidity.
💎Should NZX:GMT approach this demand zone again, a robust recovery is crucial to uphold the support. Conversely, any inability to recover could amplify bearish pressures, sour market sentiment, and potentially lead to further declines in price.
💎Stay agile and focused, Paradisers. Your ParadiseTeam is closely watching the market to ensure you’re equipped to navigate the unfolding dynamics of the #GMT market.
MyCryptoParadise
iFeel the success

GMTUSDT 8H LONG setup - May 21 2024Possible Long setup for GMT/USDT (8H)
Tight Stoploss: Slightly below 0.2250 (Futures)
Wide Stoploss: 0.2040 (Spot)

GMT clear pathAnother undervalued Gem #GMT
Crystal clear price structure for me here.
Demand zone: 0.18 - 0.17
Sell Zone 1: 1.3 - 1.38
Re-accumulate: 0.4 - 0.5
Good luck

GMT analysis (12H)It seems that our hypothetical diametric ends up on the green range.
We have a good demand range on the chart, which we marked with green color.
We are looking for buy/long positions on the green range.
The targets are clear on the chart.
Closing a daily candle below the invalidation level will violate the analysis.
For risk management, please don't forget stop loss and capital management
When we reach the first target, save some profit and then change the stop to entry
Comment if you have any questions
Thank You
