$GMX/USDT 12h (#Bybit) Rising wedge breakdown and retestGMX (f.k.a. Gambit) lost 100EMA support and got rejected after pulling back to it, bearish continuation would make sense.
⚡️⚡️ #GMX/USDT ⚡️⚡️
Exchanges: Binance Futures, ByBit USDT
Signal Type: Regular (Short)
Leverage: Isolated (4.2X)
Amount: 5.0%
Current Price:
72.890
Entry Zone:
74.345 - 77.445
Take-Profit Targets:
1) 67.335
2) 60.890
3) 54.450
Stop Targets:
1) 83.055
Published By: @Zblaba
TSX:GMX #GMXUSDT #Gambit #Derivatives #DEx
gmx.io
GMXUSDT.PS trade ideas

GMX: Channel BreakoutTrade setup : Bearish breakout from Sideways Channel ($60 - $90). Downside to $40 support. Price is up 70% since we highlighted GMX in Dec 2022 as our “Coin Pick” fundamental research recently highlighted GMX as a big beneficiary of FTX fallout.
Trend : Downtrend on Short- and Medium-Term basis and Neutral on Long-Term basis.
Momentum is Bearish (MACD Line is below MACD Signal Line, and RSI is below 45).
Support and Resistance : Nearest Support Zone is $60, which it broke, then $40. The nearest Resistance Zone is $90.

Proprietary Research Backs Long Position on $GMXToday, I wanted to share an investment recommendation based on my extensive proprietary research and over 100 years of trading experience. I am recommending a long position on $GMX.
After careful analysis and consideration of various factors, I believe that TSX:GMX has significant potential for growth in the coming months. While I cannot disclose the specifics of my research, I have taken into account the company's financial performance, industry trends, and recent developments.
It's important to note that investing in the stock market carries inherent risks, and it is crucial to conduct your own due diligence and consider your risk tolerance before making any investment decisions. Market conditions can change rapidly, and it's essential to stay updated on relevant news and events that may impact your investments.
As always, I encourage you to seek advice from financial professionals or conduct your own research before acting on any investment recommendation. Remember that past performance is not indicative of future results, and diversification is an important strategy to manage risk.
Please keep in mind that my recommendation is based on the information available to me, but the final decision rests with you as individual investors. It's essential to make well-informed choices that align with your investment goals and risk profile.
Thank you for your continued support and trust. I will strive to provide you with valuable insights and recommendations in the future. Wishing you success in your investment journey!

Don't Fade This...Arbitrum Ecosystem play - I expect this to do very well if we're in a bull market.

GMX - V2 Release soon
Why GMX Token is a Must-Buy! 💰📈
Hey, you greedy capitalist! GMX token is an opportunity you simply cannot ignore! 🔥
Let me break it down for you:
GMX utilizes not one, but TWO tokens in its protocol. We've got GMX (governance) and GLP (liquidity) tokens working in harmony.
But here's the real kicker: approximately 80% of the circulating supply is staked! This means that a significant portion of GMX tokens is locked up, creating scarcity and driving up the value. 💎
Now, let's talk about revenue generation.
GMX protocol is a cash machine, generating over $100k in daily fees! But here's where it gets exciting: 30% of those fees go directly to GMX stakers. By simply holding GMX tokens, you're earning a passive income.
And if you're a clever farmer, GLP is your golden ticket to profit. With 70% of the fees pouring into the GLP pool, yield farming becomes a lucrative endeavor.
Now, let's delve into the technicals.
GMX is currently sitting on a daily support level, providing a solid foundation for potential gains. But that's not all – keep an eye out for the bullish RSI divergence. It's a clear sign that momentum is building, indicating an imminent move to the upside. Don't miss the boat! 📈
Furthermore, GMX v2 is already being tested on the testnet, and it's only a matter of time before its release on Arbitrum and Avalanche mainnet. This development can bring increased adoption and drive the token's value even higher.
In summary, GMX is a must-buy for those who are smart and savvy. With limited token supply, significant revenue generation, passive income opportunities, and promising technical indicators, GMX is primed for success.
So, what are you waiting for? Grab those GMX tokens and join the ranks of the smart investors.
The time is ripe for seizing this opportunity! 💰🚀
Disclaimer: Remember to conduct thorough research and consult with professionals before making any investment decisions. This thread is for informational purposes only and should not be considered financial advice. Invest wisely!

#GMX IDEA#GMX IDEA
The coin is a gem, with a beautiful chart. It's a good time to buy and hold for the upcoming bull run season.

GMX: Sideways ChannelTrade setup : Price got rejected again (3x) at $90 resistance level and is likely to revisit $60-$65 support zone. It’s currently consolidating in a Sideways Channel ($60-90). Swing traders could Enter near $60-$65 Channel Support and Exit near $90 Channel Resistance. Price is up 70% since we highlighted GMX in Dec 2022 as our “Coin Pick” fundamental research recently highlighted GMX as a big beneficiary of FTX fallout.
Trend : Downtrend on Short- and Medium-Term basis and Uptrend on Long-Term basis.
Momentum is Bearish but inflecting. MACD Line is below MACD Signal Line and RSI is below 45 but momentum may have bottomed since MACD Histogram bars are rising, which suggests that momentum could be nearing another upswing.
Support and Resistance : Nearest Support Zone is $60, then $40. The nearest Resistance Zone is $90.

#GMXUSDT At Support, MACD Divergence Signals Potential Reversal💎#GMXUSDT has shown promising signs of a potential bullish reversal. After breaking the downtrend trendline, the price found support at the previous supply area, which has now transformed into a demand zone. Additionally, the 200 Moving Average and 50% Fibonacci retracement level are acting as strong support. The MACD has also signaled a bullish divergence, indicating a possible pullback or continuation of the long-term uptrend.
💎Overall, the outlook for TSX:GMX is bullish in the long term, contingent upon the price staying above the current demand area. The upside target of $70.5, marked by a double Fibonacci resistance, looks enticing.
💎On the other hand, if the price breaks and closes below the current Fibonacci support, it may signal a continuation of downside pressure.

short GMXTSX:GMX broke through the ascending trendline and the support level. Decline to support level at 50$ is likely to happen.

GMXUSDTHello there,
*Mars Signals Team wishes you high profits*
This is a one-day-time frame analysis for GMXUSDT
On the top, there is R2 as the long-term resistance area which mention that the price was not able to rise at different points. R1 is a 4-hour resistance area. And S1 and S2 are our long-term support areas of this chart that contain the support of price variously even since the past. As we see in the past, the support of price at S2 made it to have a great rise to higher amounts via being rejected at different points, the price fell down to S1 area after forming three negative Marubozu Candles and touched S1 area. But the existence a hammer candle made the price not to have more fall and at the present, we have the price fluctuating below the first resistance line and we predict it to have some range here and then experience more increase by being supported and providing us more rising signs then. So when the price breaks R1 upward, after being fixed and giving more fluctuation, definitely more rise is there for it to touch R2; as a proper point for saving your profits. Also when the price loses the support and falls below S1, more decline might happen then. S2 would be a great point for putting your sale orders but you should wait for the price to be supported there and on its trend upward and via retesting the situation, you are able to put your orders. Please do not forget to wait for some signs such as confirmation candles in order to make sure of what will be your next movement and then act wisely. Our suggestion is to put your stop-loss point based on your amount of loss that you can risk at and try to experience more logical trades.
Warning: This is just a suggestion and we do not guarantee profits. We advise you to analyze the chart before opening any positions.
Wish you success

GMX shortGMX broke trough the support level. Asset broke trough the ascending trendline. Bearish movement to support level at 68 is possible.

GMX IMPULSE AND CORRECTION MOVEMENT!Hello Traders and everyone, I am Hadi Karaali, Known as SNIPERS_FX
If you like the idea, do not forget to support with a like and follow.
GMX WHAT'S NEXT!
As we can see price is still overall bullish from a long-term perspective, trading inside an outer bigger channel,
Moreover, price is clearly making big impulses then small corrections.
Meanwhile, and for now price is still trading inside this channel and for the bears to kick in we need a break below the marked swing low.
Then as the price will be approaching the lower rising trendline we will be looking for new bullish movements.
If you like this kind of analysis don't forget to like and follow
and as usual follow your trading plan and manage your risk.
Be patient and good luck!
NEW ATH FOR GMXPossible forming a new ath for this coin GMX as it will be moving on to its recent resistance to perform a double top bottom, and a plan sell for this strategy to creates another new lower low.
Trade Responsibly.


GMX IS BULLISHHi, dear traders. how are you ? Today we have a viewpoint to BUY/LONG the GMX symbol.
If it stabilizes on the red range, the target for wave E will be HKEX:102 -115-126.
For risk management, please don't forget stop loss and capital management
When we reach the first target, save some profit and then change the stop to entry
Comment if you have any questions
Thank You

short GMXTSX:GMX bounced off the resistance level. Decline to support level at 75.4$ is likely to happen

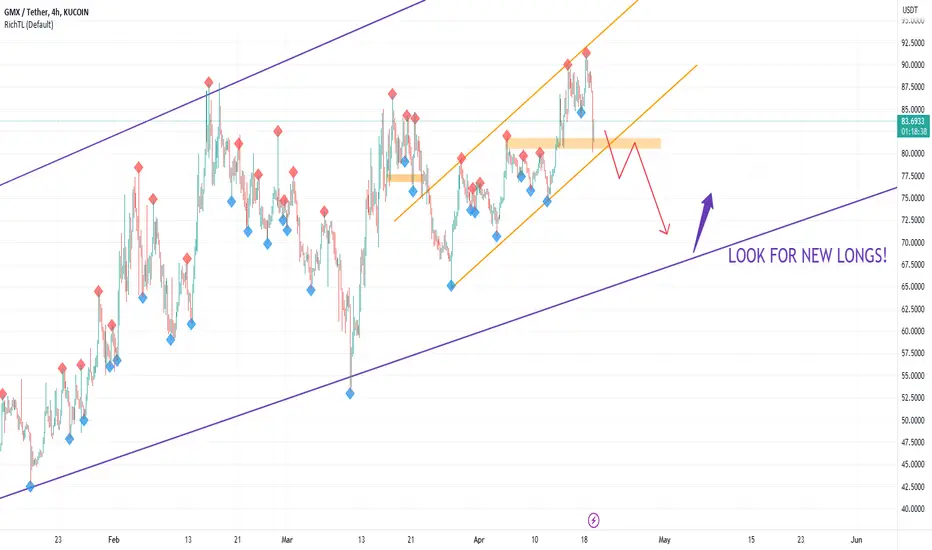
GMX STILL BULLISH!Hello Traders and everyone, I am Hadi Karaali, Known as SNIPERS_FX
If you like the idea, do not forget to support with a like and follow.
GMX WHAT'S NEXT!
As we can see price is still overall bullish from a long-term perspective, trading inside this channel,
Making clean higher highs and higher lows.
So for now, as the price will be approaching our rising trendline we will be looking for new longs as a trend continuation.
And for the correction to start we need a break below the marked swing low, then a movement lower would be expected.
If you like this kind of analysis don't forget to like and follow
and as usual follow your trading plan and manage your risk.
Be patient and good luck!

GMX Big Bullish TriangleThe coin continues to have an upward trend. On the round number 80, a level was formed with a few touches and an ascending triangle, gradually getting closer to the level.

#GMX Waiting for return in Price areaYou should wait for the return to the range of 74 to 76 so that if the trend reversal is confirmed in the price zone, you will enter a buy position.

Profit Potential Ahead: GMX/USDT Chart Analysis Anticipates UpwaProfit Potential Ahead: GMX/USDT Chart Analysis Anticipates Upward Breakout After Brief Dip:-
Greetings traders,
I would like to share my analysis on the #GMX/USDT chart with you all. As of now, the price is hovering around $75.35, and I am anticipating a slight downside move before witnessing an upward breakout.
My first entry point for this trade would be around $71, with a second entry point of $77 following the breakout. I have set my targets at $81.30 and $85, respectively, with a stop loss placed manually at $70 after the entry is filled.
It's essential to note that trading involves some level of risk, and it's crucial to perform your due diligence and assess your risk tolerance before entering any trades.
In conclusion, I believe there is potential for profits to be made in this trade, and I encourage you all to keep an eye on the GMX/USDT chart for any potential trading opportunities.

GMXUSDT APRIL looking promising Ethereum Shanghai is releasing on April 12th and the perpetual DEX narrative seems like is catching eyes for ARPIL. Iiquidity pools will be hotter later this year.
"Ethereum Shanghai" is currently the hot topic in cryptocurrency space with such update, now what is "Ethereum Shanghai" all about?
-As we all know, "Ethereum Merge" update took place earlier in September 2022 and switched the mining process of Ethereum from PoW to PoS. With PoS thousands of investors were able to stake their precious ETH for 3-6% yearly staking rewards, all they were required was 32 ETH initially to stake and lock their ETH for a couple months without being able to move them.
Now, with "Ethereum Shanghai" investors will finally be able to withdraw their precious ETH. So to sum things up, "Ethereum Shanghai" is the upgrade that will allow investors to withdraw the money they are staking.
What will this mean for the price of Ethereum?
- Users have been staking ETH since December 2020 in the Beacon Chain to help secure the exchange by earning rewards. It is thanks to the "Ethereum Shanghai" upgrade those investors will be able to move their money now. It is not necessarily a bearish scenario for Ethereum's price to go down as a result from investors withdrawing their money. However, investors are speculating that Liquid Staking Derivatives(L.S.D :memes_laugh_elon: ) like Lido, Rocketpool, and FXS are going to start attracting all of that money as their staking rewards are seemingly more attractive and offer the option to be able to withdraw their money at any given time.

QUICK SHORT GMX ON M15Hi everyone, Please hit the like button or leave a comment if this can make you some money.
ENTRY - TAKE PROFIT & STOP LOSS ON CHART.

Unstake Your GMXGMX will fall to 60ish range, probably bounce between my rainbow myriad of lines, then go down :))) You should buy around 52 - 60 !
