gmx extremely over sold (easy 400-500% gain)The descending broadening wedge chart pattern is a bullish reversal formation characterized by two sloping and diverging trend lines. This pattern emerges as the price fluctuates between the upper resistance and lower support trend lines, expanding the trading range during a downtrend.
A descending
No news here
Looks like there's nothing to report right now

trading the decending channel for 300% (long)The descending channel pattern (also called the falling channel) is a bearish chart formation. It develops within pronounced downtrends in asset pricing.
Forex traders view descending channels as evidence of weakened strength in the counter currency. Accordingly, it is frequently used to sell a cu

GMXUSDT 30%+ Short opportunity here?I found a possible short opportunity here in one of the largest up-trending tokens in the last 24 hours. You can see by all the previous structure of what I call the EMA (solid red smoothed Heikin Ashi candles) and how the actual price behaves when it break up through the mean. It is short lived (2-

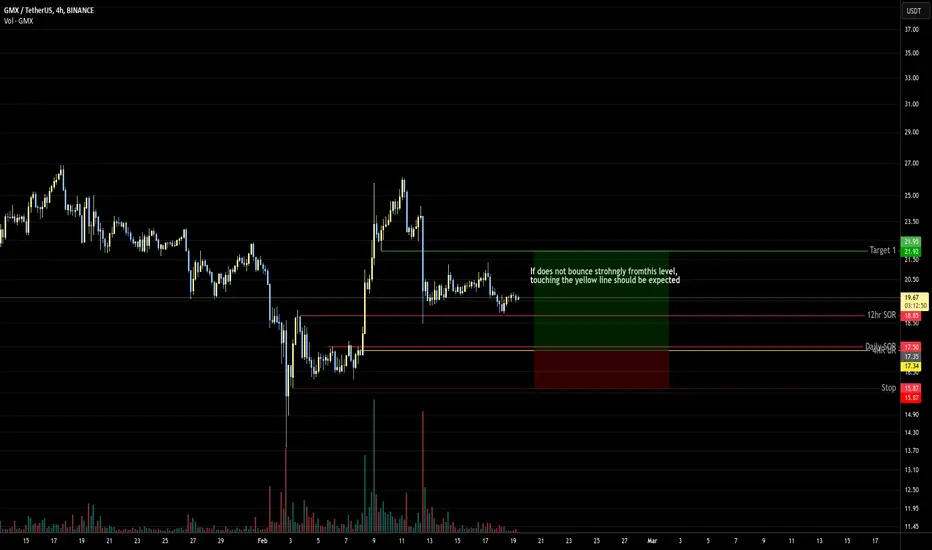
GMX is Still Bearish (12H)From the point where we placed a red arrow on the chart, it appears that GMX has entered a bearish diametric pattern.
It now seems that wave F is nearing completion.
The target is marked on the chart. it could be the green target box. If a daily candle closes above the upper red box, this analysis


GMX/USDTHello friends
Due to the heavy price drop on the indicated support, buyers have provided good support for the price, which has caused a good price growth.
Now you can buy in steps in the indicated support areas.
If you want to be with us in the Alt Season, send us a message.
*Trade safely with

GMXUSDT UPDATEGMXUSDT is a cryptocurrency trading at $15.52. Its target price is $30.00, indicating a potential 90%+ gain. The pattern is a Bullish Falling Wedge, a reversal pattern signaling a trend change. This pattern suggests the downward trend may be ending. A breakout from the wedge could lead to a strong u

GMX/USDT 1W🩸 TSX:GMX ⁀➷
#GMX_IO. Macro chart Another
💯 Intermediate Target - $67
🚩 Macro Target 1 - $94
🚩 Macro Target 2 - $148
🚩 Macro Target 3 - $220
- Not financial advice, trade with caution.
#Crypto #GMX_IO #GMX #Investment
✅ Stay updated on market news and developments that may influence the pric

#GMXUSDT at a Key Level: Reversal Up or Further DropThe BYBIT:GMXUSDT.P price is consolidating after a sharp decline and is currently hovering around $19.870. A breakout above resistance or a drop below support will define the next move.
Two possible scenarios:
🔵 Bullish scenario: Holding above $20.480 activates a long setup towards $22.025.
🔴

See all ideas
Displays a symbol's price movements over previous years to identify recurring trends.
Frequently Asked Questions
GMX / Tether (GMX) reached its highest price on Mar 18, 2023 — it amounted to 83.412 USDT. Find more insights on the GMX price chart.
See the list of crypto gainers and choose what best fits your strategy.
See the list of crypto gainers and choose what best fits your strategy.
GMX / Tether (GMX) reached the lowest price of 0.527 USDT on Aug 15, 2024. View more GMX / Tether dynamics on the price chart.
See the list of crypto losers to find unexpected opportunities.
See the list of crypto losers to find unexpected opportunities.
The safest choice when buying GMX is to go to a well-known crypto exchange. Some of the popular names are Binance, Coinbase, Kraken. But you'll have to find a reliable broker and create an account first. You can trade GMX right from TradingView charts — just choose a broker and connect to your account.
You can discuss GMX / Tether (GMX) with other users in our public chats, Minds or in the comments to Ideas.