$GNC Symmetrical Triangle: Which Way Will It Break?LSE:GNC ($0.00035) is forming a symmetrical triangle on the 4-hour chart, with price nearing the apex. RSI at 58, volume steady. A bullish break above $0.00037 could hit $0.00043; a bearish break below $0.00033 may test $0.00030. Watch closely! #GNC #CryptoAnalysis
GNCUSDT trade ideas

$GNC Volume Surge: Breakout Imminent?LSE:GNC at $0.00035 is seeing a volume spike on the 1-hour chart, with price testing $0.00036. RSI at 61 and MACD trending bullish. A break above $0.00036 could target $0.00041. Support at $0.00033. Enter long with tight stops. #GNC #Trading

$GNC Stochastic Overbought Warning: Pullback RiskLSE:GNC ($0.00035) shows a stochastic oscillator reading of 82 on the 4-hour chart, signaling overbought conditions. Price is near $0.00036 resistance. A pullback to $0.00033 is possible. RSI at 64. Wait for a dip or confirmation above $0.00036. #GNC #Crypto

$GNC Fibonacci Retracement: Key Levels to WatchLSE:GNC ($0.00035) is retracing from a recent high of $0.00038, sitting at the 50% Fibonacci level. Support at $0.00034 (61.8% Fib) looks strong. A bounce could target $0.00040. RSI at 57. Monitor volume for confirmation. #GNC #TechnicalAnalysis

$GNC MACD Bullish Crossover: Time to Buy?LSE:GNC at $0.00035 shows a MACD bullish crossover on the 1-hour chart, with rising buy volume. Price is testing $0.00036 resistance. A break could push to $0.00039. RSI at 59, not overbought. Stop-loss at $0.00033. #GNC #CryptoAnalysis

$GNC Golden Cross Confirmed: Bull Run Ahead?LSE:GNC ($0.00035) just formed a golden cross (50 MA crossing above 200 MA) on the daily chart, a strong bullish signal. RSI at 63 supports upward momentum. Target $0.00040 if volume sustains. Support at $0.00032. Long with caution. #GNC #Bullish #GameFi

$GNC Bollinger Bands Squeeze: Volatility IncomingAt $0.00035, LSE:GNC is trading in a tight Bollinger Bands squeeze on the 4-hour chart, signaling a big move soon. RSI at 60 and rising volume suggest bullish bias. A break above $0.00037 could hit $0.00042. Set stop-loss at $0.00033. #GNC #CryptoTrading

$GNC Testing Key Support: Bounce or Break?LSE:GNC ($0.00035) is hovering near the $0.00034 support on the 1-hour chart, backed by the 50-period MA. Volume is steady, and RSI (55) shows neutral momentum. A bounce could target $0.00038, but a break below $0.00034 may test $0.00032. Watch for a spike in buy volume. #GNC #TechnicalAnalysis

$GNC Consolidation Phase: RSI Divergence Hints at Short-Term CorAnalysis: At $0.00035, LSE:GNC appears to be in a consolidation phase after an initial post-listing pump, as observed on the 1-hour chart. The token is trading within a tight range of $0.00033–$0.00037, with declining volatility suggesting a potential big move soon. A bearish RSI divergence is forming, where the price is making higher highs, but RSI (currently 58) is showing lower highs, indicating weakening momentum. This could lead to a short-term pullback to the $0.00030–$0.00032 support zone, aligning with the 50-period MA. However, the broader trend remains bullish, supported by the GameFi narrative and Greenchie’s engaged community. The MACD indicator shows a bullish crossover, with the signal line above the MACD line, but the histogram is flattening, hinting at a pause in momentum. Post-airdrop distribution (200M GNC) may cause selling pressure from profit-takers, but the 5% airdrop allocation and 36-month vesting for community rewards suggest long-term HODLing incentives. If LSE:GNC holds above $0.00030, a bounce toward $0.00040 is plausible by May 20, 2025.
Key Levels:
Resistance: $0.00037, $0.00040
Support: $0.00032, $0.00030
Action: Wait for a dip to $0.00032 for a low-risk entry or enter long above $0.00037 with a stop-loss at $0.00029. Watch RSI and MACD for trend confirmation. #GNC #GameFi #CryptoAnalysis

$GNC Bullish Breakout Potential: Ascending Triangle Formation SiAnalysis: LSE:GNC , currently priced at $0.00035, is showing signs of a classic ascending triangle pattern on the 4-hour chart, a bullish setup often preceding significant price breakouts. The token has formed higher lows since its Gate.io listing on May 13, 2025, with resistance holding firm around $0.00038. Volume is steadily increasing, suggesting growing buyer interest, especially as the Greenchie Telegram game’s 40,000+ active users fuel community hype. The Relative Strength Index (RSI) is at 62, indicating room for upward movement before entering overbought territory (above 70). A breakout above $0.00038 could target $0.00045, a 28% gain, with support at $0.00032 if a pullback occurs. The 50-period moving average (MA) is trending upward, crossing above the 200-period MA, forming a golden cross—a strong bullish signal. However, traders should watch for a potential fakeout if volume doesn’t sustain the breakout. With the HODLer Airdrop ending May 13, 2025, increased liquidity from 200M GNC rewards could drive volatility.
Key Levels:
Resistance: $0.00038, $0.00045
Support: $0.00032, $0.00028
Action: Consider a long position on a confirmed breakout above $0.00038 with a stop-loss below $0.00032. Monitor volume and RSI for confirmation. #GNC #TechnicalAnalysis #Bullish

GNC/USDT: High Volatility Play – Scalping Opportunities Ahead?With 382B GNC traded in 24H, this low-cap gem is ripe for scalping. Key levels:
Buy Zone:
0.00040
–
0.00040–0.00045
Take-Profit: $0.00085
Stop-Loss: Below $0.00030
GNC/USDT: Critical Support Test After Sharp Decline – Bounce or GNC is testing key support at $0.00025778 after a -44% drop. A hold here could trigger a short-term rebound, but a breakdown may lead to further downside. MACD shows weak bullish momentum—watch for confirmation.

GNC Price Prediction: Experts Weigh In on Future Trends"Analysts debate: Will GNC retest ATH or drop further? DYOR before trading.

GNC: Early Market Sentiment – Bullish or Bearish?Social chatter suggests mixed feelings. Will the price follow sentiment?

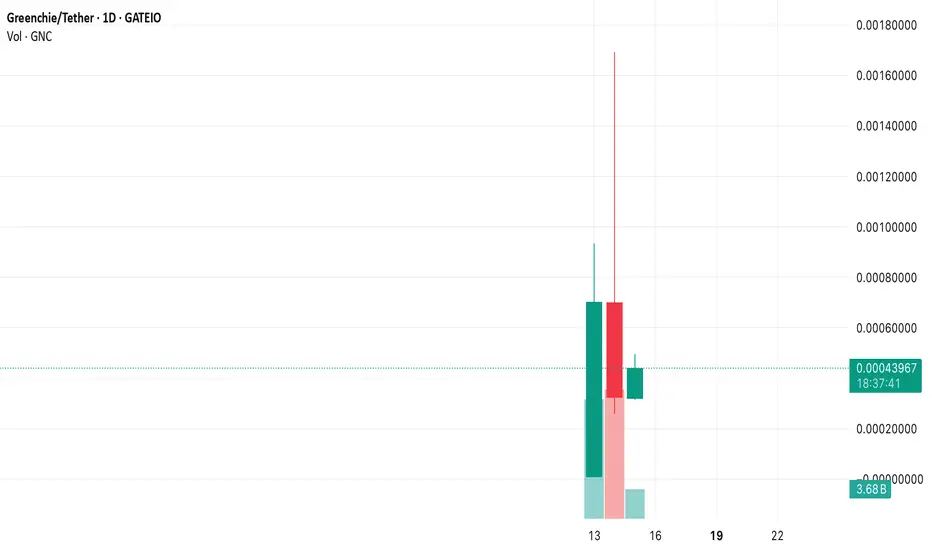
GNC/USDT Technical Analysis: Is a Reversal Coming After -44% DroGNC, newly listed on Gate.io, has seen extreme volatility, currently trading at $0.00041883 (-44.55%). Key levels to watch:
Support: $0.00025778 (24H low)
Resistance:
0.00085169(mid),0.00135670 (strong)
Technical Indicators:
MACD (12,26,9): Shows slight bullish divergence (MACD: 0.00000958).
Moving Averages: MA5 (
0.00040670)aboveMA10(0.00036862) suggests short-term bullish momentum.
Volume: 382.38B GNC traded in 24H ($1.77M USDT), indicating strong interest.
Outlook:
If GNC holds above
0.00040
0.00040,aretestof0.00085169 is possible. However, failure to break resistance could lead to further downside. Trade with caution—high risk, high reward.

GNC 24H Trading Volume Hits $1.77M – Is This the Next Big Thing?High volume suggests strong interest. Will GNC pump further? Keep an eye on the charts.

GNC/USDT: Key Support & Resistance Levels to WatchSupport: 0.00025778∣Resistance:0.00169338. Breakouts could signal the next big move.

GNC Price Analysis: Can It Recover After -44% Drop?After a sharp decline, GNC is trading at $0.00041883. MACD shows slight bullish divergence—time for a reversal?

GNC: A New Contender in the Crypto Market – Now on Gate.ioWith a 24H volume of 382.38B GNC ($1.77M USDT), GNC is making waves. Will you buy the dip?

GNC Trading Goes Live – Check the Latest Charts!GNC is now tradable on Gate.io. Current price: $0.00041883 (-44.55%). Will it rebound? Follow the updates!
