bearish(short)Hiii Guys👦
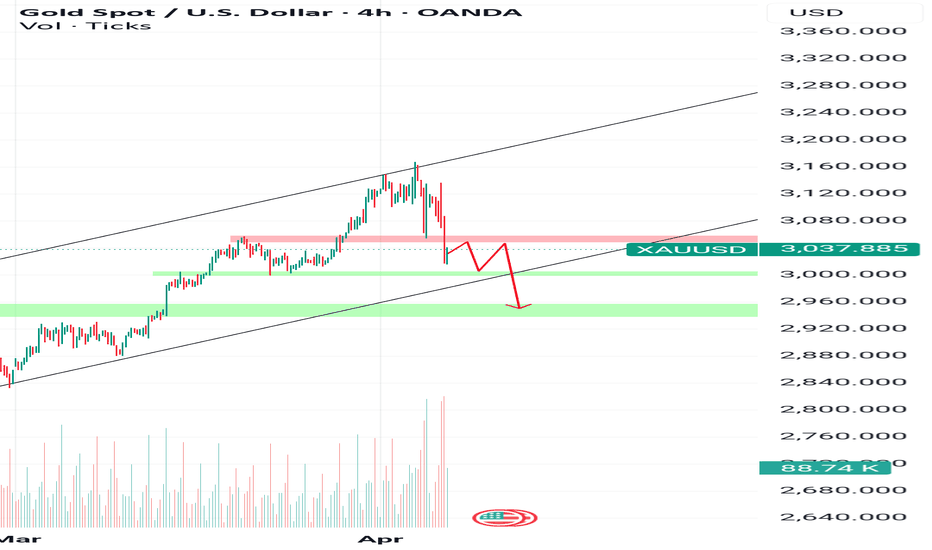
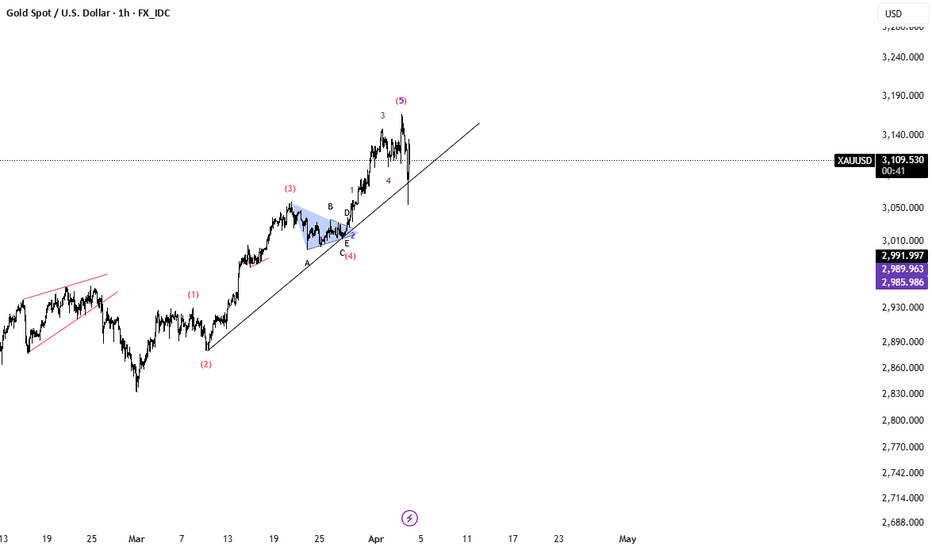
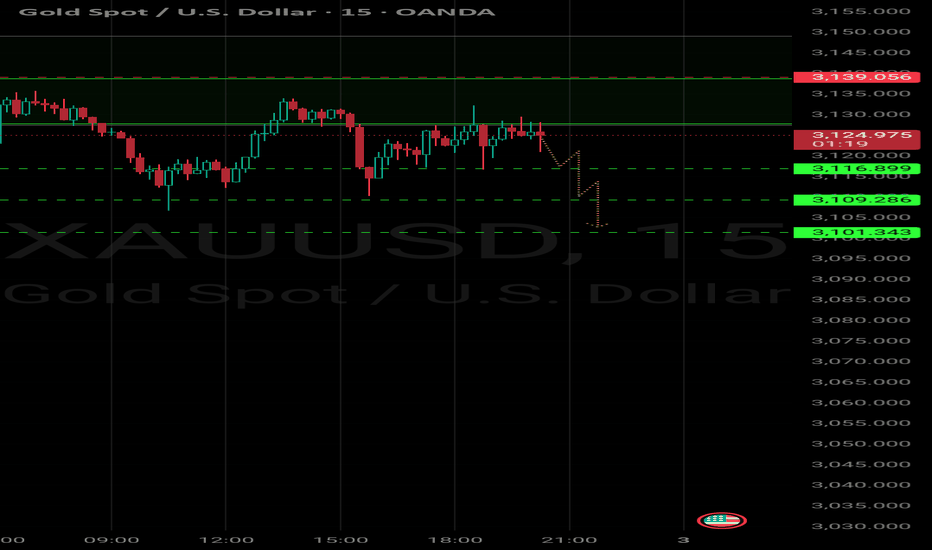
Based on Thursday and Friday's candlesticks, it seems that the market's upward momentum has waned and it seems that the bears have come to take over the market.
And now my idea
I think the best price to enter a sell position is around 3049-3060 with a target of 2970-2980 and even 2950.
If this analysis fails, the analysis will be updated quickly. Of course, I hope it is not wrong.
GOLD.PRO.OTMS trade ideas
GOLD MARKET OUTLOOK – Investor Panic After Fake News🟡 GOLD MARKET OUTLOOK – Investor Panic After Fake News, Bearish Bias Remains
📉 Current Strategy: Focus on SELL setups at key resistance zones – short-term bearish outlook remains valid
📌 US Session Recap:
Gold saw a sharp sell-off after a fake news report circulated about the US delaying its planned tariff policy.
→ While the White House later confirmed it was misinformation, the damage was done — panic selling hit across global markets.
💥 As a result, gold dropped aggressively and reached the 295x zone, aligning perfectly with AD’s previous short bias.
Meanwhile, US equities also continued to bleed red.
🧠 Market Sentiment: “Cash is King” is Back
With global instability and fear on the rise:
🔹 Investors are hoarding cash
🔹 USD demand increases, along with inflows into US government bonds
🔹 Risk assets like gold, stocks, and crypto are being dumped
💡 This could be part of Trump’s larger play — forcing global capital to flow back into US Treasuries while applying pressure on speculative markets.
🔮 AD’s View:
Unless we see a clear shift in investor sentiment, the base case remains: → Sell rallies through midweek, then reassess.
🧭 Key Technical Zones to Watch:
🔺 Resistance: 3005 – 3016 – 3035 – 3056 – 3076
🔻 Support: 2980 – 2969 – 2956 – 2930 – 2912
🎯 TRADE PLAN:
🟢 BUY ZONE: 2930 – 2928
SL: 2924
TP: 2934 – 2938 – 2942 – 2946 – 2950
🔴 SELL ZONE: 3034 – 3036
SL: 3040
TP: 3030 – 3026 – 3022 – 3018 – 3014 – 3010 – ???
📌 Keep an Eye on DXY:
The US Dollar Index is currently testing a major 3-year support level.
→ If equities fail to recover and fear persists, DXY could bounce — and gold would likely continue its correction lower.
⚠️ Final Note:
We’re in a highly volatile and uncertain environment.
→ Stick to the plan. Respect your SL/TP levels. Avoid emotional decisions.
—
📣 Found this perspective useful? Follow for daily macro-backed trade ideas and real-time market structure breakdowns.
Clarity. Consistency. Risk Management.
— AD | Money Market Flow
Gold Rejects Channel Highs — Retracement to $3,000 Before HigherGold has printed another clean rejection at the upper boundary of a short-term ascending channel on the 6H timeframe. This latest rejection adds further validity to the structure, suggesting that we may now see a healthy technical pullback toward the equilibrium line of the channel — and potentially down to the lower support boundary near the $3,000 psychological level.
Technical Outlook:
Another rejection from channel resistance confirms structural validity.
1:4 risk-to-reward short opportunity with clear invalidation and confluence.
Targets:
– TP1: $3,005 — channel midline + psychological level
– TP2: $2,955 — previous swing high + dynamic quarterly support
$3,000 psychological levels are often retested before continuation.
Fundamentals & Geopolitical Context (as of April 1, 2025):
Gold's Macro Bull Trend Remains Intact
Despite this short-term setup, the broader macro backdrop continues to support gold:
– Central banks accumulating gold amid global de-dollarization
– Real yields remain negative across key regions
– Oil trading above $100 fuels inflationary pressure
Geopolitical Flashpoints Supporting Volatility
– Russia-Ukraine war shows no signs of easing
– Middle East tensions rising (Israel–Hezbollah conflict)
– Taiwan-U.S.-China escalation continues post-military exercises
Bitcoin Weakness = Gold Rotation Potential
– BTC struggling at $70K, showing early signs of distribution
– Miner pressure increasing ahead of halving
– Targeting possible correction to $50K = capital rotation into gold
Conclusion:
Technical rejection at resistance aligns with macro expectations of a short-term pullback.
$3,000 key psychological level likely to be retested before further upside.
Gold remains in a macro bull market; this move is likely corrective within a larger expansion leg.
Long Term Gold Bull Target $4,200:
Previous Long (Target hit and closed at $3,100):
Previous Intra Long (Target hit and closed at $3,100):
Gold short-term analysis and signalsOn the daily chart, gold started the downward adjustment mode on Tuesday, breaking the previous continuous rise in one fell swoop. However, the current moving average system still maintains an upward divergent shape. The 4-hour chart of gold maintains a high range of fluctuations. At present, the short-term moving average is basically in a state of adhesion and flattening. It is highly likely to continue to maintain a high-level oscillation trend during the day.
The 1-hour moving average of gold is still golden cross upward, with a bullish divergent arrangement. Although gold fell below the moving average support yesterday, the strength of gold bulls to bottom out and rebound is still relatively strong, and coupled with the support of gold safe-haven, the bulls will eventually dominate. As long as it does not fall below 3100, it will continue to be strongly bullish.
After the announcement of the tariff policy, the risk aversion sentiment of gold has escalated, and gold has broken upward again. Then the previous resistance of gold has now become support again. The previous platform support of gold, 3135, has broken upward, so gold has now formed support at 3135. Gold will continue to buy in the Asian session. After the sideways fluctuation, gold bulls once again exerted their strength under the stimulation of risk aversion, so they will continue to trade with the trend.
Gold's 1-hour moving average turned upward again, and the bulls regained control of the main field. If gold falls back to the previous platform support of 3135 in the Asian session, it can continue to buy on dips. Now the risk aversion sentiment stimulates the rise of gold. Don't chase the highs directly for the time being, and wait patiently for opportunities after the decline.
Key points:
First support: 3140, second support: 3133, third support: 3120
First resistance: 3166, second resistance: 3174, third resistance: 3187
Operation ideas:
Buy: 3132-3135, SL: 3124, TP: 3150-3160;
Sell: 3174-3177, SL: 3185, TP: 3150-3140;
Gold (XAU/USD) Intraday AnalysisGold is currently trading within a narrow range between 3018 and 3040, reflecting clear indecision in the market. This sideways consolidation suggests neither buyers nor sellers are fully in control, with price temporarily caught in a holding pattern.
Key levels to watch:
• Potential buys above 3042: A confirmed break and hold above this level could open the door toward 3052 and beyond, especially if momentum kicks in. This area may attract breakout traders eyeing continuation toward previous highs.
• Potential sells below 3018: A clean breakdown under this support could trigger sharp downside, targeting levels around 3010 or even 3000 depending on follow-through volume and sentiment.
For now, price is respecting both edges of the range. Be cautious of fakeouts near the boundaries—wait for confirmation and clean structure before jumping in. Ranging conditions like this often precede significant moves, so staying patient could pay off big.
XAUUSD: Swaying for Momentum - Awaiting Bullish SignalAfter the sharp drop to the 2,968 zone, gold bounced back like a fighter who got knocked down but still has the strength to stand up. Currently, gold prices are "swaying" in the 2,998 - 3,057 range, with the EMA 34 and 89 acting like a cushion, preventing prices from falling freely once again.
The H4 chart shows prices struggling to find momentum within the accumulation zone, still undecided whether to move up or down. Keep an eye on the 3,116 resistance zone. If the price breaks through, it’s likely to continue climbing, but beware, this zone could easily become a "trap" for buyers.
And don’t forget the upcoming CPI news! If CPI data comes out higher than expected, the USD may strengthen, pushing gold down a bit. On the other hand, if the data is softer, gold might have the excuse to bounce back up.
Gold is reaching the bubble's picotopThe gold market has been really crazy. Do you know that currently, gold is worth an equal amount to the entire M2 money supply of US dollars? When adjusted for CPI, its considered by some measures to be more expensive than any other time in history. Google search trends worldwide for the term "Buy gold" are now at record levels. Everyone is buying gold because they think that tariffs, inflation, war, and a potential recession are good for it. They are all completely wrong. Every time the stock market has crashed, gold crashed too, although sometimes like this time it lags behind slightly.
The trading strategy now is to wait for a sharp drop and short heavily with puts when the momentum is staring to turn on the bears favor. I think a final liquidity sweep is still likely in this distribution here before a very serious multi-decade correction gets going fully.
CHECK XAUUSD ANALYSIS SIGNAL UPDATE > GO AND READ THE CAPTAINBaddy dears friends 👋🏼
(XAUUSD) trading signals technical analysis satup👇🏼
I think now (XAUUSD) ready for(SELL )trade ( XAUUSD ) SELL zone
( TRADE SATUP) 👇🏼
ENTRY POINT (3120) to (3118) 📊
FIRST TP (3125)📊
2ND TARGET (3131) 📊
LAST TARGET (3137) 📊
STOP LOOS (3110)❌
Tachincal analysis satup
Fallow risk management
DeGRAM | GOLD broke the upward structureGOLD is in an ascending channel between trend lines.
The price has already reached the lower boundary of the channel, the lower trend line and the support level, which has already acted as a rebound point.
The chart has broken the ascending structure, but a descending top must now be formed to continue the decline.
On the 1H Timeframe, the indicators are forming a bullish convergence.
We expect XAUUSD to rebound after consolidating above the important psychological level of $3000.
-------------------
Share your opinion in the comments and support the idea with a like. Thanks for your support!
Gold's Soaring Bull Market: How to Capitalize on the UptrendRecently, the bulls have been surging and hitting new highs repeatedly. In this turbulent upward trend, have you successfully ridden the wave and reaped substantial profits, or have you encountered obstacles at every turn on the investment path? Regardless of your past gains and losses, there is hope to achieve an investment breakthrough with the help of Jhon.
Currently, the gold market is performing strongly, with large bullish candlesticks emerging one after another, and the daily candlestick chart also closes in the green. Gold is heading towards the $3200 mark, and it is only a matter of time before this threshold is broken through. The moving averages are diverging upwards, and the slope continues to rise. The candlestick chart has a lower shadow, all of which are typical bullish signals.
During this period, every time gold experiences a slight pullback, it is quickly engulfed by large bullish candlesticks, indicating that the bullish trend is solid. Therefore, today we maintain the strategy of going long on dips. When the price retraces to around the support level of 3110, we can place a long position. If the market strengthens and this level is not reached, we can consider going long near the low point of around 3120.
XAUUSD
buy@3110-3120
tp:3140-3150-3160
I will share trading signals every day. All the signals have been accurate for a whole month in a row. If you also need them, please click on the link below the article to obtain them.
$XAUUSD GOLDGold is putting on his best performance in the last few years.
In these phases, very often we can see an acceleration of movement
I also don't rule out the possibility that we break the channel up.
Gold remains a protective asset, and I want to say that this is not the top yet; now, every correction is a new entry point.
The question is, where will it be?
We will break this upward channel from below, stay under it for a while, and then go for new tops.
Now that all amateurs are convinced that everything is moving in the channel, we will break the channel down, and we need to go short. At the expense of these short positions, we will update the ATH. In 2025, I think it would be too easy.
Best regards EXCAVO
_____________________
Disclosure: I am part of Trade Nation's Influencer program and receive a monthly fee for using their TradingView charts in my analysis.
Closing all my orders with Profit / time for correctionAs discussed throughout my yesterday's session commentary: "My position: My Medium-term Buying orders (#3 Buying orders from / engaged at #3,052.80 benchmark breakout) each #3.5 Volume are currently on excellent Profit as I will look to close them as near as #3,152.80 benchmark. On the other hand, I am successfully Buying every dip lately and my last order was yesterday's session #3,110.80 Buy which was closed in Profit. Keep Buying every dip as I advised many times on my recent remarks."
I have closed all of my Medium-term Buying orders (#3,052.80 - #3,133.80) on excellent Profit as I re-Sold Gold throughout yesterday's session (#3,124.80 - #3,009.80).
Technical analysis: The Price-action was once again seen Trading below the #3,152.80 benchmark extended decline where Sellers should finally prevailed and dragg the Price-action more than #57 points downwards (as was announced on one of my remarks lately that Gold always prints #57 point decline once the local High’s rejects the sequence and delivers the eminent rebound). Gold is dangerously approaching again the Higher High’s trendline of the Daily chart’s wide Ascending Channel, way above the #MA50 (aswell on Daily chart, representing in the same manner the Long-term Support zone) in Overbought waters, however every pullback on Gold is accumulation zone for new Bullish cycle.
My position: Even though I am Buying Gold aggressively, I do expect pullback to be delivered due Overbought instruments and #3,100.80 benchmark test possibility.
XAU/USD - H1 Chart - Trendline Breakout (27.03.2025)The XAU/USD pair on the H1 timeframe presents a Potential Buying Opportunity due to a recent Formation of a Breakout Pattern. This suggests a shift in momentum towards the upside and a higher likelihood of further advances in the coming hours.
Possible Long Trade:
Entry: Consider Entering A Long Position around Trendline Of The Pattern.
Target Levels:
1st Resistance – 3051
2nd Resistance – 3065
🎁 Please hit the like button and
🎁 Leave a comment to support for My Post !
Your likes and comments are incredibly motivating and will encourage me to share more analysis with you.
Best Regards, KABHI_TA_TRADING
Thank you.
GOLD DAILY CHART MID/LONG TERM UPDATEHey Everyone,
This is an update on our daily chart idea that we are now tracking for a while now. If you have only started following us, please read the updates below at the bottom from previous weeks to see how effectively we have been tracking this.
Now after completing the target to the channel top we stated that if we see ema5 lock outside the channel then we will look for support outside the channel on the channel top for a continuation, which played out perfectly, as the channel top after the breakout provided support for a continuation.
We then stated and expected price to play between 3052 and 3007 until we see a break to confirm our next range. We got the test on 3007 with no body close or ema5 lock, which confirmed the rejection and the bounce perfectly into 3052, which then followed with the body close above 3052 opening the range above, giving a nice clean run of over 300 pips. Gap remains open and ema5 lock will only further confirm this but we are happy with the run already and will now continue to buy from dops only.
This is the beauty of our Goldturn channels, which we draw in our unique way, using averages rather than price. This enables us to identify fake-outs and breakouts clearly, as minimal noise in the way our channels are drawn.
We will use our smaller timeframe analysis on the 1H and 4H chart to buy dips from the weighted Goldturns for 30 to 40 pips clean. Ranging markets are perfectly suited for this type of trading, instead of trying to hold longer positions and getting chopped up in the swings up and down in the range.
We will keep the above in mind when taking buys from dips. Our updated levels and weighted levels will allow us to track the movement down and then catch bounces up using our smaller timeframe ideas.
Our long term bias is Bullish and therefore we look forward to drops from rejections, which allows us to continue to use our smaller timeframes to buy dips using our levels and setups.
Buying dips allows us to safely manage any swings rather then chasing the bull from the top.
Thank you all for your likes, comments and follows, we really appreciate it!
Mr Gold
GoldViewFX
OLD UPDATES ON THIS CHART IDEA
MARCH 23RD WEEK UPDATE
The half line of our unique channel gave the perfect bounce into the next axis target at 2904, inline with our plans to buy dips just like we stated. We now have a body close once again with ema5 cross and lock above 2904 leaving the range above open. We will continue to look for support at the ascending half-line of the channel, as we climb into the range.
PREVIOUS WEEKS UPDATE
After completing our Bullish targets we stated that the channel top will act as resistance confirmed with ema5 rejection. A break of the channel top with ema5 would confirm a continuation and failure would confirm rejection. This allowed us to identify true breakouts against fake outs.
We also stated that we need to keep in mind the channel half line below to establish floor to provide support for the range, should we continue to track further up. A break below the half line will open the lower part of the channel to establish floor on the channel bottom. The safest way to track this movement is by buying dips.
- Once again this played out perfectly as we got the rejection on the channel top followed with the channel half line test, which gave the perfect bounce like we stated. We will now either look for a continuation from this bounce or a cross and lock below the half line for a break into the lower channel floor.
Gold (XAUUSD) Buy Opportunity with Target at 3,138This 1-hour gold chart (XAUUSD) shows a possible buying opportunity around the support zone. The price has rejected this level three times, indicating strong support. The price action suggests a rounding bottom formation, with a potential upside move toward the resistance zone near 3,138. A breakout above this resistance could push the price higher, possibly testing the weekly high. However, if the support fails, a downside move could follow. Keep an eye on volume and confirmation signals before entering a trade.
Take Profit Levels:
TP1: 3,125 (minor resistance and reaction zone).
TP2: 3,138 (main resistance target).
TP3: 3,150+ (weekly high if momentum continues).
Always monitor price action and volume confirmation for validation.
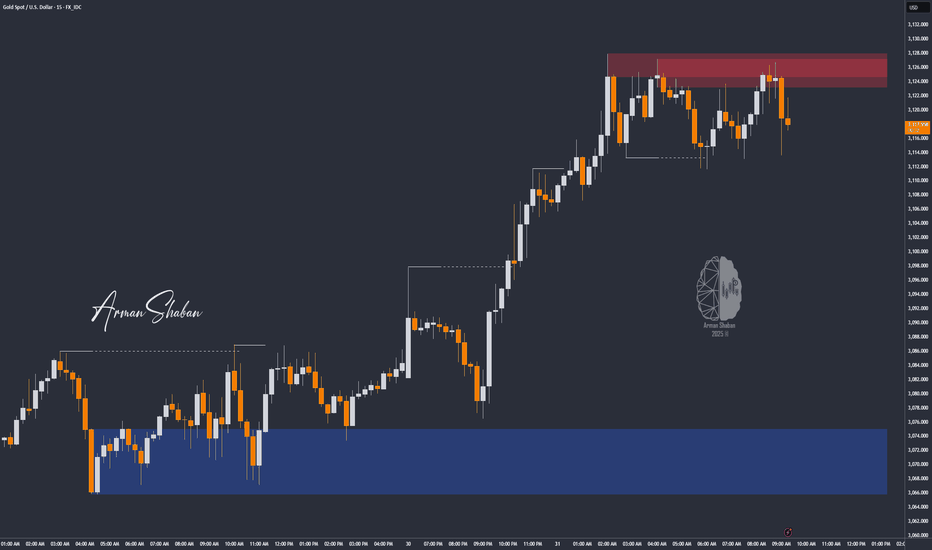
XAU/USD: Bull or Bear? (READ THE CAPTION)By analyzing the gold chart on the 15-minute timeframe, we can see that after the market opened today, a price gap appeared. Once gold filled this gap, it resumed its bullish move and recorded a new all-time high at $3,128. Currently, gold is trading around $3,119, and if the price stabilizes below $3,120, we may see a slight correction.
However, note that there’s been no new structural break on the higher timeframes, so for a more accurate outlook, we need to wait for the price to react to key levels.
This analysis will be updated with your continued support, as always!
Please support me with your likes and comments to motivate me to share more analysis with you and share your opinion about the possible trend of this chart with me !
Best Regards , Arman Shaban


