Unpopular opinion.Unpopular opinion.
Gold versus Silver ratio could be going up much higher.
Historical Paradigm Shift Breakout Line
Gold Standard Abolished
above inclining 12
year moving average
GOLD.PRO.OTMS trade ideas

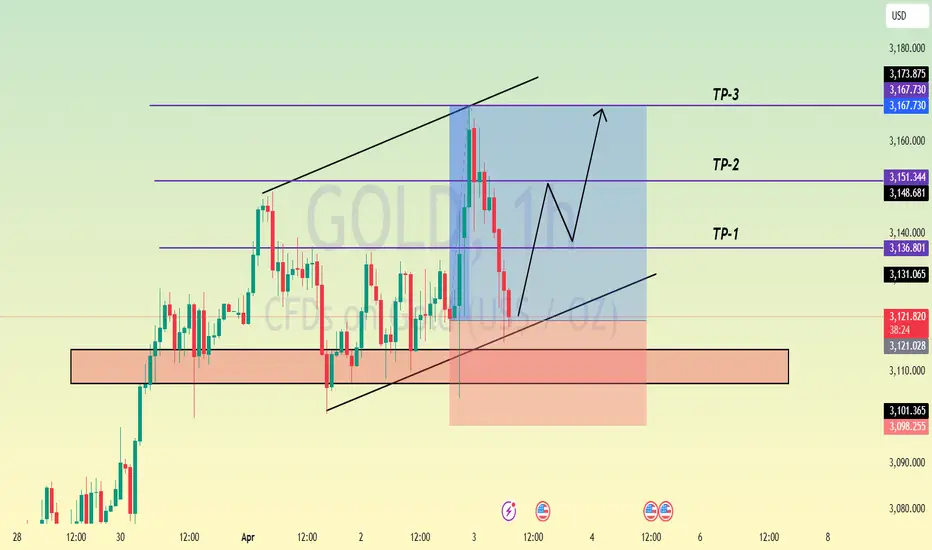
Gold Trade Plan 02/04/2025Dear Traders,
Gold still Bullish and i expect price will be Try to Make New ATH ,
Today Resistance Area : 3145 , 3170
Today Support Area : 3113 , 3090 , 3060
I dont Recommend Trade Today 2 April ( Trump Speak )
If you enjoyed this forecast, please show your support with a like and comment. Your feedback is what drives me to keep creating valuable content."
Regards,
Alireza!

XAUUSD H1 | Bearish fall in the short termBased on the H1 chart analysis, we can see that the price has just reacted off our sell entry at 3150.56, which is a pullback resistance.
Our take profit will be at 3132.63, a pullback support level.
The stop loss will be placed at 3168, which is a swing high resistance level.
High Risk Investment Warning
Trading Forex/CFDs on margin carries a high level of risk and may not be suitable for all investors. Leverage can work against you.
Stratos Markets Limited (fxcm.com/uk):
CFDs are complex instruments and come with a high risk of losing money rapidly due to leverage. 63% of retail investor accounts lose money when trading CFDs with this provider. You should consider whether you understand how CFDs work and whether you can afford to take the high risk of losing your money.
Stratos Europe Ltd (fxcm.com/eu):
CFDs are complex instruments and come with a high risk of losing money rapidly due to leverage. 63% of retail investor accounts lose money when trading CFDs with this provider. You should consider whether you understand how CFDs work and whether you can afford to take the high risk of losing your money.
Stratos Trading Pty. Limited (fxcm.com/au):
Trading FX/CFDs carries significant risks. FXCM AU (AFSL 309763), please read the Financial Services Guide, Product Disclosure Statement, Target Market Determination and Terms of Business at fxcm.com/au
Stratos Global LLC (fxcm.com/markets):
Losses can exceed deposits.
Please be advised that the information presented on TradingView is provided to FXCM (‘Company’, ‘we’) by a third-party provider (‘TFA Global Pte Ltd’). Please be reminded that you are solely responsible for the trading decisions on your account. There is a very high degree of risk involved in trading. Any information and/or content is intended entirely for research, educational and informational purposes only and does not constitute investment or consultation advice or investment strategy. The information is not tailored to the investment needs of any specific person and therefore does not involve a consideration of any of the investment objectives, financial situation or needs of any viewer that may receive it. Kindly also note that past performance is not a reliable indicator of future results. Actual results may differ materially from those anticipated in forward-looking or past performance statements. We assume no liability as to the accuracy or completeness of any of the information and/or content provided herein and the Company cannot be held responsible for any omission, mistake nor for any loss or damage including without limitation to any loss of profit which may arise from reliance on any information supplied by TFA Global Pte Ltd.
The speaker(s) is neither an employee, agent nor representative of FXCM and is therefore acting independently. The opinions given are their own, constitute general market commentary, and do not constitute the opinion or advice of FXCM or any form of personal or investment advice. FXCM neither endorses nor guarantees offerings of third-party speakers, nor is FXCM responsible for the content, veracity or opinions of third-party speakers, presenters or participants.

Could the Gold rebound from here?The price has reacted off the pivot and could potentially rise to the 1st resistance.
Pivot: 2,955.87
1st Support: 2,925.35
1st Resistance: 3,054.56
Risk Warning:
Trading Forex and CFDs carries a high level of risk to your capital and you should only trade with money you can afford to lose. Trading Forex and CFDs may not be suitable for all investors, so please ensure that you fully understand the risks involved and seek independent advice if necessary.
Disclaimer:
The above opinions given constitute general market commentary, and do not constitute the opinion or advice of IC Markets or any form of personal or investment advice.
Any opinions, news, research, analyses, prices, other information, or links to third-party sites contained on this website are provided on an "as-is" basis, are intended only to be informative, is not an advice nor a recommendation, nor research, or a record of our trading prices, or an offer of, or solicitation for a transaction in any financial instrument and thus should not be treated as such. The information provided does not involve any specific investment objectives, financial situation and needs of any specific person who may receive it. Please be aware, that past performance is not a reliable indicator of future performance and/or results. Past Performance or Forward-looking scenarios based upon the reasonable beliefs of the third-party provider are not a guarantee of future performance. Actual results may differ materially from those anticipated in forward-looking or past performance statements. IC Markets makes no representation or warranty and assumes no liability as to the accuracy or completeness of the information provided, nor any loss arising from any investment based on a recommendation, forecast or any information supplied by any third-party.

Gold Has Pulled BackGold has been in an uptrend this year, and some dip buyers may see an opportunity in its latest pullback.
The first pattern on today’s chart is the series of higher highs and higher lows since January. XAUUSD has dipped to the bottom of that rising channel. Will it become another higher low?
Second, the pullback stabilized near the February high around 2956. That could suggest old resistance has become new support.
Third, stochastics dipped to an oversold condition.
Finally, the 50-day simple moving average is rising from below.
TradeStation has, for decades, advanced the trading industry, providing access to stocks, options and futures. If you're born to trade, we could be for you. See our Overview for more.
Past performance, whether actual or indicated by historical tests of strategies, is no guarantee of future performance or success. There is a possibility that you may sustain a loss equal to or greater than your entire investment regardless of which asset class you trade (equities, options or futures); therefore, you should not invest or risk money that you cannot afford to lose. Online trading is not suitable for all investors. View the document titled Characteristics and Risks of Standardized Options at www.TradeStation.com . Before trading any asset class, customers must read the relevant risk disclosure statements on www.TradeStation.com . System access and trade placement and execution may be delayed or fail due to market volatility and volume, quote delays, system and software errors, Internet traffic, outages and other factors.
Securities and futures trading is offered to self-directed customers by TradeStation Securities, Inc., a broker-dealer registered with the Securities and Exchange Commission and a futures commission merchant licensed with the Commodity Futures Trading Commission). TradeStation Securities is a member of the Financial Industry Regulatory Authority, the National Futures Association, and a number of exchanges.
TradeStation Securities, Inc. and TradeStation Technologies, Inc. are each wholly owned subsidiaries of TradeStation Group, Inc., both operating, and providing products and services, under the TradeStation brand and trademark. When applying for, or purchasing, accounts, subscriptions, products and services, it is important that you know which company you will be dealing with. Visit www.TradeStation.com for further important information explaining what this means.

XAU/USD: Pullback Likely After Breakout Above Key ResistanceThe XAU/USD market has broken above last week’s high and is now testing the 3080 resistance level. Following this strong move, a pullback appears likely before any further advance. With bullish momentum still dominant, the market may continue higher or enter a sideways phase into next week.
If a pullback occurs, the previous resistance zone, now acting as support, could offer a buying opportunity—particularly near the 3050 level. With high-impact news on the horizon, the market may either range or retrace before resuming its upward trend. The next key target is the resistance zone around 3085

Has the gold tariff peaked?The 4H cycle failed to open upward. According to the general rule, there is a certain probability of a downward kill. The watershed below is still 3100. Only if it falls below this position can it gradually turn to short. At the same time, the current volatility is very large, and any fluctuation starts at ten points. It is recommended to reduce the position to trade; the current long structure of gold has not changed. The key support watershed below is still 3100. Above 3100, the strong bullish idea remains unchanged. Short-term operations rely on 3100 for defense, and enter the market near 3116 to gradually look up. Focus on the strength of the European session. If the European session rebounds and does not break the high, then short the US session at highs, and pay attention to the resistance of the 3148-50 area above.
Today's gold short-term operation ideas suggest that rebounding should be the main focus, and callbacks should be supplemented by longs. The upper short-term focus is on the first-line resistance of 3148-3150, and the lower short-term focus is on the 3100-3110 first-line support.
Short order strategy
Strategy 1: Short 20% of the gold position in batches when it rebounds to around 3148-3150, stop loss 6 points, target around 3135-3125, and look at 3115 if it breaks;
Long order strategy
Strategy 2: Long 20% of the gold position in batches when it pulls back to around 3115-3118, stop loss 6 points, target around 3130-3140, and look at 3150 if it breaks;

Gold chart - Daily ideas for April 7th🔸 Market Snapshot
📉 Gold pulled back sharply on Friday after a surprisingly strong U.S. NFP report, which added 303,000 jobs — well above forecasts. This cooled immediate expectations for aggressive Fed rate cuts and pushed Treasury yields and the dollar higher, triggering a short-term correction in gold prices.
📊 After printing a fresh all-time high at $3168 last week, this drop is seen as a technical retracement, not a trend reversal. Powell’s speech echoed a cautious stance, reiterating a data-dependent path, which leaves room for renewed upside if inflation softens or geopolitical tensions escalate.
🌍 With Middle East tensions still brewing and demand for safe havens intact, many traders now eye 3015–2975 as a key demand zone for potential reaccumulation — setting the stage for the next leg toward 3200 and beyond.
🟩 BUY SCENARIO 1
📍 Entry: 3020–3015
🧠 Confluences: Bullish M15 FVG + Trendline Support + RSI Reversal
TP1: 3086
TP2: 3130
SL: 3008 (below swing low + OB invalidation)
📌 Look for bullish M5 CHoCH or strong reaction wick for sniper entry
🟩 BUY SCENARIO 2
📍 Entry: 2975–2965
🧠 Confluences: Untapped M30 OB + Imbalance Zone + D1 Demand
TP1: 3050
TP2: 3086
SL: 2958 (below OB + psychological 2960 level)
⚠️ Only valid if 3010 breaks and flushes into this zone. Let the price come to you.
🔻 SELL SCENARIO 1
📍 Entry: 3107–3115
🧠 Confluences: M15 OB + Unmitigated FVG + CHoCH after LH
TP1: 3030
TP2: 3010
SL: 3119 (above OB + intraday wick room)
📌 Look for M1–M5 bearish confirmation or rejection wick at OB
🔻 SELL SCENARIO 2
📍 Entry: 3135–3142
🧠 Confluences: Strong OB Zone + Premium Liquidity Grab + Equal Highs
TP1: 3086
TP2: 3020
SL: 3148 (above liquidity + OB invalidation)
⚠️ Still valid if price rallies fast – bonus confluence if RSI shows divergence
📌 Key Levels Recap:
🔹 3142 – Premium OB Zone
🔹 3115 – Intraday LH Rejection
🔹 3020 – Bullish FVG + Trendline Support
🔹 2965 – Deeper Demand Zone
🔹 2958 & 3148 – Final SL Protection Areas
📌 Important Notice!!!
The above analysis is for educational purposes only and does not constitute financial advice. Always compare with your plan and wait for confirmation before taking action.
If you find the ideas contribute to your views on the market be kind to press boost🚀/like button. Your support is appreciated.

The golden large-scale "roller coaster" has near misses and no dFrom the 4-hour analysis, pay attention to the short-term suppression at the 3130-35 line on the top, and the short-term support at the bottom is around 3100-3106, with a focus on the support at 3083-3087. Continue to maintain the rhythm of low-long positions above this position, and stick to the idea of buying more on pullbacks. Go long with the trend to hold the long space, and try not to go against the trend.
Gold operation strategy:
Gold retreats to the 3100-3106 line for more, and retreats to the 3083-3087 line to cover more positions, stop loss 3077, target the 3130-3135 line, and continue to hold if the position is broken;

When will gold's continued highs peak?In terms of the short-term operation strategy for gold, it is recommended to do more on pullbacks and short on rebounds. The short-term focus on the upper side is the 3128-3130 line of resistance, and the short-term focus on the lower side is the 3100-3097 line of support.
Operation strategy reference:
Short order strategy:
Strategy 1: Short (buy short) two-tenths of the position in batches near the rebound of gold around 3127-3130, stop loss 3140, target around 3115-3105, and look at the 3100 line if it breaks;
Long order strategy:
Strategy 2: Go long (buy up) two-tenths of the position in batches near the pullback of gold around 3100-3102, stop loss 3090, target around 3120-3128, and look at the 3140 line if it breaks;

GOLD Price Analysis: Key Insights for Next Week Trading DecisionGold surged to a record high of $3,086 last week as investors dumped Equities and Crypto for safe-haven assets. With rising inflation concerns and uncertainty surrounding Trump’s tariffs, fears of a US recession or stagflation are driving the market.
📈 Will Gold continue its rally, or is a pullback coming? In this video, I break down my thought process and how I’m strategically positioning for the next big move.
#GoldPrice #XAUUSD #MarketAnalysis #GoldTrading #Forex #Inflation #SafeHaven #TradingStrategy
Disclaimer:
Forex and other market trading involve high risk and may not be for everyone. This content is educational only—not financial advice. Always assess your situation and consult a professional before investing. Past performance doesn’t guarantee future results.

Gold bullish trend remains unchangedThe current bullish structure of gold has not changed. The key support below is still the 3100 line. The strong bullish thinking remains unchanged above 3100. Short-term operations rely on 3100 for defense, and gradually move up near 3116. Focus on the strength of the European session. If the European session rebounds but does not break the high, then short the US session at highs. Pay attention to the resistance of 3140-45 above.

GOLD...XAU/USD SELL CHART PATTREN 4h PAIR...It seems like me identifying a sell opportunity for gold based on a trendline breakout. Here's a quick summary:
Sell at: 3035
Target Points:
2980
2882
If the price breaks below a key trendline and moves below 3035, it might signal a downward trend. The first target would be 2980, and if the bearish momentum continues, it could drop further to 2882.
Would you like any further analysis on this setup or additional technical indicators to watch for confirmation?

SELL GOLDIn todays session we are looking for selling opportunity in this most waited for pair GOLD. It has been extremely bullish. Our entries are at 3160 stops above 3200 and targets as low as 2916. Use proper risk management and wait for confluence.
BEARS INCOMING

Gold (XAU/USD) Technical Analysis: SMC Trading point update
This chart is a technical analysis of Gold (XAU/USD) on a 4-hour timeframe. Here’s a breakdown
1. Ascending Channel:
The price is moving within an upward channel, showing a bullish trend.
Higher highs and higher lows confirm the uptrend.
2. Support and Resistance Zones:
Yellow Boxes: Key support zones where price previously consolidated before moving higher.
Red Arrows: Marking resistance zones where the price faced rejection.
Green Arrows: Indicating support levels where the price bounced.
3. Current Price Action:
Price recently dropped to a key support zone (around $3,050).
A bullish reaction is expected from this level.
If support holds, the price may continue the uptrend toward the target of $3,186.
4. Projected Move:
The black zigzag line suggests a potential bounce from support.
If the support level holds, price could move back up within the channel.
Mr SMC Trading point
Conclusion:
If price respects the support zone, there could be a good buying opportunity.
A break below the support zone would signal potential bearish movement.
Monitoring price action around the yellow zone is crucial for confirming direction.
Pales support boost 🚀 analysis follow )

Gold is in the Bullish DirectionHello Traders
In This Chart GOLD HOURLY Forex Forecast By FOREX PLANET
today Gold analysis 👆
🟢This Chart includes_ (GOLD market update)
🟢What is The Next Opportunity on GOLD Market
🟢how to Enter to the Valid Entry With Assurance Profit
This CHART is For Trader's that Want to Improve Their Technical Analysis Skills and Their Trading By Understanding How To Analyze The Market Using Multiple Timeframes and Understanding The Bigger Picture on the Charts
Gold 100% Trading StrategyGold plummeted at the opening of Monday, reaching the lowest point of 2972, and then rebounded to 3055. We successfully placed a short order at 3052, and have already made a profit. The hourly moving average of gold crosses downward, and the short position is arranged, and it continues to open downward. So gold is now the home of the shorts. Gold rebounds or continues to short. Gold is now in a short trend below the gap. We continue to pay attention to the short-term suppression of 3055 above, and continue to short if the rebound does not break.
From the 4-hour analysis, today's upper short-term resistance is 3055, and the lower line is 3000-3008. In terms of operation, the rebound pressure at this position continues to be short and follow the trend to fall. It is necessary to rely on the rebound to rely on 3055-60 to go short once, and the lower target continues to break the bottom.
Gold operation strategy:
1. If gold rebounds to 3055-3058, short it, stop loss at 3066, target 3015-3020, continue to hold if it breaks;
2. If gold falls back to 3000-3006 but does not break, you can buy it, stop loss at 2993, target 3045-53, continue to hold if it breaks

Middle East heats up, GOLD rises more than 20 USDIn the Asian trading session, the spot price of OANDA:XAUUSD suddenly jumped by more than 20 USD in the short term and the gold price just touched 3,135 USD/ounce. The situation in the Middle East suddenly became tense and the US Department of Defense sent more aircraft carriers and bombers to the Middle East, increasing risk aversion, which boosted the demand for safe havens.
The latest news from Bloomberg News in the US said that in the context of the US declaring to continue the fight against the Iran-backed Houthi rebels and escalating tensions with Iran over Iran's nuclear program, US Secretary of Defense Pete Hegseth ordered the dispatch of more troops to the Middle East, including the USS Carl Vinson aircraft carrier strike group and many fighter jets.
The Carl Vinson will arrive in the region after completing the Indo-Pacific exercise. Pentagon spokesman Sean Parnell said in a statement Tuesday that the Defense Department will also extend the deployment of the USS Harry S. Truman Carrier Strike Group in the region. The rare deployment of two aircraft carriers echoes a show of force last year under the Biden administration.
"Secretary Hegseth made clear once again that if Iran or its proxies threaten U.S. personnel and interests in the region, the United States will take decisive action to protect our people," Parnell said.
Iran's Supreme Leader Ayatollah Ali Khamenei said on Monday that any attack by the United States or Israel would be met with "decisive retaliation." US President Donald Trump has previously threatened to bomb Iran if it does not sign a deal to give up its nuclear weapons.
Last week, Iranian Foreign Minister Abbas Araghchi said there would be no direct talks with the United States as long as the Trump administration continued its "military threats." "If there is no deal, the bombing will come," Trump warned in an interview last weekend.
Technical Outlook Analysis OANDA:XAUUSD
On the daily chart, gold tested the 0.786% Fibonacci extension level and declined slightly after receiving support from the 0.618% Fibonacci extension level. As we have communicated to our readers in previous publications, given the current fundamental context and technical chart conditions, further price declines are possible, but should only be considered as short-term corrections and not a trend. Or we can consider the downward corrections as another buying opportunity.
As long as gold remains within the price channel, there is still a long-term main uptrend, with the main support from the EMA21 and the short-term trend is highlighted by the price channel.
For now, gold is capped by the $3,135 level, once this level is broken above gold, there will be conditions to continue to refresh the all-time high set on yesterday's trading day with the next target being the $3,172 price point of the 1% Fibonacci extension.
During the day, the bullish outlook of gold will be highlighted by the following technical levels.
Support: $3,108 – $3,100 – $3,086
Resistance: $3,135 – $3,149 – $3,172
SELL XAUUSD PRICE 3171 - 3169⚡️
↠↠ Stoploss 3175
→Take Profit 1 3163
↨
→Take Profit 2 3157
BUY XAUUSD PRICE 3085 - 3087⚡️
↠↠ Stoploss 3081
→Take Profit 1 3093
↨
→Take Profit 2 3099

XAUUSD ICT Analysis | Smart Money Concepts | 15m ChartThis chart exemplifies classic ICT methodology and Smart Money Concepts (SMC) in motion. Here's a breakdown of the zones and logic:
Current Market Structure
Market swept a prior low (liquidity grab) near $3,015, indicating Smart Money accumulation in the breaker block.
Bullish reaction occurred precisely at the breaker + demand zone, suggesting accumulation by Smart Money.
Price is currently respecting a short-term higher low, with probable retracement toward premium levels.
Key Zones Marked
Breaker Block ($3,015–$3,036): Entry area where price reversed after liquidity sweep.
High Probability Reversal Zone (~$3,061–$3,075): Aligned with 0.382–0.5 Fib + internal liquidity.
Pullback Zone (~$3,090): 0.618 Fib retracement & previous inefficiency (FVG close).
FVG (Fair Value Gap) (~$3,100–$3,135): Anticipated magnet for price to rebalance inefficiency.
Order Block + Rejection Block (~$3,135–$3,167): Strong resistance zone. High chance of rejection.
Expected Play
Liquidity Sweep Below -> Accumulation in Breaker Block
Bullish Repricing Toward FVG + OB
Reaction in Pullback Zone / OB Likely
Smart Money will look to offload longs in the OB/Resistance Zone, potentially triggering a bearish rejection.
Macro Fundamentals (April 2025)
Recent Geopolitical & Economic Drivers:
1. Middle East Tensions: Escalation between Iran and Israel has increased risk-on demand for gold.
2.USD Weakness: Mixed US labor data released April 4 showed slower job growth, reducing Fed’s tightening stance.
3. Gold Reserve Accumulation: Recent reports indicate China & Russia continue increasing gold reserves, supporting medium-term bullish bias on XAU.

Gold Trade Plan 08/04/2025Dear Traders,
Gold still ( Correction phase) and i expect price will start correction after touch top of Descending channel ,
If you enjoyed this forecast, please show your support with a like and comment. Your feedback is what drives me to keep creating valuable content."
Regards,
Alireza!

GOLD 3.5K 〉BUY BELOW 3000As illustrated, Im trying to visualize what could be a nice buy to hold at least during the month of April.
With Trump's term in office just starting, the level of uncertainty will keep getting worse.
Any dip in gold will serve as a major stepping stone to further expand to the upside.
POTENTIAL SHORT TERM SELL AREA:
Between the 61.8% and 70.5% retracement of the profit-taking drop we just had from Thursday - Friday.
TARGET: 161.8% Extension - roughly 2955.00 - 2945.00
-
Within that range, I'm expecting my personal setup called: "V" SHAPE.
Illustrated, is a what I like to see in the 1m and 5m timeframes BELOW major lows like any Weekly Low or Daily Low.
In this case, it is likely for the rebound to occur very close to or just below FEB'S HIGH (2954.00)
Once the pattern shown ("V" SHAPE) appears evident within the "potential buy area" illustrated, I will take buys AND HODL to $3,200 as first target & $3,500 in extension.
I will be adding positions more or less in the levels visualized but obviously depending on the market structure that the rebound offers.
-
Join my trading team.
Ig (@persaxu).
...
GOOD LUCK!

BEYOND TEHNICAL ANALYSIS Beyond the technical analysis chances of the market goes against the setup are there

GOLD Will Explode! BUY!
My dear friends,
Please, find my technical outlook for GOLD below:
The instrument tests an important psychological level 2788.3
Bias - Bullish
Technical Indicators: Supper Trend gives a precise Bullish signal, while Pivot Point HL predicts price changes and potential reversals in the market.
Target - 2802.9
Recommended Stop Loss - 2780.8
About Used Indicators:
Super-trend indicator is more useful in trending markets where there are clear uptrends and downtrends in price.
Disclosure: I am part of Trade Nation's Influencer program and receive a monthly fee for using their TradingView charts in my analysis.
———————————
WISH YOU ALL LUCK
