Gold ( XAUUSD ) Forecast for the next weekIf Gold stay at 3020 today than it will move up side again otherwise it will hit strong support of 3000 and than Gold start its rally again upside. Be patience and watch closely.
GOLD.PRO.OTMS trade ideas

Gold tariff policy boosts risk aversion!The 4-hour chart fluctuates around 3100-3138 and then rises. At present, the short-term momentum of the single positive line breaking the high is strong, and there is still room for further extension. At the same time, the middle track is lost and recovered, and the middle track is still the key long defense point. The Asian session relies on 3135-3138 as a support conversion point. First, look at a wave of inertia rushing up. In terms of operation, short-term longs near 3138-3140 are used for retracement, defense 3130, target 3165-3175, long at high positions strictly with a good defense position, and timely pocket money after the rush.
Today's gold short-term operation ideas suggest that the rebound is mainly short, and the callback is supplemented by long. The top short-term focus is on the 3138-3140 first-line resistance, and the bottom short-term focus is on the 3100-3110 first-line support.
Short position strategy:
Strategy 1: Short 20% of the gold position in batches when it rebounds to around 3175-3178, stop loss 6 points, target around 3155-3145, and look at the 3140 line if it breaks;
Long position strategy:
Strategy 2: Long 20% of the gold position in batches when it pulls back to around 3138-3140, stop loss 6 points, target around 3160-3170, and look at the 3180 line if it breaks;

GOLD NEXT MOVE (expecting bullish move)(26-03-2025)(mid term)Go through the analysis carefully and do trade accordingly.
Anup 'BIAS for the day (26-03-2025)
Current price- 3017
"if Price stays above 3008, then next target is 3027, 3037, 3055 and 3072 and below that 2985 ".
-POSSIBILITY-1
Wait (as geopolitical situation are worsening )
-POSSIBILITY-2
Wait (as geopolitical situation are worsening)
Best of luck
Never risk more than 1% of principal to follow any position.
Support us by liking and sharing the post.

Gold fell100 points for 3 consecutive days Market trend analysisStop loss is always right, even if it is wrong; holding on is always wrong, even if it is right. Stop loss is unconditional! Without trading principles and trading discipline, all technology is equal to zero!
Spot gold fell by $212 in three days, and the bears shined. A while ago, we warned of the risks, but many people scoffed at it, thinking it was alarmist and that gold would not fall. The money earned by the bull market will definitely be lost with the principal and interest under the belief of the bull market. The three-day plunge in gold is enough to make many people return to the time before opening an account in three days!
The market staged a "holiday conspiracy theory" market, because the heat has reached, and it is facing the implementation of equal tariffs. The previous surge in gold is to buy expectations and sell facts. The bullish atmosphere is unprecedentedly high, and the main force can harvest it.
How arrogant the bulls of gold were at the beginning, how embarrassed they are now; the bears are far stronger than the bulls, the bulls cut meat with a blunt knife, and the bears cut the Gordian knot with a quick knife! Gold plunged $112 from 3167 to 3055 last Thursday, $120 from 3136 to 3016 on Thursday, and $100 from 3056 to 2056 yesterday, Monday. Last year, there were five days with a plunge of nearly or more than $100, and three consecutive days recently. Because the price is high, there will be more single-day plunges of 100 or more this year.
Yesterday, all three major U.S. stock indexes stopped falling at the lifeline of bulls and ushered in an oversold rebound. The panic decline of crude oil and silver was also alleviated. Silver stopped falling at the key support of bulls at 28-28.5. It shows that risk sentiment has been alleviated to a certain extent. Market risk sentiment has been released, and gold shorts also need to rest. The main force of gold has cultivated too many bulls from January to April 2025, and cultivated the bull market thinking of retail investors. It will definitely kill the bulls with the help of this round of sharp decline, and gold can start to rise again! In the medium term, the rebound correction is for a better decline. 2956-50 will be broken, and then 2930-2880 will be broken, and the ultimate 2830 will be broken. Today is the fourth day of the decline. The decline stopped at 2956 in the early morning, which is the previous high point. At present, the first round of gold decline in the short term has been in place. Many people panicked after three days of sharp decline. Those who bought the bottom dared not buy the bottom, and those who did not short should chase the short. The main force will continue to wash the market! Today, the correction rebound is mainly seen. The upper resistance focuses on 3000, then 3030-25 and yesterday's high 3045-55 area.
The focus of the day is 2956-60, and the short-term support is 2970-75. In theory, if you want to wash the market, wash it harder. 3000 can't stop it. Pay attention to the 3020-35 range, and even rush to yesterday's high area and then fall. Gold fluctuates by more than ten or dozens of dollars in 5 minutes. The article can only give ideas and areas. More specific strategies need to be given offline in combination with real trading. Orders must be strictly carried out with losses to prevent being stuck in the wrong direction. In an emotional market, watch more and do less!
In today's market:
1: In 4 hours, the stochastic indicator temporarily forms a small golden cross, but the strength and continuity of the golden cross are not shown; MACD double lines are downward, which is a bearish signal; the indicator is not a resonant bearish signal, so the 4-hour bias is corrected; in terms of form, it breaks the bottom and sets a new low, constantly pierces, and constantly rebounds. The support near the low of 2950 is effective here, and the back and forth piercing near 2970 is of little reference significance; the second decline is around 3050 and around 3020;
2: In the daily K, the stochastic indicator continues to cross, so the main high-altitude treatment is used; MACD double lines diverge, which is a bearish signal; the daily K is a resonant bearish signal, so the main idea of shorting at highs is used; the current central axis position is around 3010;
To sum up: the intraday short-term trend is around 2950 in 4 hours, and the decline rebounds; after the correction rebound, we continue to treat it as a high-altitude; several pressure positions 3 010-3020,
The second is around 3050, followed by around 3090; on the long side, the layout is in the range of 2955-2965; the large range is positioned in the range of 3050-2950
Strategy:
Short around 3015-17, defend 3024, target 3000-2990, the operation has been made and is not considered
Long around 2995-97, defend 299 0, the target 3000-3010-3030 has been entered and is no longer considered
Intraday short around 3030-40, defense 3045, target 3000--2980-2960-2930
Intraday secondary long around 2962-64, defense 2956, target 2975-2990
After falling below 2955, it will reach 2930 and 2880.

Short gold I might be front running this , but gold is due a pull back and that would be a macro pull back gold has topped for a while.

Sniper Entry Activated: Post-Unemployment Claims Liquidity SweepGOLD JUST HIT $3,055—🥶 deep dive mode unlocked!
Alright, this is crunch time. We’re officially in the $3,050–$3,057 "DO OR DIE" buy zone.
Updated Game Plan:
🟢 Buy Setup (High-Risk Reversal Zone)
📍 Entry: $3,050 – $3,057 (we’re IN IT)
📍 Trigger: M1/M5 CHoCH + rejection wick + engulfing candle
📍 SL: Below $3,047 (tight but necessary)
📍 TP1: $3,074
📍 TP2: $3,089
📍 TP3: $3,100
🚨 If $3,047 breaks CLEANLY… expect $3,033 – $3,038 next, followed by $3,021.
📌 What’s happening?
✔️ This is a major liquidity sweep—smart money hunting stops before reversal? 🤔
✔️ If we get a strong rejection here, NY could send it back above $3,074.
✔️ If we see NO bullish reaction, it's bear town until $3,033.
📌 Important Notice!!!
The above analysis is for educational purposes only and does not constitute financial advice. Always compare with your own plan and wait for confirmation before taking action.

Gold market trend analysisGold has a lot of room to fall, but it has not changed the current bullish trend. It is still possible to rise after adjustment. In fact, gold rebounded after a sharp drop and hit the high point of 3135 again, which reflects the absolute bullishness of gold. At present, gold closed at around 3110. Obviously, after a big rise and fall, gold will most likely adjust and enter a shock range. The temporary effective range is between 3055-3135. If there is no big fluctuation, you can refer to the 1H cycle range for high-short and low-long trading. However, if there are too many small-cycle adjustments, the space below may not be so small. There is also support at 3035 below and a relative high at 3135 above. Therefore, the market still depends on the range adjustment. It is recommended to sell high and buy low in terms of operation. Pay attention to the resistance of 3035-3150 above and the support of 3065-3055 below.

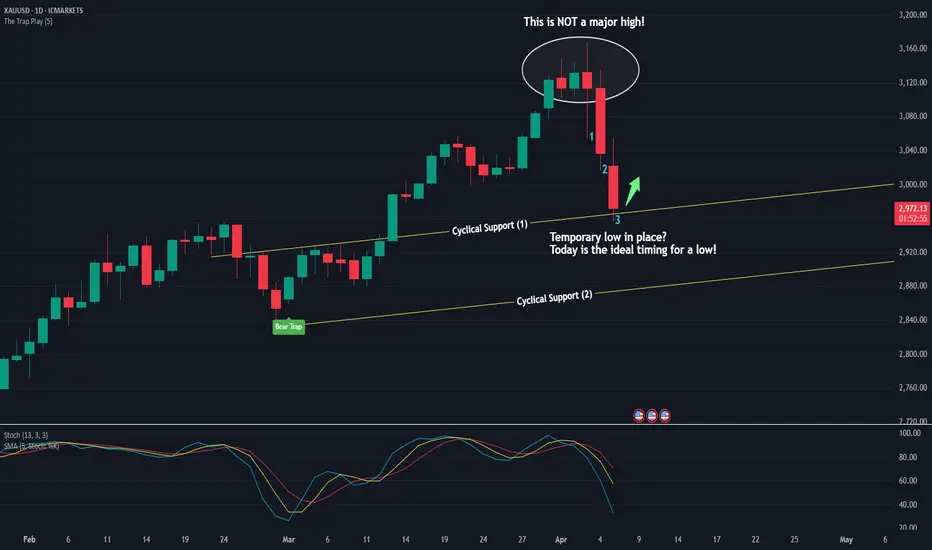
Temporary Low or All-Time Bottom for Gold?Last week marked the ideal timing for a weekly high, which turned out to be accurate.
Today represents the ideal timing for a daily low. Whether this low will be temporary or mark a more significant bottom remains to be seen. From a cyclical perspective, gold has corrected for three time units, which aligns with projected support. Therefore, a bounce tomorrow is likely, as corrections typically last only 1–3 time units. Exceeding this range would suggest a continued decline becomes possible, potentially down to the second support line.
There is still a possibility of a larger "FALSE MOVE" to the downside.
Gold fluctuates bearishly to welcome non-farm payrollsGold's 1-hour moving average continues to show signs of turning downward. If a death cross is formed downward in the 1-hour moving average, then the gold shorts will have a greater advantage. The 1-hour downward trend line also suppresses the rebound of gold. The rebound is still short. The trend suppression has now moved down to around 3110. Gold rebounds under pressure and continues to short at 3110. If the European market is strong in the afternoon, then give up the idea of shorting. Continue to wait for the market to stabilize.
Today's gold short-term operation ideas suggest that rebounding is the main focus, and callbacks are supplemented by longs. The top short-term focus is on the 3110-3115 first-line resistance, and the bottom short-term focus is on the 3054-3066 first-line support.
Short position strategy:
Strategy 1: Short 20% of the gold position in batches when it rebounds to around 3110-3112, stop loss 6 points, target around 3090-3075, and look at 3065 if it breaks;
Long position strategy:
Strategy 2: Long 20% of the gold position in batches when it pulls back to around 3065-3068, stop loss 6 points, target around 3090-3100, and look at 3110 if it breaks;

Gold returns to a sharp decline?Dear friends!
Gold has a downward trend today, with the current price fluctuating around 3,097 dollars. The main reason is due to the tax measures of U.S. President Donald Trump, which help clarify the market trend but raise concerns about economic recession, thereby boosting the demand for USD, leading to an increase in its value, which affects gold.
From a technical perspective, it is not advisable to buy at this moment, as the risk is high, and for selling, we should wait for the price to establish a clear trend.
At present, it is most worth waiting for consolidation on the basis of a downward trend, as the market will sharply hit important milestones that you can build your trading strategy upon.
If you find this information useful, don't forget to like and follow Gary to receive the latest updates!

XAU/USD: Possible Fall Ahead? (READ THE CAPTION)By examining the gold chart on the 4-hour timeframe, we can see that, as expected, the price continued its bullish movement and climbed close to its all-time high of $3057, reaching $3056 today. Since this level acted as a Bearish Rejection Block, we’re now seeing a price correction from that area, with gold currently trading around $3049. If the price stabilizes below the $3050 mark, we may see further downside. Potential bearish targets are $3045, $3040, and $3035, respectively.
Please support me with your likes and comments to motivate me to share more analysis with you and share your opinion about the possible trend of this chart with me !
Best Regards , Arman Shaban

XAUUSD Weekly Plan (April 7–11, 2025)✨ | Smart Money Outlook
The higher timeframes have spoken loud and clear: XAUUSD is trading at extreme levels, brushing against historical highs. Here's a clean breakdown based on the monthly and weekly macrostructure for the week ahead:
🔢 Monthly Chart Overview (MN1)
Price just tapped into the premium zone and reacted from the monthly POI (around 3180).
Current candle shows a long upper wick, signaling potential exhaustion.
No clear supply mitigation above — price is exploring uncharted territory.
Weekly high now aligns with a possible reversal or liquidity grab.
🌍 Weekly Chart Structure (W1)
Massive BOS from the 2075 breakout now confirmed.
Price is forming a potential final HL before either continuation or reversal.
We are in a clear premium area, and weekly RSI is overstretched.
Strong confluences for a deeper pullback into the 2850–2920 region, which holds old unmitigated OBs and valid FVGs.
🔹 Key Weekly Levels to Watch:
⬆️ Supply Zone: 3180–3200 (tapped)
⬇️ Demand Zones:
3080–3054 (partially mitigated)
2920–2900 (clean FVG and OB zone)
2820–2780 (discount + major liquidity)
🔎 Macro Outlook
Until we get a clean break and hold above 3180, the market is in a liquidity hunting phase. Expect choppy behavior around current highs.
Any bearish reaction from here aligns with:
RSI divergence
Overextension from EMAs (price currently well above 21/50/100/200)
Imbalance-filled structure left behind
If bulls want higher, they need to hold above 3054 and reclaim 3135 with volume and conviction.
💪 This Week's Focus
No rush. We're in premium territory. Let the market show its hand.
Watch for retests of broken structures (like 3080 and 3135)
Monitor for liquidity sweeps above previous highs
Respect HTF imbalance and confluences
🤝 Let’s Trade Together!
If you found this outlook useful, don’t forget to leave a like, drop a comment, or hit follow — let’s connect with traders who value precision and patience. Stay sharp, stay kind. 🌟

gold The plunge exceeded 100 points,The bearish trend is crazy!This week brings new trading opportunities, as well as new market opportunities. Nowadays, the market fluctuates greatly every day. Being a short-term trade means high frequency, fast in and fast out. As long as you do these well, you can make money in short-term trading. Don't be greedy for more. The most important thing in trading is stability. Going fast is not as good as going steadily. Do a good job in daily trading. If you can get two or three waves of profits, it will be enough for you. If you do not have the ability to flexibly respond to the market during trading, and are not good at adjusting your trading thinking and rhythm to the market rhythm in a timely manner, you can contact me and let us pursue more profits flexibly and stably in the volatile market!
The K-line of the Golden Week closed at a medium-sized Yin high with a long upper shadow. forming a top heavy-volume adjustment in the short term. The daily negative adjustment engulfed the previous rising space. In terms of form, there is still room for adjustment this week, which can be continued to 2972 and 2956, while the top touches 3168 to explore the high and fall back pattern. , there is a high probability of forming a short-term high, but whether the trend will change needs to be further observed. Beware of weekly negative singles without consecutive negatives. The short-term pressure remains at 3058 and 3076. It will bottom out at the opening and rebound. First look at the strength of the rebound. At the top, focus on the pressure of 3055 first, and then look at 3076 if it breaks. Do not blindly chase shorts. Don't blindly chase the short position.
Operation suggestion: Gold is short near 3070-75, stop loss at 3080, and look at 3055 and 3020; if it is weak, pay attention to the 3055 pressure to short!

Gold fell into a high-level consolidation.Although the gold price briefly fell back to 3100 points, the strength was limited. The big positive line quickly broke through, showing that the short-term momentum was insufficient, the long-term was still strong, and the probability of a new high was greatly increased. On the hourly chart, the gold price maintained high fluctuations, and the strength and sustainability of the retracement were not strong. The technical form of the small-level cycle was gradually adjusted in place, and it was expected to continue to rise in the late trading. The upper resistance was concentrated in the 3127-3133 range, and the lower support was in the 3107-3103 range.
Strategy: It is recommended to buy at 3105-3100, stop loss at 3093, target at 3120-3130, and break at 3140.

Navigating the Range Ahead of Tariffs Announcement📢 News 📢
President Trump is set to announce new tariffs today, April 2, 2025, at 4 p.m. Eastern Time. This initiative, dubbed "Liberation Day," aims to boost U.S. manufacturing by targeting imports like autos, steel, and pharmaceuticals. 📦💊 However, economists warn that these measures could lead to higher consumer costs and disrupt trade relations. 📉💹
This news might influence market sentiment and could have implications for gold trading. Keep an eye on how the market reacts! 📈💰
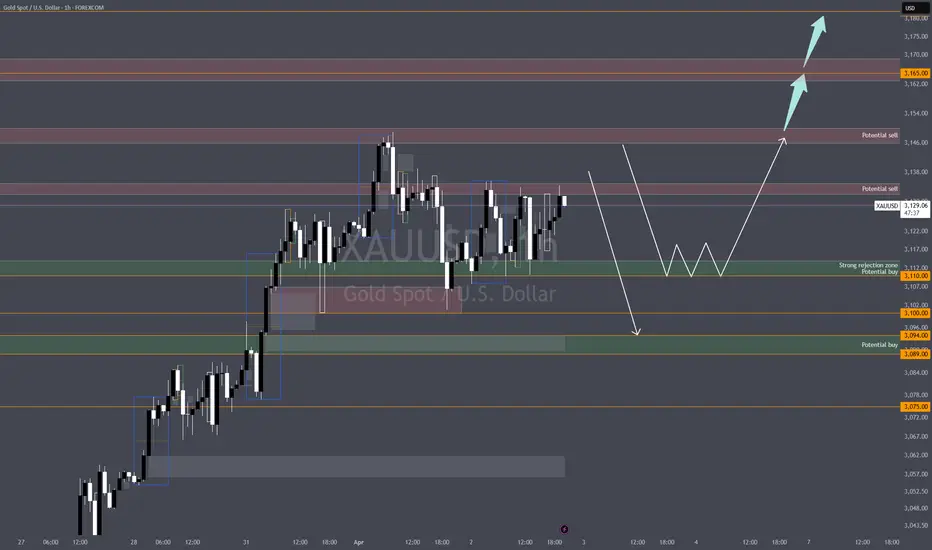
📊XAUUSD 1H Analysis (Current Situation)
Market Structure:
The market is in a clear bullish trend with strong momentum from the previous sessions.
Recent price action shows consolidation near 3,132, suggesting a potential liquidity build-up.
There is a higher high formation, but rejection from the supply zone around 3,139 - 3,150.
Key Technical Zones & Confluences:
Supply Zone / Potential Sell Area:
3,139 - 3,150: If price reacts with strong rejections here, a potential short opportunity may emerge.
3,165 - 3,182: If price breaks above 3,150, this is the next key resistance area.
Demand Zone / Potential Buy Areas:
3,110 - Strong Rejection Zone: If price pulls back here and finds bullish confirmations (e.g., bullish engulfing, liquidity grab), a long entry could be valid.
3,092 - 3,075 Potential Buy Zone: A deeper retracement into this level could provide a sniper entry opportunity.
🔴 Sell Setup
Entry Zone: $3,133 - $3,135
SL: Above $3,138 (tight protection)
TP1: $3,128 (first reaction)
TP2: $3,117 (liquidity zone)
TP3: $3,103 (full move)
📌 Reasoning:
Mid-range premium pricing (not at extreme highs but still valid)
Multiple rejections in this zone (potential shift in order flow)
Possible short-term retrace before continuation
🔴 Sell Idea
Entry Zone: $3,145 - $3,150
SL: Above $3,153 (small wick safety)
TP1: $3,132 (reaction level)
TP2: $3,128 (stronger demand)
TP3: $3,117 (full imbalance fill)
📌 Reasoning:
Liquidity grab potential above $3,145
Imbalance & order block confluence
Possible rejection from premium supply
🟢 Buy idea
Entry Zone: $3,094 - $3,089
Stop Loss (SL): Below $3,085
Take Profit (TP) Levels:
TP1: $3,117
TP2: $3,128
TP3: $3,150
📌 Reasoning:
Unmitigated demand zone
Imbalance around $3,094 suggests a reaction
Strong liquidity pockets nearby
📌 Important Notice!!!
The above analysis is for educational purposes only and does not constitute financial advice. Always compare with your own plan and wait for confirmation before taking action.
4/8 Gold Trading StrategyYesterday, gold dipped to the 2950 support zone, still under bearish pressure. However, the market did not enter into an extreme one-sided sell-off. Instead, an intraday rebound suggested that short-term buying interest is beginning to emerge.
Following last week's and yesterday’s sharp correction, the 1-hour technical structure has started to show early signs of a potential bottom. While a retest of the 2960–2950 area in the near term cannot be ruled out, the broader price action now supports the technical conditions for a medium- to short-term rebound.
Currently, gold is stabilizing around the 2980-2960 level. Even if additional bearish pressure emerges, the maximum downside support is expected in the 2919–2888 range. This suggests a likely transition into a low-level consolidation and base-building phase, rather than a continued steep decline.
From a technical perspective, the 3100 zone is a key corrective target for this pullback. The market may gradually move higher to complete a structure recovery, offering a limited-risk, clearly defined opportunity for the bulls.
📌 Key intraday resistance levels:
3018 → 3037 → 3058 → 3079
📌 Trading Strategy for Today:
🟢 Buy Zone: 2976 – 2948
🔴 Sell Zone: 3048 – 3062
🔁 Scalp/Range Zone: 3032 – 2998

GOLD - Day Trading with RSI 04/02/2025
Weekly and Daily Timeframes (W & D):
GOLD is still in an uptrend, as the RSI's WMA45 is still hovering near the 70 level, and RSI remains above both of its moving averages.
H4 Timeframe:
This timeframe is currently showing a correction. However, it's not yet considered a downtrend because the WMA45 is still in the high region, close to the 70 level. But, RSI has dropped below the WMA45.
At present, the RSI on H4 is facing dynamic resistance from the WMA45 above and has support around the 4x level (43-48). The corresponding temporary price levels are approximately 3128 (resistance) and 3088 (support).
This end-of-uptrend correction on H4 could lead to high price volatility. GOLD may move within a 300–400 pip range (between the resistance from WMA45 and the RSI support around the 4x zone).
H1 Timeframe:
Currently in a downtrend, as RSI is moving below both of its MAs, and the WMA45 has a noticeable downward slope.
H1 also has RSI support at the 30 level (temporary price ~3086) and resistance at WMA45 above (temporary price ~3130).
Since we’re focusing on intraday trading, priority is given to the H1 trend.
Figure 1
Trading Plan: SELL
Entry Zone:
When RSI on M15 approaches upper resistance: levels 50–55 or 65–70.
Confirm Entry:
Conservative/Safe approach: when M5 ends its uptrend and reverses (see example in Figure 1 – M5 ends uptrend when RSI crosses below both MAs).
Or when bearish divergence appears on M5.
Or even earlier, when there’s divergence on M1 and M5's WMA45 flattens out.
Stoploss:
20–30 pips above M5’s recent peak.
Or if RSI on M5/M15 breaks through its previous high.
Take Profit:
100 pips or R:R >= 1:1.
Or when M5’s downtrend ends (when RSI crosses above both MAs).
You can check out the indicators I use here: www.tradingview.com

Good news for bears, gold will fall back to 3095-3085Driven by Trump’s tariff policies and geopolitical risks, gold has sustained a strong upward trajectory. However, after reaching around 3128, its momentum has visibly slowed, with multiple signs of pullbacks emerging within the short-term structure.
From the candlestick chart, it’s evident that gold has faced repeated rejection signals above 3125, characterized by long upper shadows. The 3125 level has now formed a notable resistance zone and appears to be acting as a short-term consolidation high. This price action increases the likelihood of a potential top formation.
Moreover, gold’s recent strength is largely attributed to growing concerns of a global trade war sparked by Trump’s tariff policies, prompting investors to rotate out of risk assets like equities and into safe-haven assets such as gold. However, if Trump softens his stance on the tariffs or adopts a more diplomatic approach to maintain confidence in the U.S. dollar, risk appetite may recover. This would likely drive funds back into equities and other risk assets, leading to an outflow from gold.
For gold trading, I prefer to avoid aggressively chasing long positions at this stage, as downside risks persist. If gold fails to decisively break through the 3125-3135 resistance zone, the bullish momentum may weaken, increasing the likelihood of a downward move. If gold break below the 3100 level during a pullback, it could accelerate further declines, with potential targets in the 3095-3085 range.
The trading strategy verification accuracy rate is more than 90%; one step ahead, exclusive access to trading strategies and real-time trading settings

GOLD ROUTE MAP UPDATEHey Everyone,
Another awesome finish to the week with our charts idea playing out to perfection!!!
After completing our 3050 target yesterday, we got our cross and lock above 3050 opening 3065, followed with a further cross and lock above 3065 opening 3080, Both 3065 and 3080 were completed today for a perfect finish.
We will now need a cross and lock above 3080 for a continuation into the next Goldturn or failure to lock will see rejections into the lower Goldturns.
BULLISH TARGET
3032 - DONE
EMA5 CROSS AND LOCK ABOVE 3032 WILL OPEN THE FOLLOWING BULLISH TARGET
3050 - DONE
EMA5 CROSS AND LOCK ABOVE 3050 WILL OPEN THE FOLLOWING BULLISH TARGET
3065 - DONE
EMA5 CROSS AND LOCK ABOVE 3065 WILL OPEN THE FOLLOWING BULLISH TARGET
3080 - DONE
EMA5 CROSS AND LOCK ABOVE 3080 WILL OPEN THE FOLLOWING BULLISH TARGET
3097
BEARISH TARGETS
3015 - DONE
We will now come back Sunday with our updated Multi time-frame analysis, Gold route map and trading plans for the week ahead and also a new Daily chart long term chart idea, now that this one is complete.
Have a smashing weekend!! And once again, thank you all for your likes, comments and follows, we really appreciate it!
Mr Gold
GoldViewFX

XAUUSD BULLISH SET-UP I Created This XAUUSD Chart Analysis In 15-M Tf
Entry: BUY from 3104
Support zone : 3104 / 3100
Target Will Be : 3130
OANDA:XAUUSD make running in support zone, It takes support and it went to Uptrend, If xauusd Break 3094 Level then Our this Chart failed.

Gold continues the trend of reduced from 3100 USD ?Hello everyone! Gary here, it's great to see you again in today's gold price analysis!
Generally, XAUUSD has experienced a significant price decline at the beginning of the week, dropping below the 3055 USD level. It is currently trading at a new level of 3005 USD, showing little change compared to yesterday's trading session. So, what are the reasons and strong factors currently affecting gold prices?
Regarding influencing factors:
The daily market factors include a weaker dollar and a pause in rising U.S. bond yields. The market is reacting to the escalating trade tensions between the United States and China, including the threat of a new 50% tariff and potential countermeasures from Beijing. Growing expectations for a Fed rate cut and a recovery in risk appetite also support gold's growth, but the uncertainty of global trade policy leaves investors uncertain.
Regarding the new outlook for XAUUSD:
On the 1H chart, as Gary mentioned earlier, XAUUSD is currently receiving strong support at the 2970 USD level. A break below this level will lead to a significant price drop, while maintaining this level will result in an increase. Upon close observation, it can be seen that the precious metal has broken through the previous support level of 3055 USD, establishing it as a new key resistance level. Both short-term and medium-term outlooks indicate that the downtrend is gradually strengthening. Therefore, as long as the resistance levels within the descending channel are well protected, the Sell strategy remains the top priority.
If you find this information useful, don't forget to like and follow Gary for the latest updates!

XAUUSD SELL zone H4 chart analysisYeah, let's break it down.
Your analysis suggests:
Gold is in an ascending channel, but showing signs of weakness.
3052 is strong resistance, so any rejection here supports the bearish bias.
Breakdown from the ascending channel could lead to targets at 3005, 2970, 2940, and 2882.
A few things we could look at together:
1. Chart Review: Check the current structure — is price hugging the lower trendline? Any bearish candlestick patterns?
2. Volume Analysis: Is volume picking up on down moves?
3. Momentum Indicators: RSI divergence or MACD crossover could help confirm.
4. Fundamentals: Is there a news catalyst supporting downside (like strong USD or rising yields)?

SUPPORT AND RESISTANCE BREAKOUT ALERT!🚨 Attention Traders! 🚨
XAUUSD is on fire, breaking records with power! 🔥 Here's the latest:
Current Range: We're seeing a fierce battle between 3017 and 3043. Will we break out soon?
Bearish Scenario: Watch out for a possible dip below this range. If that happens, targets like 2988 and 2978 could be in play. ⚠️
Bullish Scenario: A breakout above 3043 opens up buying opportunities! Watch for movement above 3072, with targets at 3124 and 3150. 🚀
💬 Join the Discussion! What are your thoughts? Let’s ride this wave and make the most of the opportunities ahead! 💎
