The bearish trend is just beginning: Short Gold!Good morning, bros! With the gold price falling by LSE:100H yesterday, there is no doubt that the market is currently dominated by bears! As the gold high gradually moves down, it is difficult to hold even 3100, further weakening the bullish momentum and exacerbating panic selling to a certain extent!
Obviously, as gold completes the regional conversion, the previous support has been transformed into an important resistance area in the short term, and the short-term resistance effect of the 3115-3125 zone is very obvious; and the current area near 3090 does not play a structural support role, so the area near 3090 is easy to be broken, and the short-term support below is in the 3075-3065 zone.
So in terms of short-term trading, before the NFP market, we can still short gold with the resistance of the 3115-3125 zone, with the first target pointing to the 3075-3065 zone, followed by the 3055-3045 zone.
The trading strategy verification accuracy rate is more than 90%; one step ahead, exclusive access to trading strategies and real-time trading settings
GOLD.PRO.OTMS trade ideas

Gold 100% ProfitGold failed to hit 3200 and turned to fall. In the early morning, it bottomed out and rebounded under the influence of the news of the implementation of the tariff policy. It continued to rise in the morning and reached the highest level of 3167, with an increase of 62 US dollars from 3105-3167.
However, the market rebounded from the high and fell in the Asian session, and fell sharply in the afternoon, reaching the lowest level of 3116. This continuous decline basically bid farewell to the possibility of continuing to rise today. The watershed was broken in the morning, and there was no hope of breaking the high.
Today's continuous sharp decline is mainly due to the implementation of the tariff policy, buying expectations and selling facts, and the actual implementation of the news. Longs took profits.
The European session may rebound from the low sideways. In the evening, we will focus on the pressure of 3140-3150. If the intraday low of 3116 breaks, it may fall to 3100 again.
The more tests are made, the greater the probability of breaking. There have been three downward tests before. The breaking market will initially turn to short, opening up the space below. Focus on the big non-agricultural data tomorrow Friday.
The current gold price has risen again and again, and it has deviated from the technical structure, and the risk has increased accordingly. The market has repeatedly forced to rise. No one knows where the top is, and there is no previous high for reference. The risk area can be preliminarily judged by the increase. In short, don't be too arrogant, and stability is more important than anything else.
In terms of trading, the overall market of gold yesterday was in line with the expected judgment. The bullish market turned to shock and adjustment, with a range of 3138-3100. In terms of operation, I went short at 3131 in the morning, reduced my position at 3118, took profit at 3110, and earned 21 US dollars; I waited and saw whether it would break above 3138 or below 3100 in the European session; I went short at 3119 in the evening, and went up to 3130 with a light position and added shorts, and finally took profit at 3116-3117, earning a profit of 13 US dollars.

Trump's Tariff War! GOLD nears targetIn Asian trading on Thursday (April 3), the market's risk-off sentiment increased, boosted by Trump's wide-ranging tariff actions. Spot gold prices jumped to $3,167.77/ounce in early trading, up nearly $37 in a day and hitting a new record high.
OANDA:XAUUSD Continues to Rise as Trump Launches Tariff Campaign
The US Dollar fell sharply in Asian trading on Thursday, contributing to the boost in gold prices. The US Dollar Index is currently at around 103.050, down more than 60 points on the day.
On April 2, local time, the White House issued a statement saying that US President Trump declared a national emergency on the same day to enhance US competitiveness, protect US sovereignty, and strengthen US national and economic security. Trump declared this as America's "declaration of economic independence".
The statement said that Trump will impose a 10% "base tariff" on all countries, effective from 0:01 a.m. Eastern time on April 5. In addition, Trump will impose higher, personalized "reciprocal tariffs" on countries with the largest US trade deficits, effective from 0:01 a.m. Eastern time on April 9. All other countries will continue to adhere to the original base tariff of 10%.
Gold prices hit a new record above $3,160 an ounce after US President Donald Trump announced comprehensive “reciprocal” tariffs, imposing a minimum 10% tax on imported goods, raising concerns that this could trigger a global economic recession.
Investors have flocked to gold as concerns about the health of the global economy have grown. Gold prices have risen 20% this year after a strong rally in 2024, driven largely by central bank buying and strong demand in Asia.
AND IT WILL KEEP RISE AS FUNDAMENTAL SUPPORT IS ABSOLUTELY IN PLACE!
Technical Outlook Analysis OANDA:XAUUSD
On the daily chart, after approaching the target level of attention to readers in yesterday's publication at the price point of the 1% Fibonacci extension, there are temporary signs of cooling down, mainly this is considered a correction state after a shock increase.
In terms of trends, gold is currently being noticed by the short-term price channel, this is an uptrend in which the medium-term trend at the price channel is also an uptrend channel, in addition, EMA21 is also the current main support.
On the other hand, the Relative Strength Index (RSI) is also in an uptrend channel, which shows that gold is also in an uptrend in terms of momentum, and a signal for a possible downward correction in terms of momentum can only occur when the RSI folds downwards below 80.
As long as gold remains in the price channel, it is still in an uptrend in the short term, and the notable positions for the day will be listed as follows.
Support: 3,135 – 3,106 – 3,100 USD
Resistance: 3,172 USD
SELL XAUUSD PRICE 3171 - 3169⚡️
↠↠ Stoploss 3175
→Take Profit 1 3163
↨
→Take Profit 2 3157
BUY XAUUSD PRICE 3098 - 3100⚡️
↠↠ Stoploss 3094
→Take Profit 1 3106
↨
→Take Profit 2 3112

Gold trading zones: 03-APRIL-2025Today's Gold trading zones: For educational purposes only. Use at your own risk.

Ready to ride the wave? Here's everything you need to know!🚨 Calling all Traders!🚨
XAUUSD is making moves and breaking records like never before! Here’s your latest update:
🔻 Bearish Scenario: Watch out for a potential drop below the 3120-3114 range. If it dips, targets such as 3000 and 3090 are next in line. Keep an eye on these key support levels! 👀
🔺 Bullish Scenario: If price breaks above this range, expect buying opportunities to open up! Look for action above 3120 with potential targets at 3130 and 3943. 📈💥
💡 Risk Management** is everything! Protect your capital and trade wisely! 💰
Jump into the conversation and share your insights! Let’s ride this golden wave to success together! 🌟

2nd April for GOLD
Yesterday gold has seen making a significant move of bearish momentum. Close to 500pips drop from ATH.
3 scenarios that gold can do.
1.Sideways on the current support and resistance of 3100-3135 as seen in blue.
2. breaking above 3135 testing the current ATH ceiling and breaking it as HTF is still bullish.
3. breaking below 3100 heading to the fbo H4 3082-84 & daily breakout of 3049-57

Gold Rally Pauses, But Bullish Trend HoldsOngoing Risks Support Gold’s Long-Term Bullish Outlook
Despite recent market volatility, the drivers behind gold’s rally remain intact. Mohamed El-Erian raised U.S. recession odds to 50%, while Goldman Sachs raised theirs to 35%. The Fed has warned of slower growth and higher inflation due to tariffs, and gold's role as a hedge against these risks is vital.
Focus on Upcoming Data
Next week, key data will be in focus: the FOMC minutes on Wednesday, CPI report on Thursday, and consumer sentiment data on Friday. If CPI surprises to the upside or the FOMC minutes reveal a more dovish stance, gold could see renewed buying interest. Traders should view pullbacks as buying opportunities, as inflation, trade tensions, and recession risks continue to support gold.
Technical Outlook
If gold tests support at $3,000.28 and holds, it may attract new buyers. A break below could bring the $2,852.34 level into play. Shorting is risky, but if pursued, exit over $3,167.84 with objectives at $3,000.28, $2,852.34, and the 52-week moving average at $2,601.40.

XAUUSD H4 MARKET OUTLOOKXAUUSD traded and closed at $3036 level. From the intraday perspective, I anticipate a further drop in the first few days of coming week. Up to $2999.29 and then, possibly to a new support level of 2924.28.
Fundamentally , the recent NFP report which came better than expected will make Gold to decline on a short-term. Making its first pullback for the year after trading an all time high price of 3140

Has gold peaked and turned bearish? Trend analysisGold will focus on the impact of non-agricultural data. At that time, there will be large short-term fluctuations. In the 4H cycle, the weak shock will remain below the middle track. The upper pressure will remain at 3118 and 3135. The short-term weakness will also be accompanied by repeated detours. Therefore, the rebound will be mainly shorted, and the lower support will remain at 3080 and 3055.
Recommendation: Short gold near 3135, stop loss at 3143, target 3120, 3110!

XAUUSD / GOLD | 15M | BULL | SCALPING TIMEHey There My Friend
SIGNAL ALERT
🚨BUY ( GOLD & XAUUSD ) 3091,0 / 3078,0 / 3066,0 / 3053,0
🟢TP1: 3093,0
🟢TP2: 3096,0
🟢TP3: 3156,0
🔴SL: 3043,0
High Risk - Yüksek Risk
Hey Guys, Please don't forget to like 🙏🏻

XAUUSD 1H, 03/04/2025, 07:00AM.I believe it's a great opportunity to capitalize on the recent upward movement in XAUUSD and to take advantage of a favorable selling setup in the near future.

Sorry, I'm going short gold.This 1-hour Gold (XAU/USD) chart presents a Head and Shoulders pattern forming near the 3,124 level, indicating a potential bearish reversal. The structure consists of:
Left Shoulder – A peak followed by a retracement.
Head – The highest point in the formation.
Right Shoulder – A lower high, confirming the pattern.
Additionally, a Quasimodo pattern is forming, reinforcing bearish sentiment if price fails to sustain above 3,139. A breakdown below the neckline suggests a potential move toward the projected target zone at 3,039.
Key Levels & Trade Plan
📍 Resistance: 3,139 (Quasimodo level)
📉 Support Levels: 3,107 – 3,085 – 3,039 (Main target)
📊 Bearish Confirmation: Break below the neckline (~3,120)
🎯 Target Zone: 3,039
A clean breakdown below the neckline could accelerate bearish momentum, aligning with the projected drop of approximately 62.7 points (-2.02%). Bulls need to reclaim 3,139 for any invalidation of this bearish outlook. Keep an eye on price action confirmation before entering trades.

Let's Go For Long #Gold#XAUUSD Let's Go long Here..
Potential Upward Move #GOLD
Use Money Management..

XAU/USD "The Gold" Metal Market Heist Plan (Scalping/Day Trade)🌟Hi! Hola! Ola! Bonjour! Hallo! Marhaba!🌟
Dear Money Makers & Robbers, 🤑💰✈️
Based on 🔥Thief Trading style technical and fundamental analysis🔥, here is our master plan to heist the XRP/USD "Ripple vs U.S.Dollar" Crypto Market. Please adhere to the strategy I've outlined in the chart, which emphasizes short entry. Our aim is the high-risk Green Zone. Risky level, oversold market, consolidation, trend reversal, trap at the level where traders and bullish robbers are stronger. 🏆💸Book Profits Be wealthy and safe trade.💪🏆🎉
Entry 📈 : "The heist is on! Wait for the MA breakout then make your move at (3095) - Bearish profits await!"
however I advise to Place sell stop orders above the Moving average (or) after the Support level Place sell limit orders within a 15 or 30 minute timeframe most NEAREST (or) SWING low or high level.
📌I strongly advise you to set an "alert (Alarm)" on your chart so you can see when the breakout entry occurs.
Stop Loss 🛑: "🔊 Yo, listen up! 🗣️ If you're lookin' to get in on a sell stop order, don't even think about settin' that stop loss till after the breakout 🚀. You feel me? Now, if you're smart, you'll place that stop loss where I told you to 📍, but if you're a rebel, you can put it wherever you like 🤪 - just don't say I didn't warn you ⚠️. You're playin' with fire 🔥, and it's your risk, not mine 👊."
📌Thief SL placed at the nearest/swing High or Low level Using the 1H timeframe (3140) Day/Scalping trade basis.
📌SL is based on your risk of the trade, lot size and how many multiple orders you have to take.
Target 🎯: 3030 (or) Escape Before the Target
🧲Scalpers, take note 👀 : only scalp on the Short side. If you have a lot of money, you can go straight away; if not, you can join swing traders and carry out the robbery plan. Use trailing SL to safeguard your money 💰.
XAU/USD "The Gold" Metal Market Heist Plan (Scalping/Day Trade) is currently experiencing a Neutral trend (there is a chance to move bearishness),., driven by several key factors.👇
📰🗞️Get & Read the Fundamental, Macro, COT Report, Quantitative Analysis, Sentimental Outlook, Intermarket Analysis, Future trend targets.. go ahead to check 👉👉👉🔗
⚠️Trading Alert : News Releases and Position Management 📰 🗞️ 🚫🚏
As a reminder, news releases can have a significant impact on market prices and volatility. To minimize potential losses and protect your running positions,
we recommend the following:
Avoid taking new trades during news releases
Use trailing stop-loss orders to protect your running positions and lock in profits
💖Supporting our robbery plan 💥Hit the Boost Button💥 will enable us to effortlessly make and steal money 💰💵. Boost the strength of our robbery team. Every day in this market make money with ease by using the Thief Trading Style.🏆💪🤝❤️🎉🚀
I'll see you soon with another heist plan, so stay tuned 🤑🐱👤🤗🤩

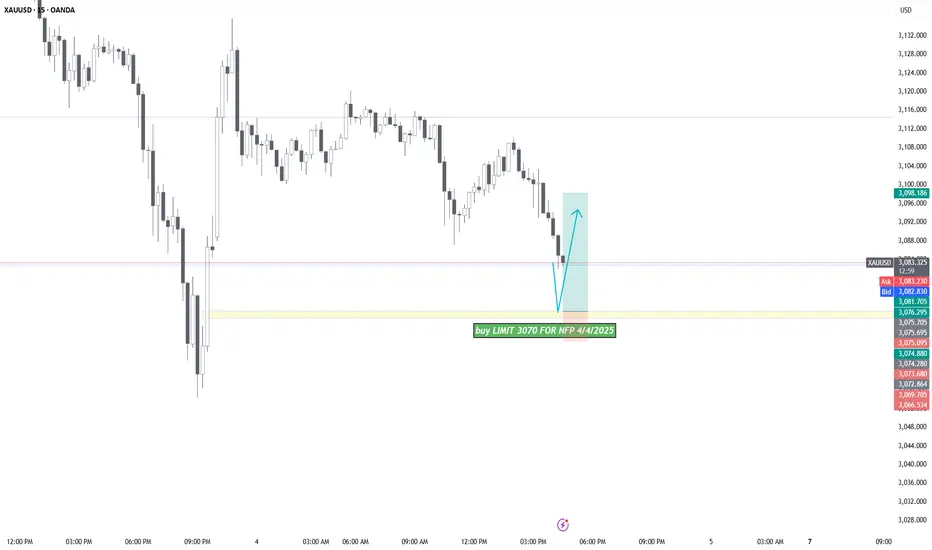
GOLD BUY LIMIT 3070Targeting 3070 for BUY LIMIT , Target 250pips tp and 50pips sl.
Check the market and conditions during news, This would be a high risk setup
XAUUSD sell Again, this is a “parental advisory” just ahead of the main event for this Wednesday. With the primary tailwind for the Goldrush set to be officially announced, the “buy the rumour, sell the fact” rule of thumb should be considered. The risk could be that once the reciprocal tariffs take effect on Wednesday, only easing due to profit-taking in Gold could occur once separate trade agreements and partial unwinds take place.
XAUUSD sell 3133
Support 3121
Support 3116
Support 3107
Resistance 3150

XAUUSD - Short Trade Confirmations :
1. Strong Bearish structure
2. 1H Strong resistance
3. AMD Cycle (Accumulation, Manipulation, Distribution)
4. Liquidity Sweep in 15m
5. CHoCH
6. Targeting the Demand
7. BE at FVG 50%
8. Expecting a bullish move from the demand zone or the FVG zone
Thanks for your time..

GOLD Will Fall! Short!
Please, check our technical outlook for GOLD.
Time Frame: 8h
Current Trend: Bearish
Sentiment: Overbought (based on 7-period RSI)
Forecast: Bearish
The price is testing a key resistance 3,035.98.
Taking into consideration the current market trend & overbought RSI, chances will be high to see a bearish movement to the downside at least to 2,937.76 level.
P.S
The term oversold refers to a condition where an asset has traded lower in price and has the potential for a price bounce.
Overbought refers to market scenarios where the instrument is traded considerably higher than its fair value. Overvaluation is caused by market sentiments when there is positive news.
Disclosure: I am part of Trade Nation's Influencer program and receive a monthly fee for using their TradingView charts in my analysis.
Like and subscribe and comment my ideas if you enjoy them!

Maintain bearish trend awaiting US NFP news✍ ✍ ✍ Gold news:
➡️Gold extended its correction ahead of Friday's Non-Farm Payrolls release, falling below $3,100 as markets remained volatile. Investors remained uncertain about the direction of the market following Trump's retaliatory tariff announcement. Meanwhile, gold continued to face profit-taking pressure while seeking support for its recovery.
Personal opinion:
➡️ With the upcoming NFP news, gold prices are expected to remain in a short-term downtrend zone pending this important news.
➡️Analysis based on important resistance - support zones and Fibonacci combined with trend lines and SAM to come up with a suitable strategy
Resistance zone: 3112– 3133 -3165
Support zone: 3079 - 3067 - 3058
Plan:
🔆Price Zone Setup:
👉Buy Gold 3077- 3079 (Scalping)
❌SL: 3074| ✅TP: 3082 – 3085 – 3090
👉Buy Gold 3058- 3060
❌SL: 3053| ✅TP: 3065 – 3070 – 3080
👉Sell Gold 3108 - 3110 (Scalping)
❌SL: 3115 | ✅TP: 3104 – 3100 – 3096
👉Sell Gold 3033- 3035
❌SL: 3140 | ✅TP: 3128 – 3122 – 3115
FM wishes you a successful trading day 💰💰💰

XAUUSD:Wait for Nonfarm Payrolls to boost upward trendOn Thursday, the price of gold plummeted by $110 initially. Subsequently, it rebounded from $3,054 to $3,135, surging by nearly $80. This was a typical market scenario of a double whammy for both bulls and bears in a washout. Whether it was those who chased long positions at high levels or those who chased short positions expecting a pullback, they all suffered losses. The level of $3,054 witnessed a perfect conversion from a top to a bottom.
Today, when it comes to the resistance levels of gold, there are two key positions to focus on. One is the morning's high point at $3,120, and the other is the high point of the pullback at $3,135. As for the support levels below, we should pay attention to $3,080 and $3,065. There will be a market movement influenced by the Nonfarm Payrolls data tonight. It is expected that before the release of the data, the price will fluctuate within a range above and below $3,100, which serves as the demarcation line. When the price surges, look for a pullback towards $3,100; when it dips, look for a rebound towards $3,100. It is recommended to mainly take long positions at low levels. Tonight, we need to pay attention to whether the Nonfarm Payrolls data will help gold prices rise again.
Here, I would like to caution all traders once again to protect their accounts. Wait until the washout of both bullish and bearish forces is over before resuming trading!
Trading Strategy:
buy@3080
TP:3110
Sell@3135
TP:3100
Get daily trading signals that ensure continuous profits! With an astonishing 90% accuracy rate, I'm the record - holder of an 800% monthly return. Click the link below the article to obtain accurate signals now!

4.4 Analysis of gold short-term operation strategy!!!On Thursday (April 3), spot gold experienced a surprising volatility, with a single-day fluctuation of nearly $114, and the price of gold finally closed down.
Analyze the technical outlook of gold intraday.
The 4-hour chart of gold shows that the price of gold is trading below the currently flat 20-period SMA, but it is still well above the bullish 100-period SMA, which provides support near $3040/oz. At the same time, technical indicators have recovered from near oversold readings and stabilized within negative levels. If the price of gold falls below the above-mentioned $3040/oz area, the price of gold may fall sharply.
Support: $3086.70/oz; $3073.90/oz; $3061.10/oz
Resistance: $3123.10/oz; $3136.70/oz; $3150.00/oz

GOLD - 1H UPDATEGold last night climbed up to our resistance zone of $3,162 - $3,174 & rejected nicely, dropping down 800 PIPS so far!
Perfect rejection from our Wave 5 resistance zone. This impulse move down is a strong indication of a reversal.

XAUUSD - market structureXAUUSD - market structure, short position, use risk and trade managment for capital protect
