Gold with Technical aspect XAUUSD Gold Update | M15 Timeframe 🙌
- This Analysis is based on educational purposes using Technical aspect
In M15 time Frame we have been observed that market bias is in bullish
- We have been waiting for our point at 3320 - 3314.00 as a Good Buy opportunity on behalf of Technical Analysis ❗️
If the body closing below the trendline on H4 Timeframe we will definitely share our thoughts
Although our targets would be 3364 - 3384.00
- All you need to stick with one Mentor 👋
#XAUUSD
GOLD.PRO.OTMS trade ideas

Gold’s upside seems limited given overbought conditionsGold appears to be showing signs of finally cracking after an impressive run higher, with the excitement surrounding its rally potentially approaching a crescendo. The precious metal experienced a sharp intraday reversal on 22 April, a decline that continued into 23 April. Since the recent uptrend began in mid-March, gold has consistently found support at its 10-day exponential moving average (EMA).
For now, gold continues to hold just above this key support level; a break below the 10-day EMA could signal a heightened risk of further declines, potentially targeting $3,280 per troy ounce.
Gold remains extremely overbought on the weekly chart, trading above the upper Bollinger Band, with the relative strength index (RSI) above 80. This suggests that gold could be due for a sideways consolidation or pullback towards the 10-week moving average at $3,100.
Gold also remains overbought on the monthly chart, trading above the upper Bollinger band and with an RSI above 85. In this scenario, a break below $2,900 may lead to a decline towards the 10-month moving average of $2,800.
It is not often that an asset class trades at such extreme levels, and this suggests that gold may be overdue for a period of consolidation, either by trading sideways and marking time or by pulling back to retest some of the moving averages situated at lower levels. It continues to indicate that overall gold’s upside may be limited.
Written by Michael J Kramer, founder of Mott Capital Management
Disclaimer: CMC Markets is an execution-only service provider. The material (whether or not it states any opinions) is for general information purposes only and does not take into account your personal circumstances or objectives. Nothing in this material is (or should considered to be) financial, investment or other advice on which reliance should be placed.
No opinion given in the material constitutes a recommendation by CMC Markets or the author that any particular investment, security, transaction, or investment strategy is suitable for any specific person. The material has not been prepared in accordance with legal requirements designed to promote the independence of investment research. Although we are not specifically prevented from dealing before providing this material, we do not seek to take advantage of the material prior to its dissemination.

XAUUSD Higher Potiential to SellHNS Forming in H1, H4
CHOCH in m5, pull back to fvg then buy for a short time
but mostly aiming for BOS and retracement then Sell at fvg

Gold Price ActionHey traders! 👋 Looking at the current structure, gold has been respecting the bearish trend perfectly — with each flag pattern breaking down as expected.
🔴 We're now seeing a pullback into a key supply zone and the setup is shaping up for a potential short opportunity.
Let the market come to you, no need to chase 🙌
Manage your risk wisely 📊
Wishing you all green pips and solid setups! 💰✨
Happy Trading! 🔥

GOLD POSSIBLE SELLTarget reached
We are in the battle of increase in tariff
Be careful how you trade, only if you understand price variation

Daily live trade with XAUUSD in 15m/30m/1h 20250423Daily live trade with XAUUSD in 15m/30m/1h 20250423

GOLD (XAU/USD) – 30-Min Long Trade Setup !🟡 🟢
Pattern: Falling wedge breakout + bullish reclaim
📊 Trade Plan – Long Position
✅ Entry: $3,388 (Breakout and retest of wedge + yellow support reclaim)
✅ Stop-Loss: Below $3,360 (under wedge base & recent wick low)
✅ Target Zone:
🎯 TP1: $3,440 – First structure resistance
🎯 TP2: $3,473 – Upper resistance zone (wedge origin)
📐 Risk-Reward: ~1 : 2.5+ (approx.)
📌 Highlights:
Bullish breakout from falling wedge
Strong reclaim of horizontal support (~$3,388 zone)
Entry confirmation shown with candle close above wedge + yellow line

XAUUSD Weekly ViewGold prices have soared to a new record high of $3,500 per ounce, fueled by a weakening U.S. dollar and escalating concerns over Federal Reserve policies and trade tensions. The dollar index has fallen to 98.164, prompting investors to seek refuge in gold as a safe-haven asset. This surge reflects a strong bullish sentiment, with traders buying into the rally despite traditional overbought indicators.
- Analysts are now eyeing a potential temporary pullback for gold and profit taking.


XAUUSD Eliot correction wave pattern on the daily timeframe Watch out for XAUUSD Eliot correction wave pattern on the daily timeframe

Gold price breaks through a new high of 3500 and enters the key Gold price hit a new record high of 3500. After reaching this point, it showed obvious pressure and went down to find the 3461 area. This is the largest correction since the rise of 3284 last Thursday.
Today's early trading price also continued to rise and break through the new high, but there was an episode, that is, it first broke through the high of 3444, then fell sharply to 3412, and finally confirmed the strong rise at 3418 to break through the new high, and continued to break through the sprint
Until noon, it sprinted to 3495 and suppressed the decline to find 3473 support, and then pulled up again to sprint to break the high of 3500. This time the decline was relatively strong, falling to the 3461 area
So far, the rising process can be slightly slowed down and enter a wave of adjustment
Accumulate momentum to provide power for the next round of start-up
During the adjustment process, pay attention to the golden section line
This wave from Since the rise from 2970, the largest adjustment squat is 0.382, and now this position is 3417, which is close to the Asian market acceleration starting point 3418. The two together become the stabilizer of the bullish trend: 0.382 position 3417 area
This is the first focus of today. During the adjustment process, pay attention to the position of the golden section line
0.382 position is 3417, close to the acceleration starting point
0.500 position is 3391, close to the 3384 area along the channel line
0.618 position is 3366, close to the four-hour lifeline
The current price space is large and the speed is fast. Articles and analysis are only auxiliary, and are more temporary reminders. Plans cannot keep up with changes. The three key points mentioned above can be kept in mind. If there are price variables during the process, they can also be adjusted accordingly.

Final upward push and then a possible correctionGold may likely try to touch the 3450,3470, and possibly 3500 marks as it is in a strong bullish trend. Price action persisted in going past the 3430 point, as it was the current all-time high, which may lead the price to further continue its upward trajectory. However, the bullish trend may correct after having risen for some days and weeks. A correction is bound to okay depending on where the price rising pressure stalls.

CHECK XAUUSD ANALYSIS SIGNAL UPDATE > GO AND READ THE CAPTAINBaddy dears friends 👋🏼
(XAUUSD) trading signals technical analysis satup👇🏼
I think now (XAUUSD) ready for(SELL)trade( XAUUSD ) SELL zone
( TRADE SATUP)
ENTRY POINT (3460) to (3458) 📊
FIRST TP (3452)📊
2ND TARGET (3444) 📊
LAST TARGET (3435) 📊
STOP LOOS (3468)❌
Tachincal analysis satup
Fallow risk management

Gold prices soared, how to arrange transactions during the dayDuring Asian trading hours, international gold prices maintained record gains, reaching a maximum of 3,495, as U.S. President Trump criticized the Chairman of the Federal Reserve and concerns that trade tensions could hinder economic growth drove demand for safe-haven assets. After yesterday's surge of nearly 100 US dollars and breaking through the 3,400 mark, the price of gold further climbed over 80 US dollars during the day, reaching a maximum of 3,494, with an intraday increase of nearly 2%.
Judging from the current trend, gold prices seem to be breaking through the 3,500 mark just around the corner. However, it should be noted that this wave of market sentiment is mainly driven by market sentiment and has broken away from the framework of traditional technical analysis. For investors, in such extreme conditions, it may be a safer choice to stay on the sidelines. In particular, we must avoid blind short selling. In the current upward trend, short selling is undoubtedly an extremely risky operation.
The technical moving average radiates upward, the technical indicators continue to rise, and the bullish signal is clear. After the 4H chart reached a new high, the top divergence of technical indicators intensified, and gold is currently experiencing a technical correction. The upper resistance is currently blocked at 3500-3510, while the lower part needs to pay attention to the 3455 first-line watershed. For intraday operations, it is still recommended to focus on retracement and long positions, and wait patiently for key positions to enter the market.
Intraday operation suggestions:
buy 3455-3555
TP 3500-3520
Radical brothers go long at 3470
If you agree with this point of view, or you have a better idea, please leave a message in the comment area. I look forward to hearing different voices.
OANDA:XAUUSD CAPITALCOM:GOLD FOREXCOM:XAUUSD FX:XAUUSD

GOLD TODAY OUTLOOKXAU/USD – 30-Minute Technical Setup
Gold has been gliding upward, respecting a clean ascending structure, printing higher highs with strength. But as price taps into the $3,242–$3,267 supply zone, momentum begins to fade.
A potential rejection here signals a structural shift. If the trendline breaks, we could see a clean move down toward the $3,176 demand zone, with $3,203 acting as soft interim support.
This setup reflects precision and patience , anticipating a transition from bullish strength to calculated bearish correction, with a balanced risk-to-reward approach.
Confirmation is very important.
Always use stoploss for your trade.
Always use proper money management and proper risk to reward ratio.
This is just my analysis.
#XAUUSD 30M Technical Analysis Expected Move.

XAUUSD (Gold) Looks Strong Bullish .Hello Guys Here is My XAUUSD (Gold) Signal Update .
Gold Will Continue Its Bullish Trend Currently Its running at 3425-20 I can expect if its breaks 3452-53 it will Fly to 3480-3485
Gold Can Retrace From Support Area.
Boost And Comments On my ideas And Share your feedback About it.

XAUUSD (GOLD)The new Target Price To XAUUSD (GOLD) $5000 Its amazing Traget And The New All Time High

Interpretation of gold US market operation ideas! ! !Gold continued to be bullish in the morning, and the 3400 mark has been broken. How will it evolve next?
The US dollar index directly fell on Monday morning, and the US Y index fell by more than 8% this year, causing gold to rise in a variable. The rise in gold caused by this situation will be greatly adjusted due to the recovery of the US dollar! The key to winning or losing tonight lies between 20 and 22 o'clock.
If the US stock market opens, it will fall below the 98 mark due to the southward movement of the US dollar, creating a new low since April 2022! The market's trust in the US dollar as a global reserve currency has declined! The possibility of turning to other safe-haven assets has increased, thereby increasing the variable of gold rising.
If based on this logic, tonight's 20-23 o'clock cycle is the main winning or losing day of this week!
Hypothetical principle: If it is postponed to the north during the day, everyone should pay attention to the selling pressure near 3415. As the price changes, the selling pressure is more likely to occur! And the defense line will rise in each round of corrective retracement!
Short-term defense line: 3355-3370-3383-3392
Pressure level above: 3430-3458
Risk notice: 1. When everyone is paying attention, long positions may fall at any time, and the range will not be less than 50-80 points!
2. The decline of the US dollar index will lead to a collapse in futures, which will trigger a chain reaction. Traders will face the possibility of gold settlement to fill the gap in other markets!

XAUUSD/GOLD: Gold remains offered below 3300Gold gave up Thursday’s gains and fell back toward the 3260 per troy ounce level by the end of the week, as improving market sentiment — driven by hopes for positive progress in the US-China trade dispute — weighed on safe-haven demand.
The overheated gold rally appears to be due for further cooling. Traders seem to be buying into rumors that a trade agreement between the US and China could be reached soon, even though China has publicly refuted those claims. The risk is that markets may be misreading the US’s language regarding whether the two sides are merely "talking" or actually "negotiating," which could mean that a deal remains far off — potentially leading to another move back toward 3500.
From a technical perspective, the daily Pivot Point at 3335 is the first key upside level that needs to be regained. Early in Friday’s session, there was a brief attempt to test the R1 intraday resistance near 3381. Should momentum continue, gold prices could extend the rally toward the R2 resistance at 3414, breaking above the 3400 mark.
On the downside, the S1 support was briefly breached this morning, but price action has since recovered back above it at 3302. Below that, the S2 support at 3256 comes into focus, followed by the key technical floor near 3245, which aligns with the April 11 high.

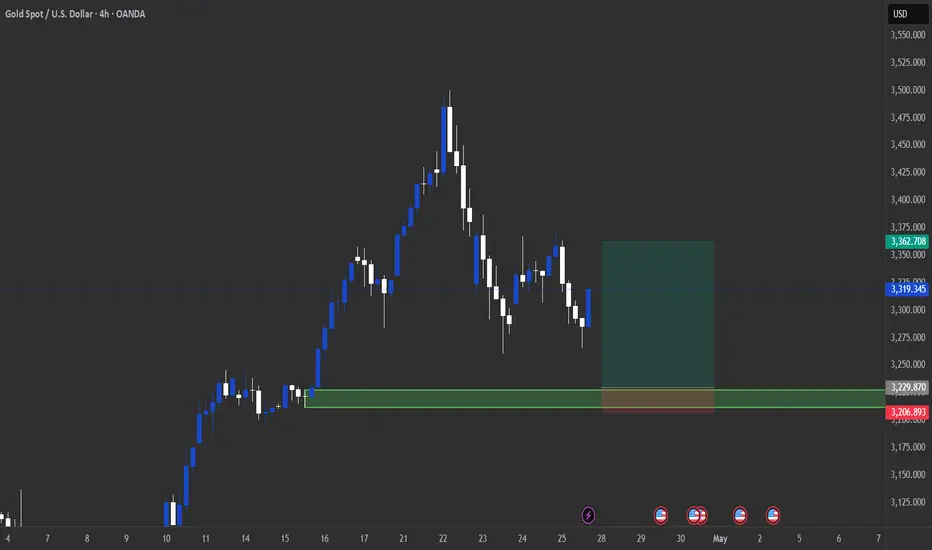
XAUUSD Potential Demand zone Long playIdeas on this one? potential long play off the demand zone marked in the chart
Oscillatory tradingA conflict has broken out between India and Pakistan in the Kashmir region, and attention should be paid to whether the situation will escalate. This is a geopolitical event with a greater influence than the Russia-Ukraine conflict. The combined total population of Russia and Ukraine is less than 200 million, while the total population of India and Pakistan exceeds 1.6 billion! At the same time, pay attention to the dynamics of the Federal Reserve, the peace talks between Russia and Ukraine, the negotiations between the United States and Iran, as well as the situations involving Israel and Palestine, and Syria, etc. There was a large explosion at a port in Iran, leaving hundreds of people injured and dozens dead.
In view of the tariff remarks made by Trump on our country over the weekend, it has provided support for the gold bulls. The conflict between India and Pakistan and the explosion at the Iranian port have also provided support for gold. Therefore, there is a pattern that the gold price in the Boya market is likely to rise on next Monday. As for whether the decline pattern can continue after the rise, before this pattern is broken, we should assume the continuation, and adjust our thinking once it is broken. After this week's large-scale fluctuations in the gold market, next week the price is inclined to rise sharply at first and then fall back. However, considering the fundamental news, the gold bulls have a greater advantage. In fact, there is some contradiction between the fundamentals and the technical aspects! Therefore, in terms of operation, with such large-scale fluctuations, there are opportunities for both long and short positions, but neither long nor short positions should be chased blindly.
If the gold market opens normally on Monday morning, we can first take a long position. If it gaps up, do not chase the rise. Pay attention to the resistance level and consider taking a short position. If the price falls, as long as the support level between 3260 and 3270 is not broken, a long position can still be taken. Once this support level is broken, implement risk control and consider following the short position in the direction of the trend!
If your current gold trading performance is not satisfactory and you hope to avoid detours in your investment, you are welcome to communicate and exchange ideas with us!

Analysis of the latest trend of gold prices: 3280-3360Analysis of the latest trend of gold prices: 3280-3360
Gold prices have fluctuated violently recently, with the rise and fall of one day equivalent to the rise and fall of the past few months.
This has greatly increased the difficulty of trading. At the same time, it also magnified the leverage and profit and loss opportunities of the trading account.
As shown in Figure 4h:
The current gold price range fluctuates widely: 3280-3360
The market maintains a triangular oscillation pattern. Gold prices gradually rebounded after the trend line support, and the medium- and long-term bullish trend began to emerge.
Short-term upper key suppression: around 3360
Continued rise further strengthens the bullish signal.
Support level: focus on the 3260-3290-3300 line
If it stands firm, it will look up to the 3350-3360 area;
It is expected that Monday will show a wide range of fluctuations, and the overall range will remain at 3370-3260. After breaking through this position, you can follow up and do more.
Repeated sweeps are still the main theme, and there is no clear direction signal.
The upper pressure level is around 3350-3360. If the rebound continues at the opening of next week, pay attention to this position. If it breaks through, pay attention to 3370-3380.
The lower support level is 3288 and 3260. The operation is mainly based on shocks, and try to participate in band operations near key positions.
Operation suggestions:
Gold is long near 3290
Stop loss: 3280
Target: 3325, 3240!
If the upper 3248 pressure is not broken, you can short in the opposite direction!

Weekly Analysis for gold chart XAU/USDTrade Ideas:
1. Bearish Setup (if price stays below resistance zones)
Sell Zone: 3350–3377 (Daily + 4H resistance cluster)
Entry: Look for bearish candlestick patterns (like engulfing, pin bars) around 3350–3370.
Stop Loss: Above 3377 (safe distance, maybe 3385).
Take Profit 1: 3275 (Day support)
Take Profit 2: 3265–3243 (next support zones)
2. Bullish Setup (if price holds support and shows strength)
Buy Zone: 3265–3276 (4H and Day Support)
Entry: Wait for bullish confirmation (strong bullish candle, or bullish divergence).
Stop Loss: Below 3260 (like 3255 or lower).
Take Profit 1: 3337–3350 (Minor resistance)
Take Profit 2: 3377 (4H resistance top)
Notes
Watch carefully
If 3265 breaks cleanly, expect a deeper drop toward 3005–3024 (Weekly support).
If 3377 breaks strongly, bulls could push toward 3424–3435 or even 3503 (Monthly resistance).
Volume confirmation is important — watch for increasing volume on breakouts.
Use EMA 50/200 crossovers for intraday confirmation if you scalp.
