XAUUSDGold is experiencing a pullback from its recent peak.
The daily chart shows a higher high and, higher low, suggesting limited bearish potential.
GOLD.PRO.OTMS trade ideas

XAUUSD: 1/4 Today's Market AnalysisGold technical analysis
The resistance of the daily chart is 3160, and the support below is 3060
The resistance of the 4-hour chart is 3150, and the support below is 3110
The resistance of the 1-hour chart is 3150, and the support below is 3120
The surge in safe-haven demand has stimulated gold prices to break new highs every day. Trump plans to announce the details of auto tariffs on April 2 (without exemption clauses), global trade war concerns are heating up, and gold ETF holdings have increased to historical highs. MACD bullish momentum has weakened; RSI has entered the overbought zone, follow the trend and buy at the support level, but be wary of short-term corrections.
Please refer to the following two options for buying plans:
1. Wait for a breakthrough to buy: If it breaks through and stabilizes at 3150 US dollars again, the next target is 3160-3180 US dollars.
2. The safe strategy is to buy back at the support level: If it falls back to the 3110-3120 US dollar area and a stabilization signal appears, it is best to have a reversal signal on the 30-minute chart, and you can buy with a light position.
If you participate in counter-trend selling, please set a smaller SL to prevent the gold price from rising straight up due to the news!

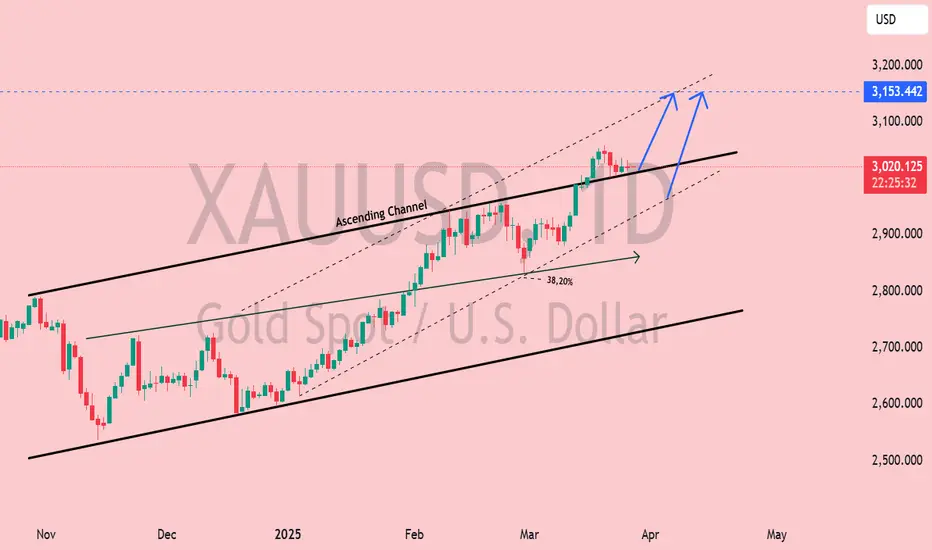
XAU/USD Gold Bullish Momentum – Targeting $3,153+?📊 XAU/USD Daily Analysis – Bullish Continuation in Ascending Channel
🔹 Market Structure & Trend Analysis
Gold (XAU/USD) remains in a well-defined ascending channel, respecting both dynamic support and resistance levels. The trend remains bullish, with higher highs and higher lows forming since late 2024. Currently, price is trading near the upper boundary of the channel, suggesting strong bullish momentum.
🔹 Key Technical Levels
Resistance Zone: $3,153 – $3,200 (potential breakout target)
Current Price: $3,020 (holding above key mid-range support)
Support Levels:
Channel Midline Support: ~$2,980
38.2% Fibonacci Retracement: ~$2,900 (potential corrective zone)
Channel Bottom Support: ~$2,700 (strong demand area)
🔹 Bullish Scenario 🟢
A break and close above $3,153 would confirm a bullish breakout, opening the door for a rally toward $3,200 and beyond.
Momentum remains strong, with price structure favoring continued upside as long as it stays above the midline of the channel.
🔹 Bearish Scenario 🔴
Failure to break above $3,153 could trigger a short-term pullback toward $2,980 - $2,900, where buyers may re-enter.
A confirmed breakdown below the ascending channel would invalidate the bullish setup and expose $2,700 - $2,600 as potential downside targets.
🔹 Conclusion & Trade Considerations
Bias: Bullish as long as price remains inside the ascending channel.
Entry Considerations: Retest of $3,020 - $2,980 as support could offer a high-probability long setup.
Breakout Confirmation: A daily close above $3,153 strengthens the bullish case for continuation.

gold buy signal. Don't forget about stop-loss.
Write in the comments all your questions and instruments analysis of which you want to see.
Friends, push the like button, write a comment, and share with your mates - that would be the best THANK YOU.
P.S. I personally will open entry if the price will show it according to my strategy.
Always make your analysis before a trade

xauusd analysisGold prices experienced a sharp decline today, dropping to a three-and-a-half-week low. The move was driven by a combination of global macroeconomic concerns, investor behavior, and technical market dynamics.
🔍 Key Reasons Behind the Drop:
Global Trade Tensions Intensify
A major escalation in the U.S.-China trade war rattled markets. The U.S. announced new tariffs, and China retaliated with export restrictions on rare earth elements. This sparked broad risk-off sentiment across global markets.
Panic-Led Liquidation
Despite being a traditional safe haven, gold was sold off as investors rushed to cover losses in other risk assets. This often happens during periods of extreme volatility when liquidity becomes a priority.
Hawkish Fed Comments
Fed Chair Jerome Powell made comments suggesting the central bank might delay rate cuts due to persistent inflation and trade uncertainties. This caused the U.S. dollar to strengthen, which typically puts pressure on gold prices.
📈 Technical Analysis:
Current Price: Around $2,962
Support Levels:
First support around $2,950
Stronger support near $2,930
Resistance Levels:
Immediate resistance at $2,970 (Target 1 in your chart)
Further resistance near $3,000 (Target 2)
Trend & Indicators:
RSI is approaching oversold, indicating a potential bounce.
The short-term trend remains bearish, with a series of lower highs and lower lows.
Volume spiked during the sell-off, showing strong momentum behind the move.
🧠 What to Watch Going Forward:
Any new trade developments between major economies.
Fed’s stance on inflation and interest rates.
Gold’s behavior around key support zones – bounce or breakdown?

4.8 Gold Bollinger Bands bearish signal appearsRecently, the spot gold price once fell below the psychological barrier of $3,000, triggering technical concerns in the market about whether the gold bull market has reached its peak. On Monday (April 7) in the North American session, spot gold is currently trying to recover to around $3,030, but the technical indicators have shown obvious divergence.
Fundamental analysis
The market's concerns about US inflation continue to ferment, and the intensification of global trade frictions is driving the market's concerns about economic stagflation. The Fed's policy stance has also undergone subtle changes. The market has begun to price in five possible interest rate cuts this year. The CME FedWatch tool shows that the probability of the Fed's interest rate cut in May has soared from 33.3% last Friday to 49.3%.
At present, traders are turning their attention to the US inflation data to be released this week, which will provide important clues for assessing the US economic situation.
Technical analysts' interpretation:
Bollinger band breakthrough signal indicates a short-term correction
On the daily chart, gold prices have formed a clear upward channel since mid-March, but recently touched the upper track of the Bollinger band and began to fall. It is worth noting that the middle track of the Bollinger Band 3006.13 has become a key support level. After breaking through the historical high of 3167.60, the price has shown a typical upward exhaustion pattern. The MACD indicator shows DIFF: 43.46, DEA: 48.65, MACD: -10.39, and the green kinetic energy column has begun to expand, indicating that the short-term downward momentum is accumulating.
RSI indicator shows overbought correction
The 120-minute chart shows that the RSI indicator has fallen from the overbought area to a neutral level of 40.37. At the same time, the CCI indicator has dropped to -45.05, further confirming the trend of short-term overbought correction.
Key support and resistance level analysis
The current gold price faces multiple technical resistances, among which 3055.00 and 3085.00 constitute the main resistance range for short-term rebound. The lower support levels are mainly concentrated at $3005.00 and $2971.31, and these two levels will determine whether the gold price can remain above the psychological level of $3,000. In particular, the $2971.31 level, as a recent low, may trigger a deeper adjustment if it is lost.
From the long-term daily chart, gold prices formed an accelerated upward channel after breaking through $2950.00. The recent high of $3167.60 is just at the upper track of the channel. This trend of peaking and falling is in line with the classic channel trading theory.
Outlook
Bull Outlook: If the US inflation data exceeds expectations, the market's expectations for a more aggressive rate cut by the Federal Reserve will be further strengthened, and gold prices are expected to re-challenge the high of $3167.60 after a correction. Technically, gold prices need to return to above $3055.00 to reactivate upward momentum. The widening of the Bollinger Band width indicates that volatility is increasing, which provides potential trading opportunities for bulls.
Bear Outlook: In the short term, the downward divergence of the upper track of the Bollinger Band indicates that gold prices may face further corrections. The MACD histogram turned green and continued to expand, suggesting that downward momentum is accumulating. If the gold price falls below the key support of $2,971.31, it may trigger a deeper adjustment, and the next target will be $2,950.00 or even $2,920.00.

XAUUSD:It has achieved gains in both long and short positionsDuring the daytime, shorting gold at 3045 and longing it at 3005 both reached the take-profit levels and reaped profits. It perfectly achieved gains in both short and long positions. Regarding the later market conditions, I believe that the resistance at 3040 for gold is quite crucial. If the resistance at 3040 cannot be broken through, then the market will still fluctuate repeatedly within the range, with the support level at the round number of 2970 below.
In terms of operation, it is now recommended to continue shorting gold at 3035, and then buy when it pulls back to the range of 2970-2980.
Trading Strategy:
buy@2970-2980
TP:3020
Sell@3035-3040
TP:3010
Get daily trading signals that ensure continuous profits! With an astonishing 90% accuracy rate, I'm the record - holder of an 800% monthly return. Click the link below the article to obtain accurate signals now!

GOLD NEXT POSIBLE MOVEHello Traders,
The market is currently trading within a range-bound zone, between the support and resistance levels of 3019 - 3042.
We recommend waiting for a clear breakout from this range before making any trading decisions:
🔹 Buy Setup: If the market breaks and closes above 3042, it will signal bullish momentum—we’ll look for buy opportunities.
🔻 Sell Setup: If the market breaks and closes below 3019, we’ll consider selling positions based on bearish confirmation.
⚠️ Risk Management Reminder: Always use a proper lot size to manage your risk effectively.
Stay disciplined and wait for confirmation!

Xauusd snr levels and 3 possible scenarios There are three scenarios that can play out on asia open. Since stocks and everything crashed yesterday, Monday will most probably be a selling day as well.
Scenario 1 : If xauusd rejects 3040 than price will go down to tap 3031 and if it closes below 3031 than I'm expecting blow down to test 20-00.
Scenaio 2 : if xauusd bounce from trendline and closes above 3040 than price will go up to tap first 3049 and if it closes above it than 3070.
Scenario 3 : if xauusd rejects 3048-3052 than it will go down to tap 40-31-22.

XAUUSD Higher Time Frame Analysis## 🔍 **# XAUUSD Higher Time Frame Analysis **
📉 **Last Friday’s Session Recap:**
Gold experienced a **sharp sell-off** following the release of the **NFP data**, which came out **strongly in favor of the US Dollar** 💵 — naturally putting pressure on gold prices 🪙.
📊 **Key Support Zone:**
On the higher time frame, the **$3033–$3000** zone stands out as a **major support** 🛡️.
➡️ As long as **this area holds**, the **overall bullish structure remains intact** for gold.
🌍 **Geopolitical Drivers:**
Current global tensions are adding fuel to the fire:
* 🇮🇷 Ongoing **conflict between Iran and the US** over the nuclear program.
* 🇺🇸 Ex-President **Donald Trump’s tariff war** continues to impact the US economy.
* 🇨🇳 **China's reverse tariffs** against the US are further weakening the Dollar.
🔼 All these factors are likely to support **gold and other physical commodities** in the near term.
🎯 **Upside Targets to Watch:**
* 🔹 First Resistance: **$3085**
* 🔹 Second Resistance: **$3112**
👉 Gold can **easily climb** these levels, but **potential rejections** may occur here — so caution is advised.
🧭 **If $3000 Breaks:**
* 📉 Immediate Support: **$2950**
* 📉 Strong Buy Zone: **$2920–$2880**
📈 **Bullish Breakout Confirmation:**
If we see a **daily candle close above $3115–$3120**, expect gold to aim for its **previous high at $3170** 🎯.
---
📅 I’ll be sharing the **Lower Time Frame Analysis** shortly to zoom into these key zones. Stay tuned! 🔔

Gold Outlook: Bearish Drop to 2,960 Before Bulls Return?Gold Weekly Forecast – April Week 2
Last week, Gold (XAU/USD) reached a new all-time high at $3,168, before closing the week near $3,035, printing a strong bearish weekly candle.
Despite the current risk-off sentiment in global markets — with the VIX spiking to 29 — Gold is not behaving like a safe haven just yet. Instead, the technicals suggest a pullback is necessary.
There is a clear imbalance and untested support zone around $2,960, which price has yet to revisit.
Primary Scenario:
• Gold may open the week with a bullish bounce toward $3,070
• Then reverse with a sharp bearish leg down to $2,960
• From there, we reassess — Gold could react strongly and resume its bullish trend, or continue correcting deeper.
Bias: Bearish → Bullish (if $2,960 holds)
Key Levels:
• Resistance: $3,070
• Support: $2,960 (main zone to watch)
This scenario matches both the technical need for a pullback and the macro confusion around gold’s role as a safe haven this week.
—
Weekly forecast by Sphinx Trading
Drop your thoughts in the comments.
#Gold #XAUUSD #GoldForecast #TechnicalAnalysis #SphinxWeekly #SafeHaven #VIX #Commodities #MarketOutlook

Falling gold has taken support at rising channalFalling gold has taken support at channal with attempt of reversal. If it breaks this support, it will show free fall. Investors feels gold is overpriced as compared to equity market and trading at big margin from production cost of gold.

Gold 3000 bullish and bearish watershedMarket Status Analysis
The gold market showed a correction trend this week. The continuous decline of the big negative line made the short-term trend bearish, but from the overall pattern, it is still too early to assert that the trend has reversed. The current market is at a critical technical node, and the long and short sides are fighting fiercely near the important support level.
Technical analysis
Weekly level analysis
The overall bullish structure remains intact, and this week's correction can be regarded as a normal technical correction
The 5-week moving average 3000 mark constitutes an important support, and the 10-week moving average provides additional support
The first negative line after four consecutive positive lines on the weekly line is in line with the characteristics of a healthy technical correction
As long as the key psychological level of 3000 is not lost, the medium-term bullish trend remains unchanged
Daily level observation
The short-term bearish signal of Yin-enclosing Yang appears
Although the price broke below the short-term moving average and pierced the middle track of the Bollinger band, it eventually closed above the middle track
The long lower shadow shows that the low-level buying power is strong
The short-term still has the momentum to pull back and test the 10-day moving average
4-hour cycle characteristics
The Bollinger band opening extends downward, indicating a short-term downward trend
The K-line closed negative continuously, and the bears have a short-term advantage
Focus on the defense of the 3000 integer mark
Key price prompts
Upper resistance: 3042 (initial resistance) → 3058 (key resistance (Strong resistance) → 3072 (strong resistance)
Support level below: 3026 (short-term support) → 3015 (important support) → 3000 (lifeline support)
Operation strategy suggestions
Long-term layout strategy
Ideal position building area: 3015-3020 range
Strict stop loss setting: below 3000
Target price: 3040-3050 area
It is recommended to hold long positions with protective stop loss
Short-term opportunities
Short-term short positions can be considered when rebounding above 3050
Stop loss must be strictly set
Quick entry and exit operation is recommended
Risk control points
If it effectively falls below the 3000 mark, it may trigger a deeper correction
It is necessary to pay close attention to the trend of the US dollar and changes in market risk sentiment
Major economic data may change the current technical pattern
It is recommended to operate with a light position and strictly control the risk of a single transaction
Outlook for the future market
Although there are short-term adjustment signals, gold is still under the control of bulls as a whole. The 3000 integer mark will become a watershed between long and short positions, and if it holds this position, the bullish view will be maintained. Suggestions for investors:
Keep buying on dips above 3000
Pay close attention to the defense of key support levels
Flexibly adjust positions to cope with market fluctuations
Strictly follow risk management principles

Gold reaches the dynamic supportGold has been overbought technically, which was visible from RSI (it was flashing the overbought conditions positioning above the 70 point line), Bollinger Bands (price was spiking above the 2 standard deviation zone), and the price action: after the initial breakout, it was rapidly sold off not holding the buying pressure anymore.
So, the most expected scenario was probably a consolidation or a correction. As we see now, the scenario of correction was triggered.
As Gold served both as a protection, and as a growth vehicle, it's difficult to assume the further liquidation. The most expected scenario would be a bullish pivot and locking in a consolidation, as shown at the chart.
Don't forget - this is just the idea, always do your own research and never forget to manage your risk!

Key Observations: Elliott Wave CountThe chart shows a completed five-wave impulse structure, labeled from (1) to (5).
The final wave (5) has ended, with sub-waves i, ii, iii, iv, v marked within it.
This suggests that the impulsive bullish trend is over.
Bearish Reversal Indicated:
There is a strong downward movement after wave (5), confirming a possible trend reversal.
Potential Targets for the Decline:
Price has already begun declining from around $3,110.
The first major support areas could be around $2,900–$2,800, based on previous price action.
Deeper corrections could bring the price toward $2,600–$2,500.
Key Levels to Watch:
Resistance: The previous high near $3,160 is critical. If the price breaks above, the bearish scenario might be invalidated.
Support: Watch $3,000 as a psychological level. A break below would confirm further downside.
Conclusion:
The chart signals a potential correction after a strong uptrend.
The bearish wave count suggests a move lower toward key support zones.
Traders should watch for confirmation with momentum indicators and volume.

Bear I see gold going down right now, it has a engulfing bear at a key level on the 4hr , it broke my counter trend line . So I'm watching to see what it does when it breaks this consolidation.

Potential XAUUSD Bullish Continuation Trade IdeaHere is a potential XAUUSD bullish continuation trade idea.

GOLD-SELL strategy 12 Hourly GANN fanThe metal is moved higher from the minor correction it under went, and by no means this suggest we have not see the overall correction, is my personal viewpoint. Currently, we are still quite overbought, but short term indicators suggests still buying presence, and this keeps it moving up, or remaining in the higher realms.
For now I remain SELL (SHORT) based on RSI, negative divergence we currently are facing as well.
Strategy SELL or ADD @ $ 3,140-3,185 and take profit in stages: 1. @ $ 3,030 and 2. $ 2,978.

XAUUSD SHORTXAUUSD short again, 9yr high for Gold and still holding on to my shorts. another day, another entry. Setting my position at 3138 // TP 3000 SL 3238
A lil discouraged with the current rallies, however, this is what trading is like, you take your L's, gather your emotion, recalculate and execute again(when you're less emotional). Sticking to my Short positions because I believe that this will reverse, it may take a while but im willing to wait. Setting my TP to my previous target to cover previous losses and SL a lil bit further to secure my positions. This isnt a trading or financial advice but my personal trading plan. Let's see how this trade rolls.
Day 14of100
L:5
W:1

#GOLD #IDEA #GOLD #IDEA To day we will looking for buy base on M15 and H1 STR BUt need to make it clear this week a lot of going on in economic so be safe in this situation we will use M3 for confirm BUy from here

Gold is about to set a new ATHGOLD INFORMATION:
Gold prices surged to a record high above $3,100/ounce, marking one of the strongest rallies in the precious metal's history. The upward momentum is driven by multiple factors, including increased safe-haven demand due to concerns about the impact of upcoming US tariff policies, strong demand from central banks, expectations of Federal Reserve (Fed) interest rate easing, geopolitical instability in the Middle East and Europe, and increased capital flows into gold-backed exchange-traded funds.
Additionally, investor demand for gold is rising sharply, as evidenced by increasing inflows into exchange-traded funds, with weekly inflows reaching their highest levels since March 2022, signaling a rush into the precious metal.
BRIAN's Personal Commentary:
The context of everything from technical to political and economic factors is supporting gold price increases in the first quarter of 2025. Gold prices are likely to achieve their highest growth rate in history.
Gold Setup:
XAUUSD BUY ZONE 3133-3130
SL: 3126
TP: 3135-3137-open
Technical Analysis:
Based on technical indicators EMA 34, EMA89 and support resistance zones to establish reasonable BUY orders.
IMPORTANT NOTE:
Note: Brian wants traders to manage their capital well
- Use appropriate lot sizes according to your capital
- Take profit at 4-6% of account capital
- Cut losses at 2-3% of account capital

Gold Intraday Trading Plan 3/3/2025Gold didn't break 3010 support yesterday and has formed a rising triangle as shown. This pattern is a sign of continued bullish trend.
I will buy today and 1st target is 3162, final target is 3178.
