Buy Gold As anticipated for Sells..
And was fully achieved 📈
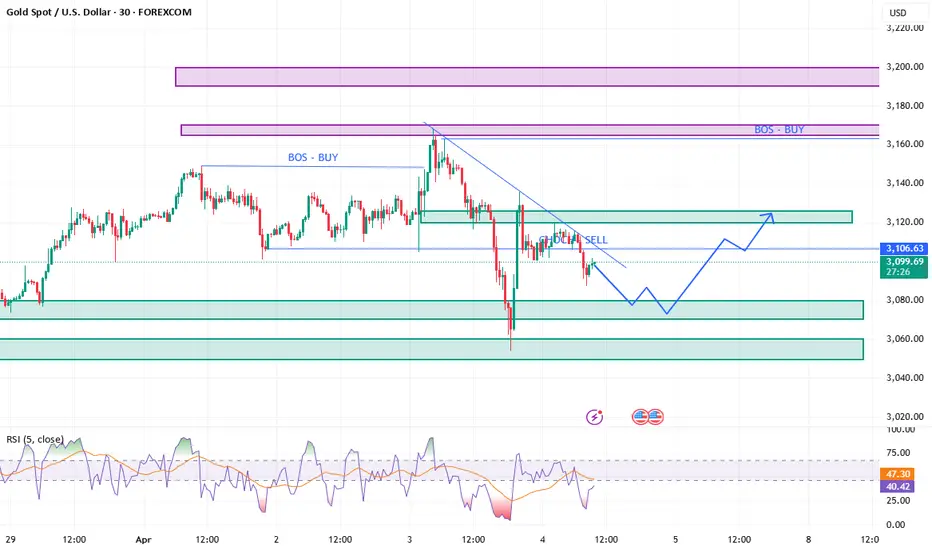
I see gold Buying and of there is any market shift/Choch,we still watch and play according to how price react.
As for now,let's buy gold 🥇
GOLD.PRO.OTMS trade ideas

GOLD BUY SCALP EDUCATIONAL BREAK DOWN FOR LEARNERS LIVE TRADEGold prices are accelerating their daily decline, steadily approaching the critical $3,000 per troy ounce mark as the Greenback's rebound gains extra momentum and US yields tighten their retracement.

Gold Long Setup. DBearish Divergence on Daily Timeframe
FOllowing Channel perfectly
Expected ENtry 3k
TP 31.5K
SL 29.5K

gold after the inertviez of jerome todayAs of April 4, 2025, gold prices have experienced significant volatility amid escalating trade tensions and market uncertainties. Following President Trump's announcement of new tariffs and China's subsequent retaliation with 34% tariffs on U.S. goods, investors have increasingly turned to gold as a safe-haven asset. This surge in demand propelled gold prices to record highs, surpassing $3,130 per troy ounce

Gold Market Eyes 3140 Liquidation Amid Bullish Trend CorrectionGold market remains on a bullish stance as it eyes liquidation at 3140. After reacting to 3120 and retracing to mitigate 3088, the market now poises for a bullish trend correction. Momentum builds for the next breakout or retracement—stay sharp as price action unfolds! follow for more insights . comment , and boost idea


Detailed Explanation Of The Current Gold Market Analysis1. Market Structure & Technical Setup
Recent technical charts for gold (XAU/USD) indicate that the price has been forming a pattern characterized by higher highs and higher lows. This type of price action suggests that, despite periods of consolidation, there is an underlying bullish trend. Notably, a shorter-term moving average (such as the 20-period SMA) appears to be acting as a dynamic support, helping to cushion short-term price declines. In contrast, longer-term moving averages (like the 100 SMA and 200 SMA) provide a broader view of the trend and help traders confirm the overall bias of the market.
In technical terms, the market has been consolidating around key support levels—for example, areas observed near price levels such as ~$2,985, ~$3,000, and ~$3,015. At the same time, resistance levels exist around the ~$3,030–$3,060 region. This consolidation phase is often interpreted as the market preparing for a potential breakout upward, particularly if the price successfully breaches these resistance levels.
2. Fundamental Drivers
On the fundamental side, gold remains significantly influenced by global economic factors:
Given these factors, even though technical indicators point to a bullish trend over the longer term, short-term fluctuations can occur due to shifts in economic data or geopolitical events.
3. Trading Implications & Caution
For traders, the current analysis suggests a cautiously optimistic outlook on gold. The consolidation phase near key support and resistance levels might signal an imminent upward breakout. However, it’s important to note:
Conclusion
In summary, the current gold market analysis reveals a market that is technically poised for upward movement, with a bullish long-term cue indicated by higher highs and higher lows, and critical support levels offered by dynamic moving averages. Yet, one should remain cautious due to possible short-term volatility fueled by economic and geopolitical events. By complementing technical analysis with fundamental insights, traders can form a more balanced view and make informed decisions.
If you’d like further discussion on how to integrate this analysis into a trading strategy or need additional insights on specific technical indicators, we can dive deeper into those aspects as well.
XAUUSD retracement for the long to another ATH📝 Key Observations:
Break of Structure (BoS) - Price recently broke previous support levels, indicating a shift in market direction.
Strong Bullish Momentum - The aggressive move up suggests that buyers are stepping in at the demand zone.
H1 Supply Zone - Price is currently reacting to an H1 supply zone, which may cause a pullback.
M15 Demand Zone - A key support area around $3,055 has been marked, where price may revisit before continuing upward.
Bullish Projection - The red arrow suggests a potential retracement into the demand zone before continuing higher.
📌 Trade Consideration:
✅ Entry Opportunity: If price retraces into the M15 demand zone and shows bullish confirmation (e.g., engulfing candles, wicks rejecting lower prices).
✅ Target: The next significant resistance level around $3,147.
✅ Stop-Loss: Below the M15 demand zone ($3,055) for a good risk-to-reward ratio.
⚠️ Risk Factors:
If price fails to hold at the demand zone, further downside movement is possible.
Supply zone rejection could trigger a deeper correction before continuing up.

4-hr Gold: Targeting $130 Upward Momentum Gold is undergoing a correction, as investors take profits to offset losses from falling stock prices, impacting their margins. However, we anticipate a renewed wave of buyers entering soon, given Gold's strong safe-haven appeal in times of market uncertainty.
From a technical perspective, Gold is approaching a key support level, and we see an opportunity to capitalize on the upcoming rebound. Our buy order is set at $3,070, positioned slightly above the 38% Fibonacci retracement level, which often acts as strong support in an uptrend.
For risk management, our take-profit (TP) is set at $3,200, aligning with the next resistance zone, while our stop-loss (SL) is 3% below the entry price, ensuring a balanced risk-reward ratio.
Considering current market dynamics, we expect bullish momentum to resume soon, as investors seek stability and protection against ongoing economic uncertainty.

XAUUSD (Gold) is bearish scenario on Daily until 2,940.00 quote Hello guys and welcome one more time to my detailed yet simple strategies to make profit out of any situation in forex,
So, another month, another strategy, in fact, a modified strategy which I hope works better than my other previous 2 trades with simplified strategy. Maybe, it was too simple.
Let's go to the chart though. Daily chart is bearish, as I can see so we go to 15 min chart and seek for opportunity to sell.
So, from now on the next level to touch is a resistence point from March 25, 2025 which became a sort of support which is 3,070.00 and the next one stronger is 3,058.00.
So, let's see what happenes next.
You, what do you think?

Gold price is above 3130, long at low priceGold price is above 3130, long at low price
As shown in the figure
12345 form channel changes respectively, and the trend accelerates upward
Principle:
Trends are abstract
So we draw specific channel lines to intuitively feel the trend
You can see that the channel angle reflected by 1-5 is constantly expanding.
The reflected gold price trend: emotions are getting stronger and stronger
The gold price trend is about to get out of control
Let's now focus on analyzing the two triangle oscillation convergence patterns AB
Principle:
The end of the triangle convergence oscillation is the time to choose a new direction
Now, it has entered the end of the oscillation
So we can draw a conclusion
Gold prices may soar or plummet at any time
Then the existing strategy is to follow the trend
The simplest and most effective strategy is to use 3130 as support
Retreat to low prices and go long
Stop loss near 3130 (determine the stop loss based on your order ratio and the price effectively captured)
Once the gold price explodes in the future, breaking through 3200 is also a high probability event

Gold Market Surges to 3157 Amid Tariff Talks—3500/oz in Sight?Following the imbalance sweep to 3104, gold market sentiment shifts bullish as tariff concerns gain traction ahead of Trump’s policies. Prices now surge to 3157, with projections eyeing a potential climb toward 3500/oz. Will the bullish momentum hold? follow for more insights , comment for more , and boost idea .


There may be a downward adjustment today!Yesterday, gold fell under pressure at 3150 and then tested the 3100 mark again in the evening, breaking the previous trend line that had been rising for several days. The market gradually slowed down from strong bullish trend, and the daily line turned negative.
Don’t expect the market to turn to bearish and fall sharply at this point. The long-short conversion needs time to brew, and now it is still a bullish trend, so the probability of forming a volatile trend here is relatively high, with a range of 3138-3100. Only when it breaks below 3100 can we see the market turning to bearish.
If the daily line is just a single negative correction, it will not change the overall upward trend. It depends on whether it can continue to close negative today.
The previous trend line support broke and turned into a pressure line, basically coinciding with the 3135-3138 pressure line. This morning's three consecutive positive waves just touched it. The key depends on the performance of the European session:
If the European session suppresses the decline and weakens, then the third test of 3100 may break.
If the European session continues to strengthen and break through 3138, it will also hit the high point of 3148-3149
In terms of trading,
1. Directly push up and break the high, aggressively chase long at 3132, stop profit at 3145;
2. Continue to buy after falling back to 3133, stop loss at 3125 if the callback is too large
3. The European session rebounded several times but failed to maintain sideways, lightly short at 3132 in the evening, and automatically stop profit at 3110 around midnight.

#GOLD Buy 3121.46#GOLD Buy 3121.46
SL 3115.46
TP 3123.46
TP 3131.46
TP 3145.46
Trade at your own risk
Protect your capital
The Wizard 🧙♂️
TUESDAY 04/01/2025 08:30 PM EST

Gold breaks the cyclical rhythm!The current trend of gold will depend on two major catalysts; the minutes of the Fed's March meeting on Wednesday: if the minutes suggest an open attitude towards interest rate cuts, it may push gold prices to test the $3050-3070 range; on the contrary, if the inflation stickiness is emphasized, it may trigger long profit-taking. Progress in trade negotiations: Any substantive implementation or easing of tariff policies may trigger fluctuations of more than 5% in gold prices.
In the medium term, the upward trend of gold has not been broken. The current global central bank's demand for gold purchases is still at a historical high, and the relative attractiveness of interest-free assets will continue to stand out in the downward cycle of interest rates. If the technical side breaks through $3057, it will open up space for the impact of the previous high; the defense strength of the $2950-2930 area should be closely watched below.
There is no obvious sign of a turning up on the 4-hour moving average of gold, and the short volume of gold is still there. If gold rises to the upper resistance of the previous box shock near 3028 in the Asian session today, it is expected that gold will be under pressure and fall back. The overall idea today remains high.
Investment strategy:
Buy gold at 2980, target 3000
Sell gold at 3000-3010, target 2950

Gold Intraday Trading Plan 4/9/2025Yesterday good retraced further to 3020 and dropped from there. I am seeing further downside momentum but also reversal possibility. If we have a 4hrly bullish bar, we may see short term bulls picking up.
Therefore, I am monitoring closely on these two levels 3000 and 2960. Will act accordingly on price actions there.

Xauusd Chart M30 Timeframe XAUUSD GOLD update | M30 Timeframe 🙌
- This Analysis is based on educational purposes using Technical aspect ❗️
- By Using Technical Analysis we are observing that market is in bearish ways after a massive drop market able to retrace 500+ Pips
- We are expecting that potential bearish momentum is at 3025 - 3030.00 area and the region above which is showing as a Resistance level at 3041.00
Targets are shown in charts at 2994.64 if break that point further 2970.00 so on at 2940.00
#XAUUSD

GOLD BEST PLACE TO BUY FROM|LONG
GOLD SIGNAL
Trade Direction: long
Entry Level: 3,008.04
Target Level: 3,136.65
Stop Loss: 2,921.80
RISK PROFILE
Risk level: medium
Suggested risk: 1%
Timeframe: 12h
Disclosure: I am part of Trade Nation's Influencer program and receive a monthly fee for using their TradingView charts in my analysis.
✅LIKE AND COMMENT MY IDEAS✅

4.8 Interpretation of gold short-term operation ideasGold price has fallen below the previous row support band in the daily trend. The K-line continues to be under pressure from the short-term moving average and maintains a weaker trend of shock. In the short term, pay attention to the pressure band around 3030. In the 4-hour level trend, the K-line is currently under pressure from the short-term moving average and is maintaining a low-level shock repair. The strength and continuation of the intraday rebound are not too large. Pay attention to the continued downward trend after a small break in the 4-hour level trend. At present, after continuous shocks in the small-level cycle trend, the technical pattern has begun to gradually adjust. The K-line has begun to slowly stand on the short-term moving average and tends to have a certain rebound space in the short-term trend. Pay attention to the short-term adjustment.
Operational suggestions:
Short near 3017-8, stop loss 3023.9, or long near 2945-6, stop loss 2939.1.
Real-time market intraday guidance.
We will update regularly every day to introduce to you how we manage active ideas and settings. Thank you for your likes, comments and attention. Thank you very much

#xauusd #Gold (April8)Levels where price reactions are most likely to occur during the day. Naturally, at each level, you can have buy and sell positions and you can freely use the levels for a new order or for TP of your postions. The levels are updated daily!
The results of price reaction to these levels will be shown in the upcoming videos.
You should note that the levels are based on price action knowledge, and no indicators are used to determine these levels. Therefore, the reaction ranges could occur a few pips above or below the levels marked on the charts!

Gold: Focus Remains on Buy-the-Dip Strategy
Gold witnessed another round of extreme volatility today, plunging below the 3000 level before quickly rebounding. Since then, the price has repeatedly tested support in the 3030–3018 range. So far, this support zone has held up well, suggesting buyers remain active at lower levels.
However, traders should keep a close eye on the 3047 resistance area, which may temporarily cap upward momentum. In the short term, the overall strategy remains focused on buying at lower levels, with the potential for prices to revisit the 3080 region in the coming days.
That said, due to the sharp price swings recently, caution is advised for those looking to chase the rally above 3040. Unless your account has sufficient margin and risk tolerance to withstand a potential pullback toward the 3000 level, it is not recommended to enter aggressively at higher prices.
Trading Strategy Summary:
Bias: Short-term bullish (buy-the-dip)
Support zone: 3030–3018
Resistance: 3047 (short-term), 3080 (medium-term target)
Risk warning: Avoid chasing above 3040 unless risk control is well in place
Stay agile, and adjust your positions according to intraday price action. I will continue to provide real-time updates as the situation evolves.

Gold operation strategyGold plummeted at the opening of Monday, reaching the lowest point of 2972, and then rebounded to 3055. We successfully placed a short order at 3052, and have already made a profit to the target. The hourly moving average of gold crosses downward and the short position is arranged, and it continues to open downward. So gold is now the home of the short position. Whether gold rebounds or continues to be short, gold is now in a short trend below the gap. We continue to pay attention to the short-term suppression at 3055.
From the 4-hour analysis, today's upper short-term resistance is 3055, and the lower line is 3000-3008. In terms of operation, the rebound pressure at this position continues to be short and follow the trend to fall. It is necessary to rely on the rebound to rely on 3055-60 to go short once, and the lower target continues to break the bottom.
Gold operation strategy:
1. If gold rebounds to 3055-3058, short it, stop loss at 3066, target 3015-3020, continue to hold if it breaks;
2. If gold falls back to 3000-3006 but does not break, you can buy it, stop loss at 2993, target 3045-53, continue to hold if it breaks
