XAUUSD : Accumulating around the peak areaGold prices today remain stable in the high zone around 3,330 USD. This precious metal is temporarily sideways due to the market entering the Easter holiday, but the upward momentum has not shown any signs of stopping.
Accordingly, geopolitical tensions, economic instability, and trade policies from the US continue to be supportive factors for gold during this period. The current resistance level is around 3,353 USD, while the nearest support zone is 3,300 USD.
Gold may correct slightly and accumulate momentum after the recent strong increase. We should wait for the price to return to important zones such as EMA 34, the support zone, or wait for the price to break the resistance zone to enter reasonable orders when the market is active again.
Prioritize trading according to the trend, everyone, don't forget to set full TP and SL to ensure safety.
GOLD.PRO.OTMS trade ideas

XAUUSD need some rest and fallWe are looking for dump asap here for gold price already broke resistance channel but i am expecting it will get back in channel and after that with high volume the dump expected to the targets like 2900$.
DISCLAIMER: ((trade based on your own decision))
<<press like👍 if you enjoy💚

Political and Trade Tensions Fuel Gold RallyGold surged past $3,460 per ounce on Tuesday, reaching a new record as demand for safe-haven assets intensified amid growing economic uncertainty. The rally followed President Trump’s renewed criticism of Fed Chair Powell, including remarks about his possible removal and calls for immediate rate cuts—raising concerns about political interference and Fed independence. Continued U.S.-China trade tensions, including a new probe into mineral tariffs, added to market anxiety. Gold is now up over 30% for the year.
Key resistance is at $3500, followed by $3,550 and $3,600. Support stands at $3400, then $3356 and $3300.

4H Gold (XAUUSD) chart 4H Gold (XAUUSD) chart
Let’s break it down:
🧐 Current Structure:
• Price has pushed up strongly (big bullish momentum).
• Now it’s consolidating after the strong move (small candles, indecision).
• No clear breakout yet after consolidation.
• Last strong push started from around 3200-3220.
• Current level: around 3327.
📈 Is there a Buy Now?
NO, not immediately now.
• The price is stalling (small candles = indecision = possible short pullback).
• Buying now would be chasing — risky because price might correct first.
🔔 Better buy plan:
• Wait for price to pull back to a strong support zone.
• Good buy area = around 3280–3290 (small pullback) or stronger at 3250 (deeper pullback zone).
• Look for a bullish 4H candle confirmation at those levels (like a pin bar or bullish engulfing).
📉 Can you scalp a Sell?
YES, but very carefully.
• You can scalp a sell IF price breaks below 3320 with momentum.
• Target = 3300–3290 area for scalping (small pullback zone).
• Be careful: overall trend is still bullish, so selling is short-term only!
🛡️ Scalp Sell Setup Idea:
• Sell break below 3320.
• Stop loss above 3335.
• Target 3300–3290.
🚨 Quick Strategy Summary:
Action Condition Target
Buy Pullback to 3280–3250 with bullish candle 3350–3380
Scalp Sell Break below 3320 3290–3300

GOLD → If you didn't catch the train, what should you do?FX:XAUUSD in a rally. Running into a train that is already in motion is prohibited due to the lack of ability to calculate risks. Ahead of the news, a correction is possible, which will allow us to find a place to trade
Gold continues to update an all-time high on the back of expectations of retail sales in the US and the speech of Fed chief Powell. Price growth was supported by strong data from China, increased demand for “protective assets” due to geopolitical tensions and trade risks between the U.S. and China. Additional support was provided by forecasts of gold price growth from ANZ to $3,600 by the end of the year
Technically, the psychological zones of interest 3325 - 3350 are ahead, from which a correction may form. The ideal scenario is to wait for a correction to local or intermediate support levels and only there look for an entry point.
Resistance levels: 3318, 3335, 3350
Support levels: 3275, 3265, 3244
On the background of a strong bull market it is worth using as a productive strategy to trade on the breakdown of resistance in order to continue growth, but in this case we need to wait for consolidation, we do not have it.
Or wait for correction, support retest and only then consider buying.
Regards R. Linda!

Gold price in MayGold prices are moving through the price channel with positive news from the US and China continuing to increase trade tensions. Markets are afraid that Trump will continue to make economic decisions that affect the market, Gold is now King

Weekly Analysis on Gold Its been a strong bullish movement since from the last 2 weeks so for next week trading session i will focus on looking for buying trade opportunities.

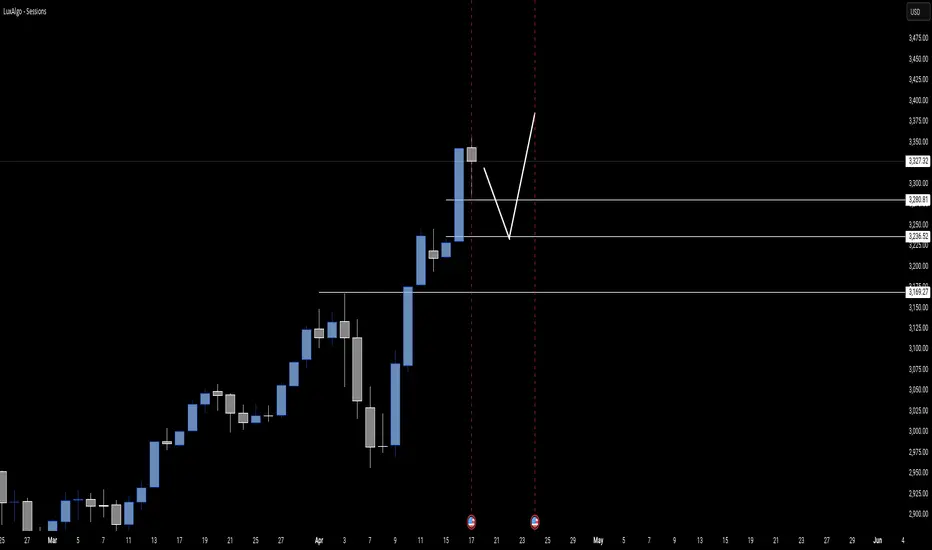
Little more up for goldHi traders,
This is what I've said last week in my outlook: next week we could see a correction and more upside for this pair.
And I drew an arrow for the target. Now check the chart.
This is the power of wave analysis in combination with liquidity sweeps and FVG's!
For next week we could see a little more upside (finish grey wave 3) and after that a bigger correction for (grey) wave 4.
Let's see what price does and react.
Trade idea: Wait for a change in orderflow to bullish. After an impulse wave and a small correction down on a lower time frame you could trade (short term) longs.
If you want to learn more about trading FVG's & liquidity sweeps with wave analysis, please make sure to follow me.
This shared post is only my point of view on what could be the next move in this pair based on my technical analysis.
Don't be emotional, just trade your plan!
Eduwave

Will Gold pullback at 2.618 % ?On the way up, Gold is respecting Fibonacci ratios. Will it pullback at 2.618 %, especially since it is very extended on weekly timeframe?

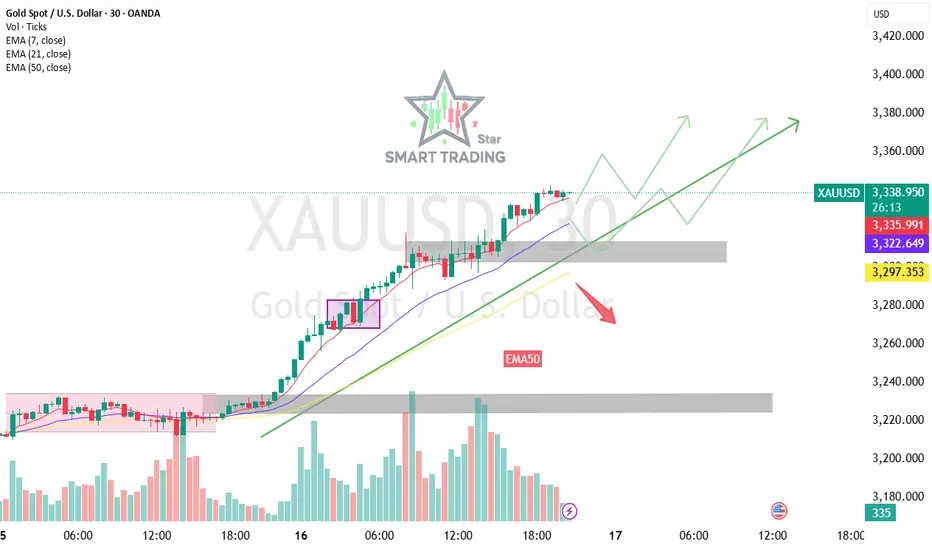
Bullish Momentum Intact (XAUUSD) LongTrend Overview: Bullish Momentum Intact
- **Current Price:** $3,336
- **Trend Direction:** Strong uptrend – higher highs and higher lows
- **Key Moving Averages:**
- EMA 7: $3,334.49 (price above – short-term momentum bullish)
- EMA 21: $3,320.83 (supportive base)
- EMA 50: $3,295.57 (strong trend support)
Bullish Scenario (Green Arrows)
- Price remains above EMAs and the rising trendline.
- Potential pullbacks may test the **support zone** near $3,320–$3,295 (gray area).
- If buyers defend the support, price could aim for **$3,360–$3,380** and beyond.
- Breakouts above local highs can signal continuation of the uptrend.
Bearish Risk (Red Arrow)
- A breakdown below **$3,295 (EMA50)** and the gray support zone could signal a trend shift.
- Downside targets could be **$3,260–$3,240** in case of heavy selling pressure.
- Watch for volume spikes on bearish candles.
Conclusion
As long as price stays above the trendline and 50 EMA, bulls remain in control. Any dips into the gray zone could present **buy-the-dip** opportunities. But a break below $3,295 flips the bias to short-term bearish.
Gold consolidates at high levels, focus on key breakthroughsThis week, the gold market showed a trend of rising and falling. Under the influence of the Federal Reserve's interest rate decision, spot gold hit a record high of $3,357 per ounce and then fell back, eventually closing at $3,327, still recording a 2% increase on a weekly basis. The market was closed on Friday due to Good Friday, and trading was relatively light.
Fundamental analysis:
The Fed keeps interest rates unchanged, Powell's stance is dovish, weakening the trend of the US dollar
The situation in the Middle East remains tense, and safe-haven demand supports gold prices
Global central banks continue to buy gold, and physical demand remains strong
The US economic data is mixed, and the market's expectations for rate cuts are repeated
Technical analysis:
Daily level:
The rising channel remains intact, and the moving average system is in a bullish arrangement
RSI has fallen from the overbought area and is currently in the neutral to strong area of 63
3357 forms a short-term top, and 3280 forms the first support level
4-hour level:
MACD shows a top divergence signal, and there is a need for short-term adjustment
The 3300 integer mark has become a watershed between long and short positions
The Bollinger Bands have begun to close, indicating that a direction will be chosen soon
Key price levels:
Resistance levels: 3357 (historical high), 333 7 (yesterday's high)
Support level: 3300 (psychological barrier), 3280 (Thursday's low), 3250 (trend line support)
Next week's outlook:
If it stands above 3300, it is expected to test the resistance of 3357 again
If it falls below the support of 3280, it may drop to the 3250 area
3400 US dollars is the next key psychological barrier
Operation suggestions:
The aggressive ones try to go short with a light position at 3337-3342, stop loss above 3350, and target 3315-3300
The conservative ones arrange long orders at 3280-3285, stop loss below 3273, and target 3315-3340
Break through 3357 and follow the trend to go long, target 3380-3400
Risk warning:
Pay attention to the development of the situation in the Middle East
Pay attention to the speeches of Federal Reserve officials
Pay attention to important US economic data

Gold Weekly Summary and Forecast 4/19/2025Gold has been on the rise for consecutive 2 weeks. Currently it is at the final leg of Elliott wave. I am expecting serious correction to come next week.
Next week we should see price rise first and drop from around 3.4k. My optimal target next week will be 3172.
Take note gold is super volatile. It can easily move more than 1k pips one day.
Let's go down to smaller TF for better order next week.

THE KOG REPORT - UpdateEnd of day update from us here at KOG:
Good day to have away from the markets as nothing has really happened on Gold since the London session. We did say support 3210 needs to break, and it's given numerous opportunities to take the red box trades, apart from that nothing exciting compared to recent PA.
We have a slight break here with resistance 3230 above which is likely, we want to see if they can break through and attempt that 3250-55 region shown on the chart. We're accumulating so we can expect a breakout, lets see how that level reacts if it gets there.
Not much more to report on.
As always, trade safe.
KOG

Gold Strategy: False Alarm, Bottom BounceOn Thursday, after hitting a record high of $3,357.66, the spot gold price pulled back, and the bulls and bears are engaged in a fierce battle. The pressure of short - term profit - taking is emerging, but the fundamental support still exists, and the key support level will determine the future trend. The intensifying trade tensions between the United States and China have increased the demand for safety, keeping the gold price near its record high, and the upward trend is far from over.
In the short term, gold is likely to start a large - range oscillation again. It has begun a reverse - V trend in one hour. Gold will either start a large - range oscillation or make an adjustment. In the short term, without the support of bullish news, the short - term gold bulls may be under pressure. Since the international gold market is closed tomorrow, there is not much point in participating at present. Overall, for the current short - term operation of gold, it is recommended to focus on selling on rallies and supplement with buying on dips. In the short term, pay close attention to the resistance level of $3,315 - $3,320 above, and the support level of $3,285 - $3,270 below.
Investment itself doesn't carry risks; it's only when investment is out of control that risks arise. When trading, always remember not to act on impulse. I will share trading signals every day. All the signals have been accurate without any mistakes for a whole month. No matter what gains or losses you've had in the past, with my help, you have the hope of achieving a breakthrough in your investment.

Gold could potentially retrace back into this identified fvgGold could potentially retrace back into this identified fair value gap (FVG), and if it respects this zone as a point of interest, we may see a bullish reaction. This reaction could serve as a catalyst for the market to resume its upward trend and possibly form a new higher high in the process.
This is still a risk off warning sign.As much as you might want the gold versus silver to break down... instead it did the opposite, it broke out.
This is still a risk off warning sign.
Gold is vulnerable. Silver is vulnerable. Stock markets are vulnerable.


GOLD - SELL strategy 6-hourly chart Regression ChannelGOLD still remains on upside, and we have clearly seen this. However, I believe we will see a reasonable correction in the near term based on the fact we are way above the channel, and secondly we are heavily overbought for sometime. Yes, I can understand the fear that markets have, but is it this founded at any level is something I wonder. Anyway, it provides an opportunity to add to shorts we have.
Strategy SELL @ $ 3,325-3,365 or ADD (ensure leverage is manageable of course. I maintain for metals always a very low leverage). Profit on the way down @ $ 3,237 and follow by $ 3,178 for now.

Today's gold analysis strategyThe gold market has experienced significant price fluctuations and corrections. From a technical perspective, the overbought correction has already arrived. The price of gold has deviated significantly from its short-term moving average, strongly suggesting that a correction is needed to complete the technical adjustment. The current correction is not a simple unilateral decline.
From a fundamental perspective, the underlying support for gold remains rock solid. Geopolitical risks, especially the continued escalation of the tariff standoff, have maintained strong demand for safe-haven assets. Therefore, this price adjustment should be regarded as a typical correction following the previous sharp rise.
Buying price: 3290 - 3295
Target price: 3320 - 3330

Gold: Reversal Is Near
The impulse move in OANDA:XAUUSD COMEX:GC1! CAPITALCOM:GOLD TVC:GOLD AMEX:GLD appears to be complete. Several signals point to an imminent correction:
A five-wave structure is nearing its final leg
RSI is showing bearish divergence
Volume is surging at the top — a classic sign of distribution
The 3315–3350 zone is a risk area.
Expecting a pullback to 3200–3150, possibly deeper.

GOLD Resistance Cluster!
HI,Traders !
GOLD made a bullish
Rebound But has now hit a resistance
Cluster of the horizontal and
Falling resistance lines
Around 3335.31 area
From where we will be
Expecting a bearish move down!
Comment and subscribe to help us grow !

Major Life Update: I Left the United Nation to Trade Full TimeAfter 11+ years of working in some of the toughest crisis zones — Jordan, Turkey, Syria, Iraq, HQ Geneva, and Ukraine — I’ve officially stepped down from my role as Head of the Information Management Team for the Health Cluster – World Health Organization – Ukraine Office.
It wasn’t easy.
But it was time.
The pressure, the politics, the burnout… it all started to weigh too heavy. And somewhere along the way, I realized I wasn’t living — I was just surviving.
And with the recent UN funding cuts — especially following the decision by Trump to halt contributions — it became clear that working in the humanitarian system is no longer something I can rely on for long-term stability or financial security for my family.
Trading changed that for me.
It gave me space to think, to breathe, and to build something that’s mine. It taught me discipline, patience, and how to trust myself again.
So now, I’m stepping into a new chapter — full-time day trader.
Not chasing the noise. Just sticking to my setups, showing up every day, and trusting the process.
I’m sharing this here because honestly, everyone following me feels like my new big family — and to the good friends I’ve made in this community, thank you for being part of this journey.
This isn’t the end of the road. It’s a new one.
And I’m walking it fully awake this time.
Wish me luck, see you in the minds section :)
Moe,
#TradingLife #Mindset #DayTrader #Resignation #LifeShift #NewChapter #FinancialFreedom #SeeYouInTheMindsSection

3382 , next ATH number today, GOLD⭐️GOLDEN INFORMATION:
Gold price (XAU/USD) enters a phase of consolidation on Thursday, trading within a narrow range near its all-time high reached during the Asian session, as investors digest conflicting market signals. Stronger-than-expected US Retail Sales figures and hawkish remarks from Federal Reserve (Fed) Chair Jerome Powell have lent support to the US Dollar (USD), curbing some of gold’s upside momentum. Meanwhile, the upbeat sentiment across equity markets and mildly overbought technical conditions are prompting traders to remain cautious, limiting fresh buying interest in the precious metal for now.
⭐️Personal comments NOVA:
Gold price continues to increase today, the fomo still has no end, pay attention to the new ATH price zone 3382
⭐️SET UP GOLD PRICE:
🔥SELL GOLD zone : 3381- 3383 SL 3388
TP1: $3370
TP2: $3355
TP3: $3333
🔥BUY GOLD zone: $3302 - $3300 SL $3295
TP1: $3310
TP2: $3320
TP3: $3330
⭐️Technical analysis:
Based on technical indicators EMA 34, EMA89 and support resistance areas to set up a reasonable BUY order.
⭐️NOTE:
Note: Nova wishes traders to manage their capital well
- take the number of lots that match your capital
- Takeprofit equal to 4-6% of capital account
- Stoplose equal to 2-3% of capital account
