Big money coming? Here, NFP data XAUUSD Technical Analysis PredDXY forecast today
XAU USD forecast today
EURUSD forecast today
NFP Data Forecast: Xauusd buys SELV sales for mass profit! Your latest gold trade guide confidently during the production of this most important wages is not related to the farm. In this video you will receive technical analysis from XaUUSD experts and proven adjustments for XaUUSD sales. It breaks down how you interpret forecasts for NFP data, how it affects gold prices, and where the best opportunities are. Whether you're a day trader or swing, this video gives you real information to plan your trade and plan your risk management as an expert. Don't miss this opportunity to turn your data into profits ahead of the market. Now look, trade more intelligently and go ahead with the crowd!
#NFPDATAFORECAST
#xauusd
#GoldTrading
#technicalalyasis
#forexsignals
#GoldPrice
#daytrading
#swingtrading
GOLD trade ideas
Bullish Breakout to $4,060 TargetOn the daily chart, XAUUSD is forming a Symmetrical Triangle with a bullish breakout potential.
📍 Buy zone: Around $3,200 (strong support and point D of the pattern)
📍 Target: $4,060 based on breakout projection.
Quick Analysis:
Pattern: Symmetrical Triangle + ABCD Harmonic
Buy near strong support at $3,200
Big upside potential after breakout
Good risk/reward for medium to long-term trades

LIVE BTC/USD, XAUUSD TRADING, 02/08/2025 SIGNALS PRICE ACTION TRLive BTC/USD, XAUUSD TRADING, 02/08/2025 signal price action trading strategy

technical analysis- (xau-usd) (H1)This chart highlights a large symmetrical triangle formation, with an internal WXYXZ corrective structure blended with impulsive Elliott Waves (1)-(5). The price action is marked by key structural shifts: CHoCH, BOS, and EOH, signaling trend reversals and liquidity grabs.
📌 Price recently bounced off the ascending trendline, forming a potential wave (2) low, suggesting a bullish move into a wave (3) impulse.
🔼 Short-term target points to a revisit of the strong resistance zone around 3,400–3,410.
📊 Key Setup:
• Pattern: Symmetrical Triangle
• Wave Count: Corrective WXYXZ + impulsive structure in progress
• Signals: Bullish CHoCH + BOS confirmation
🎯 Trade Idea:
• ✅ Direction: BUY
• 🎯 Take Profit (TP): 3,400 – 3,410
• 🔻 Stop Loss (SL): 3,296
🔁 Sideways range compression sets up ideal conditions for short-term swing or breakout scalps.

The correction is quite surprise. What direction for GOLD price?✏️Quite surprised with the adjustment of gold at the end of the previous trading week. The rising price channel is still holding around the lower border of the price channel around 3316. A liquidity sweep and candle wick removal in this area is considered a good buying opportunity.
If h1 closes below this border, limit trading BUY signals until the bottom support of 3286. When the price can close the candle below 3316, gold will trade in a wide range and there is no main trend dominating the market.
📉 Key Levels
Support: 3316-3286
Resistance: 3372-3400-3418
Buy trigger: Reject and Trading above 3316
BUY DCA Break 3372
Target: 3400
SELL Trigger: Break bellow and Retest 3416
Leave your comments on the idea. I am happy to read your views.
The trend is clear, why do I choose to be firmly bullish on goldGold Trend Analysis: Yesterday, the gold market demonstrated strong upward momentum, opening near 3290 before falling slightly to a low of 3281 before fluctuating upward. Boosted by the non-farm payroll data, the gold market surged during the US trading session, reaching a single-day gain of 2.02%, reaching a high of 3363 and closing there. The daily chart formed a long bullish candlestick with a long lower shadow, forming a Morning Star pattern, reinforcing the bullish trend. From the perspective of the cycle structure, the daily level is clearly in the 5-wave upward stage, and the upward trend of the large cycle has not changed. At the indicator level, the daily MACD momentum column (the column below the zero axis) represents the short-selling momentum. Its "gradual shortening" means that the short-selling force is weakening and the downward momentum is gradually fading. It is a potential signal of stopping the decline or rebounding. KDJ is about to form a golden cross between 20-50, which is a signal that short-term bullish power is beginning to increase, and the overall trend is bullish.
The 4-hour level shows typical bullish characteristics: the moving average system is arranged in a bullish pattern, but there is a certain deviation between the short-term price and the moving average. The technical side needs to correct the deviation rate through a callback before continuing to rise. The short-term support below is focused on the line near 3330-3335. This position is both the relay support level in the previous rise and the intersection of the 4-hour moving averages MA10 and MA20, which has strong support strength; the short-term resistance above is focused on the line near 3370-3383. This area is a pressure-intensive area near the previous high point. If it can be effectively broken through, it will further open up upward space. A successful breakout would open up further upside potential. A breakout would further open up the 3400 mark.
For gold trading, the short-term strategy is to buy on dips. If the price pulls back to the 3330-3335 support level, consider entering a long position with a target of 3355-3365. If it reaches 3370-3380, consider a short-term short position with a target of 3350-3340.
"XAU/USD Gold Heist Plan | Pullback Entry for Big Bullish Move"🔐💰“GOLD HEIST PLAN UNLOCKED: Thief Trader’s XAU/USD Breakout Blueprint”💰🔐
by The Market Robber a.k.a. Thief Trader – Stealing Pips, One Candle at a Time!
🌍 Hey Money Makers, Market Hustlers, Robbers, & Chart Crackers! 🌍
Bonjour! Hola! Marhaba! Hallo! Ola! What's poppin'?
Welcome to another exclusive robbery plan crafted in pure Thief Trading style—built off technicals, fundamentals, market psychology, and a bit of outlaw intuition. 💸⚔️
This one’s for the GOLD DIGGERS – literally. We’re targeting XAU/USD for a high-voltage bullish heist 🎯💥. Stick to the plan, follow the chart, and you might just make it out with a sack full of pips 💰🔥.
🔓 THE SETUP: GET READY TO ROB THE GOLD MARKET
We're eyeing a LONG ENTRY, with clear intent to break past the consolidation zone and avoid the trap laid by the "market police" at the ATR barricade zone 🚨. This level is where overbought drama and bear claws are strongest – we slip in, grab the profits, and bounce before they know what hit ‘em.
🧠 Use caution: This level is filled with liquidity traps, reversals, fakeouts and retail bait zones. Classic Thief style means we know where the guards are sleeping and where the cameras don't reach. 🎥🔕
💸 ENTRY PLAN:
🟢 Entry Zone: Watch for a pullback to 3320.00 or above. Don’t jump early.
💡 Tactics:
Use Buy Limit Orders (DCA / Layered Entry Style)
Drop them in on 15min/30min swing levels – catch price slipping into liquidity
Confirm with minor structure breaks / order block retests
🔔 Set those alerts – the real move happens when the breakout candle hits.
🛑 STOP LOSS STRATEGY:
🧠 Pro Rule: No stop-loss before breakout.
Once breakout confirms:
🔴 SL Zone: Recent swing low (approx. 3280.00) on the 4H chart
🎯 Adjust SL based on:
Lot size
Order count
Risk appetite
You know the game: manage your risk like a pro thief—quiet, calculated, and fast on the getaway. 💨
🎯 TARGET ZONE:
🏁 TP Zone: 3490.00
⚠️ Escape earlier if the pressure gets heavy – smart thieves never overstay the job.
🧲 SCALP MODE:
Only scalp LONG SIDE – don’t get caught chasing shorts unless you're rich enough to burn your drawdown 🔥
🔐 Use trailing SL to secure bags while climbing the ladder.
🧠 FUNDAMENTALS & MACRO EDGE:
The Gold market is currently in a BEAR structure with hints of bullish reversal potential. This heist isn’t just technical – it’s backed by:
🌍 Global Macro Flows
💼 COT Reports
📰 Sentiment & News Risk
💣 Geo-political Heat
📊 Intermarket Analysis (Dollar, Yields, Risk-On/Off correlations)
Dig deep for the full macro breakdown. Knowledge is leverage.
(Find full reports on reputable sources — you know where to look 👀)
🚨 RISK ALERT:
Before, During & After News Releases:
Avoid fresh entries 🔕
Use Trailing SLs to protect live trades
Watch spread spikes & low-liquidity traps
👉 Don't trade when the market's drunk.
💖 SHOW LOVE – BOOST THE PLAN:
💥Smash that Boost Button💥 if you want more precision heist strategies like this. Support the Thief Trading Style, and we’ll keep robbing the markets clean and teaching the crew how to get in & get out profit-heavy. 🏴☠️📈💰
🎭 I’ll be back with another chart crime scene soon. Until then, stay sneaky, stay profitable, and always move like the market’s watching (because it is). 😎
🔐 Thief Trader Out. Rob. Exit. Repeat. 🔁💸

Gold you now totaly buy trend for next 3 to 5 days Gold you now totaly buy trend for next 3 to 5 days
If you want learn more fell free contrect me .

GOLD Forming Bullish Pattern Read DescriptionGold is showing bullish momentum after a weaker-than-expected NFP report, which undermines the USD strength and increases demand for safe-haven assets like gold. With softer labor data, the market is now pricing in potential Fed rate cuts in the coming months, supporting upside pressure on gold.
Technical Analysis:
Price has respected the support zone and is now forming a bullish structure. If price holds above 3362, bullish momentum is expected to continue a Next targeting 3400 and 3419 – Strong resistance zone from recent highs
You May find more details in the chart.
Trade wisely best of luck Buddies.
Ps: Support with like and comments for better analysis.

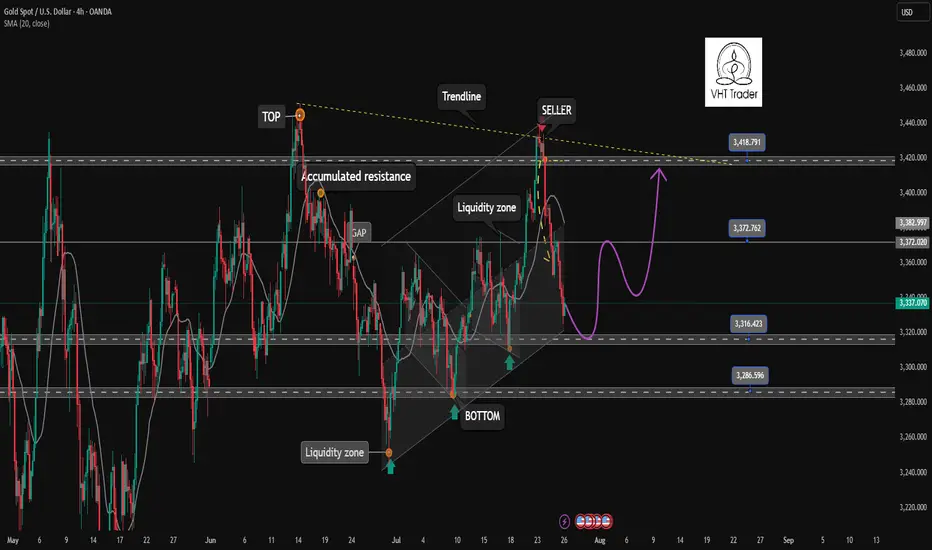
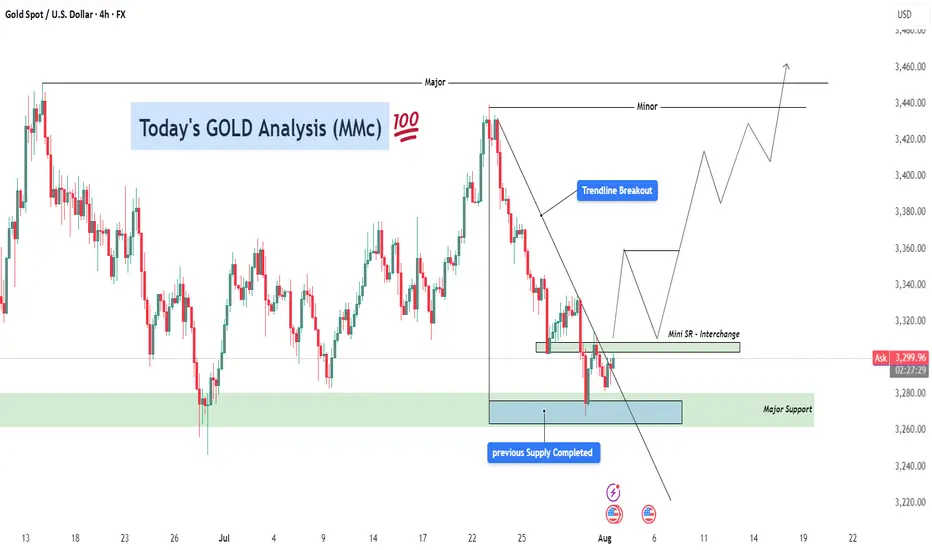
GOLD Analysis – Bullish Recovery Setup After Trendline Breakout ⚙️ Technical Structure Overview
This 4-hour chart of Gold (XAUUSD) illustrates a classic reversal setup developing after a significant correction. Price previously faced strong selling pressure from the 3,470+ zone and declined sharply. However, the recent price action suggests a shift in control from sellers to buyers, signaling a likely medium-term trend reversal or a bullish wave formation.
The key to this setup lies in three confluences:
Completion of a previous supply zone, which no longer holds influence.
Aggressive buyer activity from a major support zone.
A clean break above the descending trendline, which is a common signal that bearish momentum is losing strength.
🔑 Key Levels & Concepts Explained
🟢 1. Major Support Zone (3,260–3,280)
This zone has been tested multiple times and each time, buyers stepped in and prevented further downside. The most recent rejection from this area shows long wicks and bullish engulfing candles, indicating accumulation by institutional players. This is the foundational support that has held the entire corrective structure.
📉 2. Trendline Breakout
The descending trendline connecting swing highs has now been broken to the upside. This is a critical technical signal, especially on the 4H timeframe, as it suggests a potential trend reversal or at least a deep retracement in the opposite direction.
Trendline breakouts typically result in a retest of the trendline or a nearby support-turned-resistance zone (as is the case here with the Mini SR level).
It also implies that supply is weakening, and buyers are ready to push.
🧱 3. Mini Support/Resistance Interchange (~3,300–3,320)
This zone now plays the role of an interchange level—a previous minor resistance that could act as a support after the breakout. This level is crucial for intraday and swing traders because it can offer a low-risk long entry if price retests and confirms it with bullish momentum.
The chart projection suggests a bounce off this mini S/R, followed by successive higher highs and higher lows, forming a new bullish structure.
📈 Forecast Path & Trade Scenario
✅ Bullish Path (Preferred MMC Scenario)
Stage 1: Price retests the 3,300–3,320 zone (Mini S/R).
Stage 2: Buyers step in, leading to a bullish continuation.
Stage 3: Price targets the Minor Resistance (~3,440).
Stage 4: If momentum is sustained, it aims for Major Resistance (~3,470–3,480), completing a clean reversal formation.
This path reflects perfect bullish market structure—a breakout, followed by a retest and rally.
❌ Bearish Invalidation
If the price closes strongly below 3,260, the structure would be invalidated.
This would suggest that the support zone failed, possibly triggering deeper downside toward 3,220–3,200.
🧠 MMC Trader Mindset & Risk Considerations
Don’t Chase: Wait for a confirmed retest of the Mini S/R zone. Let the market come to your entry.
Entry Confirmation: Use candlestick signals like bullish engulfing, pin bars, or inside bars near the Mini S/R.
Volume Consideration: Volume should ideally rise on breakout legs and decline on pullbacks—this confirms healthy bullish structure.
Risk-Reward: With a stop below 3,260 and targets toward 3,470, the RR ratio favors long entries, especially after confirmation.
🔁 Summary Plan for Execution
Entry Zone: 3,300–3,320 (after bullish confirmation)
Stop Loss: Below 3,260 (structure break)
Take Profit 1: 3,440
Take Profit 2: 3,470–3,480
Risk-to-Reward: 1:2+ if planned carefully
Gold Slipping Lower — 3250 and 3200 in Sight!✅ Gold & DXY Update – Post-FOMC Price Action
Earlier today, before the U.S. interest rate decision, I released my outlook on both the Dollar Index and gold.
In that analysis, I highlighted the DXY’s readiness to move toward the key level of 100 — and as of now, price is actively testing that exact zone, just as expected.
As for gold, I repeatedly emphasized the visible weakness on the buy side. It was clear that there were very few remaining buy orders strong enough to hold price up in this region — and that’s exactly what played out. Price has started pushing lower, in line with our expectations.
Looking ahead, I believe the first target is 3250, followed by a deeper move toward the liquidity zone and the marked box around 3200, which could act as a key target area in the coming days.
🔁 This analysis will be updated whenever necessary.
Disclaimer: This is not financial advice. Just my personal opinion.

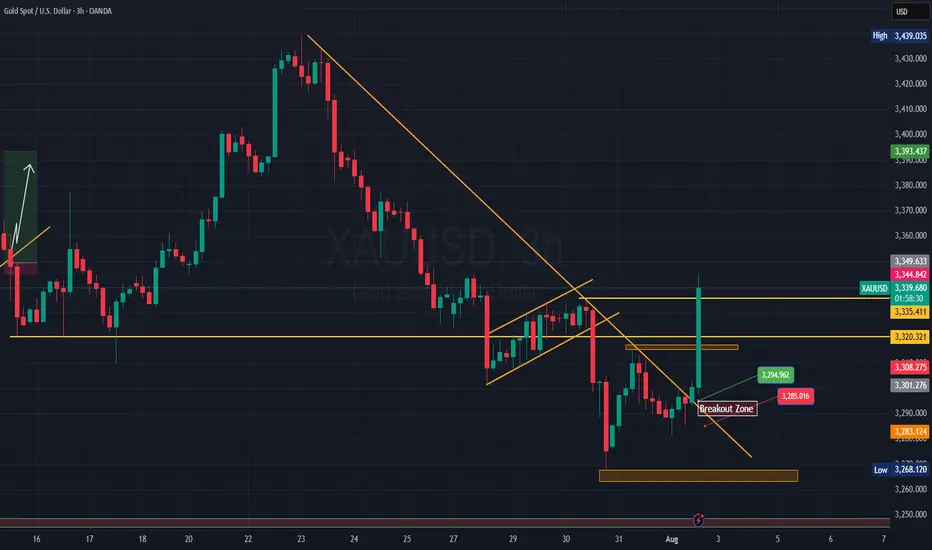
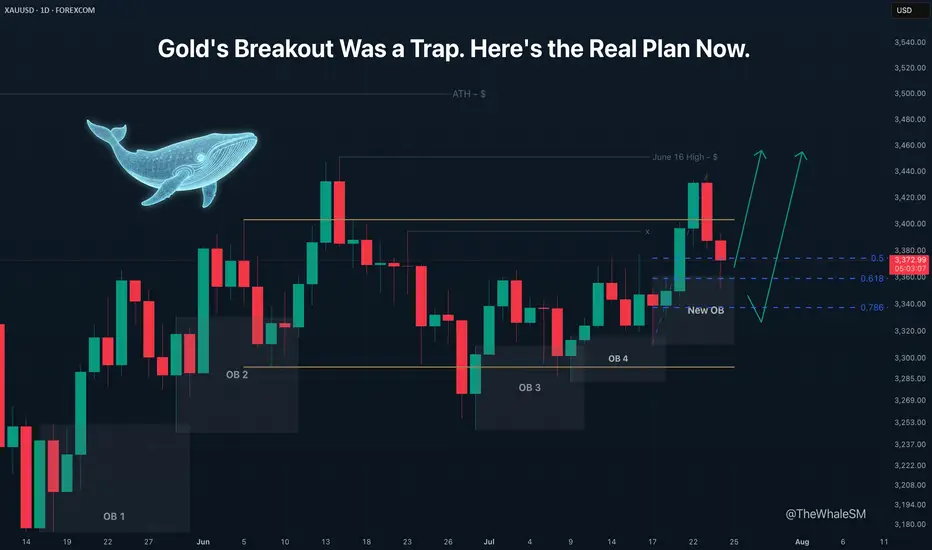
Gold's Breakout Was a Trap. Here's the Real Plan Now.Gold has made its next move, and it was quite sharp. I was expecting a smoother correction with a return to the manipulation zone, but Gold followed a different scenario, which I described at the end of my last gold analysis:
Gold has practically confirmed its breakout from the global range it has been in since the beginning of June. The only thing that could prevent this is a complete engulfing of the bullish daily candle that broke the upper boundary of the range by a bearish candle, but I consider this an unlikely scenario.
The closed red daily candle, which completely engulfed the preceding bullish one, showed that the move was, in fact, an internal liquidity sweep . The price has not yet managed to break out of the range. Therefore, when I wrote "Gold has practically confirmed its breakout from the global range" , the daily candle had not yet closed, and the price had not secured its position above the range's upper boundary.
Essentially, it's not important how the price arrives at a Point of Interest (POI) . What matters is what we have now: the price has mitigated a manipulation in the form of a new daily order block that was formed inside the range.
Although the middle of a range is a highly unpredictable area for price movement, and I almost never consider it for entries, in this case, there is a strong exception that allows us to consider longs from this order block. The reason for this exception is the bullish order flow on the daily structure, which I have mentioned several times, and the ascending daily structure within the range. This structure allows us to identify the start of the last impulse and draw Fibonacci retracement levels, which will serve as an additional condition for our potential long setup. We can now see that the price has reached the 61.8% Fib level and has shown a reversal reaction to it. To see more precisely if there is a potential entry point, let's switch to the 4H timeframe.
On the 4H chart, we see that the 61.8% level has held, and we can look for entry confirmation on a lower timeframe. The 4H timeframe also shows that the liquidity sweep created a supply zone , which will act as resistance on the path of the next attempt to break out of the range. Due to this zone, considering a long from the current position is not optimal because the risk-to-reward ratio is too small. Furthermore, the price could reject from this supply zone and continue its correction to the next level, the 78.6% Fib level . To find an entry with a more acceptable R:R, let's move to the lower timeframes.
Two Potential Long Scenarios
SCENARIO 1: Entry from the 15M Demand Zone or 15M OB
The 15M timeframe shows a break of the 15M structure and the formation of manipulations in the form of a demand zone and a 15M order block within it.
► Setup Condition: I will consider a long position upon the mitigation of one of these manipulation zones and a clear reversal reaction from it. If the price continues to move up from the current levels, I will not enter due to the large stop loss required and the suboptimal R:R to the nearest resistance.
► Invalidation: A break below these support zones on the lower timeframe will invalidate this scenario.
SCENARIO 2: Entry from the 78.6% Fib Level
This scenario becomes active if the first one fails.
► Setup Condition: If the price breaks the 15M supports, I will watch for its interaction with the 78.6% Fib level . For a potential entry, this level must hold, show a reversal reaction, and be followed by confirmation on a lower timeframe.
► Invalidation: A decisive close below the 78.6% Fib level.
~~~~~~~~~~~~~~~~~~~~~~~~~~~~~~~~~~~~~~~~~~~~~~~~~~~~~~~~~~~~~~~~~
The principles and conditions for forming the manipulation zones I show in this trade idea are detailed in my educational publication, which was chosen by TradingView for the "Editor's Picks" category and received a huge amount of positive feedback from this wonderful, advanced TV community. To better understand the logic I've used here and the general principles of price movement in most markets from the perspective of institutional capital, I highly recommend checking out this guide if you haven't already. 👇
P.S. This is not a prediction of the exact price direction. It is a description of high-probability setups that become valid only if specific conditions are met when the price reaches the marked POI. If the conditions are not met, the setups are invalid. No setup has a 100% success rate, so if you decide to use this trade idea, always use a stop-loss and proper risk management. Trade smart.
~~~~~~~~~~~~~~~~~~~~~~~~~~~~~~~~~~~~~~~~~~~~~~~~~~~~~~~~~~~~~~~~~
If you found this analysis helpful, support it with a Boost! 🚀
Have a question or your own view on this idea? Share it in the comments. 💬
► Follow me on TradingView to get real-time updates on THIS idea (entry, targets & live trade management) and not to miss my next detailed breakdown.
~~~~~~~~~~~~~~~~~~~~~~~~~~~~~~~~~~~~~~~~~~~~~~~~~~~~~~~~~~~~~~~~~
XAU/USD Approaches Resistance – Watch 3374 CloselyGOLD Overview
Gold is currently approaching the 3374 resistance level. A 1H candle close above 3374 could trigger further upside toward the next resistance zones at 3401 and 3402.
However, if the price fails to hold above 3365 and starts to decline, this would indicate a potential bearish reversal toward the support levels at 3350 and 3333.
The next short-term move will depend on how price reacts around the 3374 zone — watch for either a confirmed breakout or rejection.
🔹 Key Technical Levels:
Pivot Line: 3365
Resistance: 3374 • 3388 • 3402
Support: 3350 • 3333
Scenarios:
🔺 Bullish: 1H close above 3374 → Targets: 3388 / 3402
🔻 Bearish: Failure to hold above 3365 → Downside toward 3350 / 3333

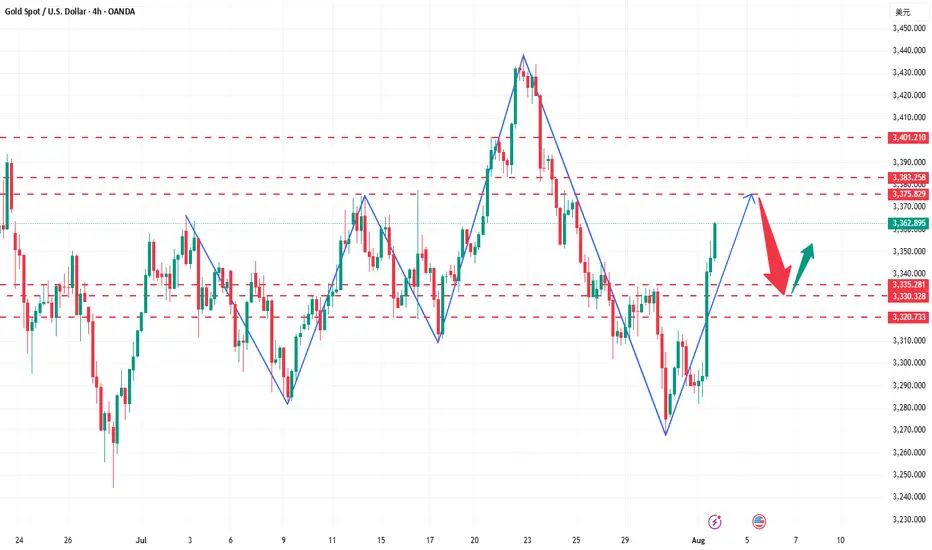
Xauusd bullish setupGold (XAU/USD) is approaching a key support zone around 3,285.82. The chart suggests a potential bullish reversal from this level, targeting resistances at 3,376.35 and 3,431.08. Price action may form a double bottom before moving upward.

XAUUSD H4 Update – The Battle Has Moved to 3350
“From deep demand to key supply. The next move is decisive.”
🔸 Sunday Plan Recap
Price was falling aggressively into the HTF demand zone (3265–3240).
The plan anticipated a bounce only if that deep zone held.
Above price, major zones included:
3314 – mid-structure
3330–3345 – supply zone
3368–3380 – final retracement targets
🔸 What Changed?
✅ The deep demand zone worked — H4 CHoCH bullish was confirmed.
✅ Price climbed through 3285 and 3314, confirming a retracement leg.
🔥 Now, price sits at 3349.57, testing the same supply zone marked in Sunday’s plan (3330–3345).
🔸 Current H4 Structure
🔼 Short-term bias = bullish retracement
📍 Price = inside HTF premium zone
📈 EMAs aligned bullish (5/21/50), confirming short-term momentum
💡 RSI = approaching overbought
⚔️ Liquidity above 3355, trapped shorts below 3314
🧠 Today’s Battle Plan (August 1)
🔴 Sell Zone (live) – 3345 to 3355
Price just entered the key H4 supply zone. Watch for rejection signs:
Bearish confirmation needed (e.g. M15/M30 CHoCH or engulfing)
If confirmed → downside targets: 3314 → 3285 → 3265
High RR short only if structure confirms
🔵 Breakout Bullish Case
If 3355 breaks with a clean body + HL at 3340 → bullish continuation active
Next upside target: 3368 → 3380
🧭 Final Thoughts
We’ve reached the exact decision zone from Sunday’s plan.
The market will now reveal: retracement over... or breakout coming?
Patience is key — this is a high RR zone, but only if structure reacts.
💬 Did you catch the move from deep demand? Or waiting for confirmation here at supply?
📈 Share your thoughts in the comments and let’s break it down together.
🔔 Follow for real-time market insights, sniper plans, and structured trading logic you can trust.
❤️ Like if you enjoy clean, actionable updates🚀🚀🚀
🔁 Share with traders who love structure over noise
📉 Price data from Trade Nation feed

GOLDGOLD needed a reaction from 3360 which is what market gave us, now we need some more upside before any correction.
Disclosure: We are part of Trade Nation's Influencer program and receive a monthly fee for using their TradingView charts in our analysis.

Gold Price Outlook: Bearish Trend DevelopingGold has broken below key top resistance, indicating potential for continued downside movement.
The US Dollar's recent rise has slowed amid renewed concerns about the US-China trade truce and profit-taking ahead of this week’s key employment data, following already strong GDP and ADP reports. While the dollar remains supported overall, uncertainty is capping its momentum, indirectly adding short-term volatility to gold.
The price action suggests a bearish breakout from key resistance zones. Momentum is building toward the downside, indicating the market could continue lower unless strong support levels hold. A potential bearish flag or breakdown structure is forming, and if confirmed, we may see a decline toward next support zones.
📍 Key Levels to Watch:
Resistance: 3310 / 3320
Support: 3269 / 3240
If gold remains below the broken resistance and fails to reclaim 3320, the bearish pressure is likely to continue. Watch upcoming employment data as it could add volatility and confirm the direction.
You may find more details in the chart.
Ps: Support with like and comments for better analysis Thanks.

GOLD Correction Ahead!
HI,Traders !
#GOLD is growing strongly
And the pair looks locally
Overbought so after it
Hits the horizontal resistance
Area around 3374.56 we will
Be expecting a local bearish
Correction and a move down !
Comment and subscribe to help us grow !

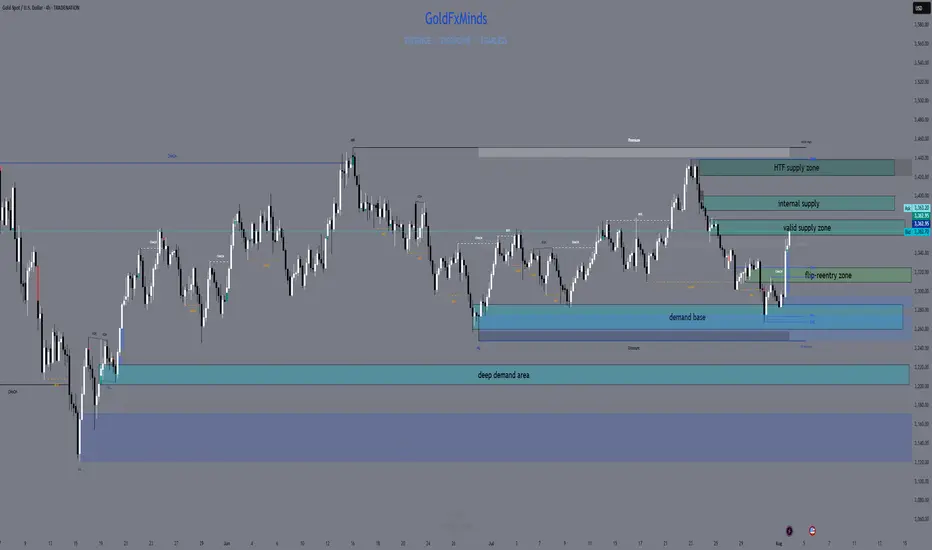
XAUUSD H4 Outlook – August 4, 2025Structure is bullish — but supply is layered. Precision now matters more than bias.
—
Gold is trading at 3362, sitting right inside the heart of a key structural zone. After a strong breakout from 3285–3260, price reclaimed imbalance, broke internal structure, and powered higher into premium. The trend is bullish — but we’ve just stepped into stacked supply.
Let’s break down every zone that matters now, from top to bottom:
🟥 3360–3375 – Valid H4 Supply Zone
This is the first active supply block — the origin of the last bearish leg. It holds a clean OB + imbalance and is currently being tested for mitigation.
We're inside it right now. This zone is critical:
→ If price breaks and holds above it, continuation is likely
→ If we reject here, it confirms sellers are defending their level
🟥 3385–3398 – Internal Supply Trap
A secondary supply zone built from previous order flow.
If bulls push through 3375 without rejection, this is the next area to watch for weakness.
This zone often creates fake breakouts, especially when momentum slows. RSI is already showing signs of exhaustion approaching this level.
🟥 3420–3440 – HTF Supply Trap
This is the top — the last unmitigated supply on the weekly.
It's not in play yet, but if bulls break above 3398 decisively, this is where the bigger trap could form.
Any long into this zone must be backed by strong structure and continuation candles — otherwise, it’s a liquidation magnet.
🟫 3322–3310 – Flip Reentry Zone
If we reject from current supply, this is the first high-probability reentry for bulls.
It’s where the last CHoCH confirmed, and it aligns with EMA confluence and minor imbalance.
Buy setups from here must be confirmed on M15/M30 — no blind longs.
🟦 3285–3260 – Breaker Demand Base
The true origin of the bullish move.
This zone caused the structural flip — clean OB, FVG stack, and liquidity sweep.
If price returns here, it becomes a must-hold for bullish continuation. One of the best sniper zones for longs.
🟦 3222–3205 – Final Demand Layer
Deep structure zone holding imbalance + previous HL base.
Only comes into play if 3260 fails. A break below this would shift bias to neutral or bearish on H4.
🎯 Bias Summary
✔️ H4 bias = bullish
✔️ Price is inside 3360–3375 supply
✔️ EMA 5/21/50 aligned, but RSI is elevated
⚠️ This is not a breakout — it’s a test zone
🔁 Execution Plan
📍 Rejection from 3360–3375 → sell scalp toward 3322
📍 Clean break of 3375 → watch for next short at 3385–3398
📍 Failure of 3398 → HTF draw toward 3430–3439
📍 Pullback toward 3322–3310 → potential long zone
📍 Clean drop to 3285 → high-RR buy area
📍 Break below 3260 → only valid demand left is 3222
—
This is not the time to chase. It’s the time to stalk.
You’re in premium. Supply is active. Let structure decide — you just execute with clarity.
—
Which zone are you watching for your next move?
Comment your bias below 👇🏼 Smash the ❤️ if this brought clarity, and follow GoldFxMinds to trade with precision every day.
Disclosure: Chart based on Trade Nation feed (TradingView).
XAUUSD Daily Outlook – August 4, 2025We’re not in breakout. We’re deep in premium — and supply is stacked.
—
Gold is now trading at 3362, sitting right inside the first valid daily supply zone — the same block between 3355 and 3375 that caused the last rejection. The bullish rally from 3272 was clean: liquidity sweep, CHoCH, imbalance filled, HL confirmed. Bulls did their job. Now they’re walking straight into pressure.
Above this zone, things don’t get easier — they get trickier.
Just a bit higher, we have an internal supply trap between 3398 and 3412. It’s a reaction zone built from imbalance and inducement — not strong enough to hold a reversal on its own, but perfect to fake out breakout buyers. If price pushes through 3375 and enters this pocket, snipers should be watching carefully for early signs of weakness.
And finally, at the top of the current structure sits the HTF supply trap at 3430–3439 — the last weekly wick, the macro reversal zone. That level is sacred. If price makes it there, either we’ll see full-blown expansion… or a violent reversal born from overconfidence.
So what do we do now?
We wait.
If price starts to reject from this 3355–3375 supply with bearish intent, we target the flip reentry zone at 3318–3328 — the previous CHoCH break and dynamic EMA cluster. That’s your first intraday long trigger if bulls want to come back strong.
If that breaks, next is the demand base at 3287–3267, the origin of this entire bullish move. Below that? Imbalance support near 3225 — the final line before structure shifts.
—
🟥 Valid Supply Zone → 3355–3375
🟥 Internal Supply Trap → 3398–3412
🟥 HTF Supply Trap → 3430–3439
🟫 Flip Reentry Zone → 3318–3328
🟦 Demand Base → 3287–3267
🟦 Imbalance Support → 3225–3205
—
This isn’t a breakout. It’s a build-up inside premium.
The smartest move today might be no move — until structure speaks.
—
Are you watching for the rejection? Or the breakout trap?
Let us know your bias below 👇🏼
Tap that ❤️ if this gave clarity, and follow GoldFxMinds to stay ahead of every key level — no noise, just structure.
—
With sniper calm and strategic clarity,
GoldFxMinds 💙
Disclosure: Analysis based on Trade Nation TradingView chart feed.

XAUUSD📈 XAUUSD (Gold) – Buy Setup | 4H Timeframe
Market Context:
After continuous selling, price is now testing a strong 4H and Daily support zone.
A clear bullish candle has formed, signaling potential reversal.
— proper SL is essential.
🔔 Trade Plan: Buy Gold
Entry: Stop Loss: TP mentioned in charts

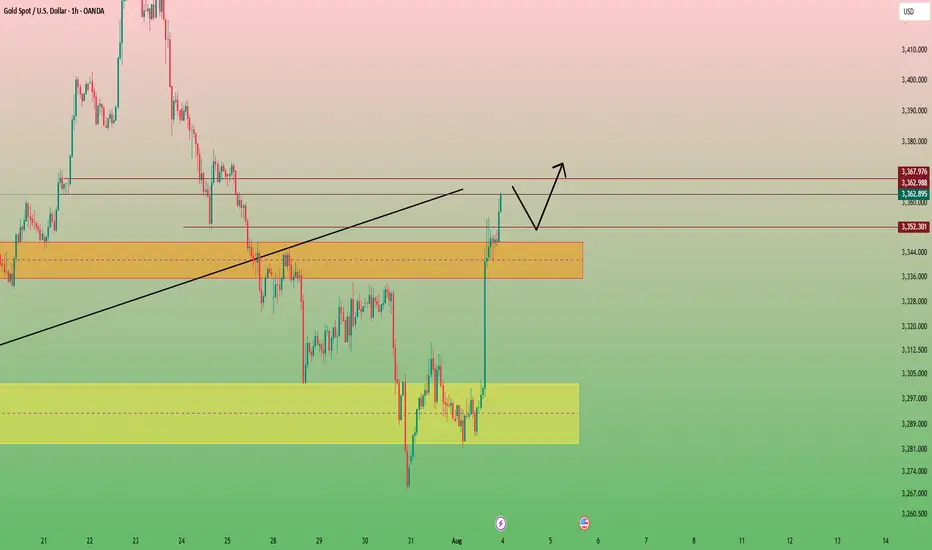
GOLD in 1HHello to all traders. 😎😎
I hope all your deals will hit their targets. 🎉🎉
On the first day of August, gold surged strongly due to news about tariffs imposed by Trump on imported goods. It gained nearly $60 in a single powerful candle.
Currently, I expect a pullback from the $2362–$2370 range down to around $2347–$2352, followed by a potential rebound back to $2370.
⚠️⚠️⚠️⚠️Don’t forget to apply proper risk management!
What Do You Think?
Which scenario do you think is happen? **Share your thoughts!** ⬇️
Don't forget that this is just an analysis to give you an idea and trade with your own strategy. And don't forget the stop loss🛑🛑🛑
❤️❤️❤️The only friend you have in financial markets is your stop loss❤️❤️❤️
Please support me with your ✅' like'✅ and comments to motivate me to share more analysis with you and share your opinion about the possible trend of this chart with me 🙏😊
Be Happy , Ali Jamali
How to Find Liquidity Zones/Clusters on Any Forex Pair (GOLD)
You need just 1 minute of your time to find significant liquidity zones on any Forex pair and Gold.
In this article, I will teach you how to identify supply and demand zones easily step by step.
Liquidity Basics
By a market liquidity, I mean market orders.
The orders are not equally distributed among all the price levels.
While some will concentrate the interest of the market participants,
some levels will be low on liquidity.
Price levels and the areas that will attract and amass trading orders will be called liquidity zones.
How to Find Supply Zones
To find the strongest liquidity clusters, we will need to analyze a daily time frame.
A liquidity zone that is above current prices will be called a supply zone.
High volumes of selling orders will be distributed within.
One of the proven techniques to find such zones is to analyze a historic price action. You should identify a price level that acted as a strong resistance in the past.
4 horizontal levels that I underlined on EURGBP influenced market behavior in the recent past.
The price retraced from these levels significantly.
Why It Happened?
A down movement could occur because of an excess of selling orders and a closure of long positions by the buyers.
These factors indicate a high concentration of a liquidity around these price levels.
How to Draw Supply Zone?
One more thing to note about all these horizontal levels is that they cluster and the distance between them is relatively small .
To find a significant liquidity supply zone, I advise merging them into a single zone.
To draw that properly, its high should be based on the highest high among these levels. Its low should be based on the highest candle close level.
Following this strategy, here are 2 more significant supply zones.
We will assume that selling interest will concentrate within these areas and selling orders will be spread across its price ranges.
How to Find Demand Zones
A liquidity zone that is below current spot price levels will be called a demand zone . We will assume that buying orders will accumulate within.
To find these zones, we will analyze historically important price levels that acted as strong supports in the past.
I found 3 key support levels.
After tests of these levels, buying pressure emerged.
Why It Happened?
A bullish movement could occur because of an excess of buying orders and a closure of short positions by the sellers. Such clues strongly indicate a concentration of liquidity.
How to Draw Demand Zones?
Because these levels are close to each other, we will unify them into a one liquidity demand zone.
To draw a demand zone, I suggest that its low should be the lowest low among these key levels and its high should be the lowest candle close.
Examine 2 more liquidity zones that I found following this method.
Please, note that Demand Zone 2 is based on one single key level.
It is not mandatory for a liquidity zone to be based on multiple significant levels, it can be just one.
We will assume that buying interest will concentrate within these areas and buying orders will be allocated within the hole range.
Broken Liquidity Zones
There is one more liquidity zone that I did not underline.
That is a broken supply zone. After a breakout and a candle close above, it turned into a demand zone. For that reason, I plotted that based on the rules of supply zone drawing.
Start Market Analysis From Liquidity
Liquidity zones are one of the core elements of forex trading.
Your ability to recognize them properly is the key in predicting accurate price reversals.
Identify liquidity zones for:
spotting safe entry points,
use these zones as targets,
set your stop losses taking them into consideration.
They will help you to better understand the psychology of the market participants and their behavior.
I hope that the today's tutorial demonstrated you that it is very easy to find them.
❤️Please, support my work with like, thank you!❤️
I am part of Trade Nation's Influencer program and receive a monthly fee for using their TradingView charts in my analysis.
