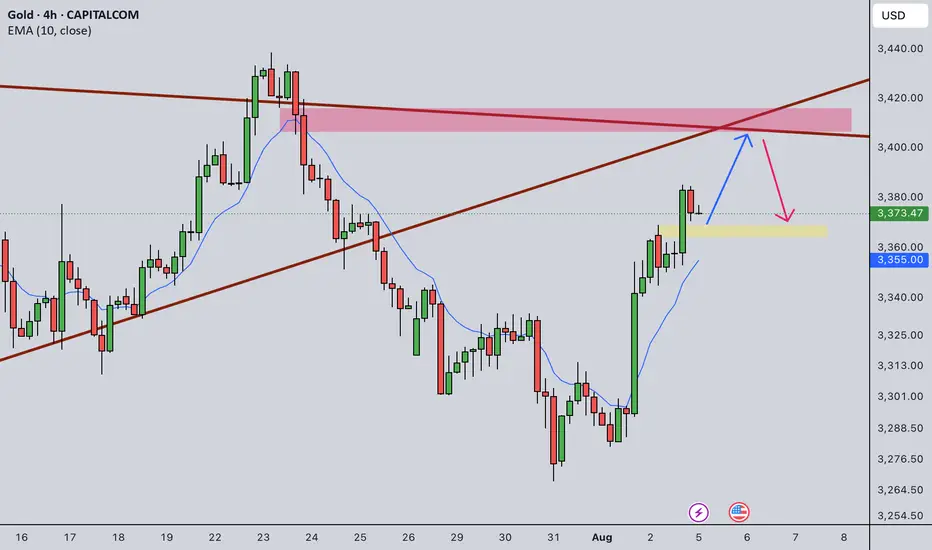
GOLD - at resistance ? Whats next ??#GOLD... market just reached at his current resistance area and that is 3378-79
Keep close and if market holds the cdrop expected from here.
Good luck
Trade wisely
GOLD trade ideas
Gold’s Biggest Day of 2025: Collapse or New High Incoming?🟡 Gold Pre-FOMC Update | Patience Paid Off
In my previous analysis released on Monday, we highlighted the significance of the 3310 key red level on gold. I mentioned that if we got a daily candle close below this zone, it could trigger further downside.
That scenario didn’t play out — price closed above 3310, and that’s exactly why we stayed out of any short positions. No guessing, no forcing. Just patience.
On the flip side, I also said we need a daily close above 3350 to even consider going long. And as you can see, for the past two days, price has been ranging tightly between 3310 and 3330 — with relatively low trading volume across the board.
After 9 years of optimizing this strategy, one core principle remains unchanged:
🛡️ Capital protection and maximum risk control always come first.
And I can confidently say — those filters are working beautifully. I hope you’re benefiting from this approach too.
Now technically speaking, everything is lining up for a bullish DXY and bearish gold —
But tonight’s FOMC meeting and Powell vs. Trump drama will be the final trigger.
Let’s watch closely. Smart trading is patient trading. 🧠⚖️
🔁 This analysis will be updated whenever necessary.
Disclaimer:This is not financial advice. Just my personal opinion.

XAUUSDGold (XAUUSD) has been undeniably one of the most rewarding instruments to trade this year. Whether that be longs or shorts.
Well, after the latest drop let’s be clear on one thing…. There is another big one to come.
There is a 4 year cycle of behaviour to not be ignored. Question, what happened this time in the Gold charts 4 years ago?
If you know the answer then you need to be setting up for sells.
Of course there have been many highs made this year and some are anticipating a new ATH before the drop. It is possible based on price action in 2025.
If history is to repeat itself, the open of Asian Session tonight (030825) could see a continuation up of the explosion up of Friday (010825). This should result in the sweeping out of stop losses of any sells that have been held over the weekend.
The closure of the sells will create buying pressure sending price further up to retest at least the most significant swing high. At and from this level and a few more above, we can look out for sustained selling to break below 3300 and beyond.
It is just theory at this point but should be taken into account.
Potential sell areas:
3368-3370
3378-3380
3400-3405
3412-3416
3428-3430
3433-3438
3444-3450
Of course risk management is key. But from the highest point that price reaches early next week could be the start of a very good sell.
All entry zone me should have an initial 1:2RR while holding partial sells with extended TPs as far as 3233,3217,3198,3159,3099.
Good luck 🤞
This is not financial advice and should be taken with a pinch of salt.

Gold Eliot analysis My predictions about gold in previous years have been quite accurate and calculated. Currently, I think a wave 4 correction, which is a micro-wave, is taking place. As we can see, this micro-wave will probably decrease between $2,700 and $3,000 and then advance to targets above $4,000. Majid Babaei Tehran August 1404

Gold – Party’s Over… or Just Getting Started?Yesterday was… interesting, but honestly, not that surprising. Price shot up to 3385 like it was chasing the last drink at a party. The real question now is: what happens after the party? Because today, the confetti’s still in our hair, but someone has to clean up this mess.
This analysis will go deeper than usual, because we’ve got geopolitical drama on the horizon that could seriously shake up the price of gold.
The Setup – Trend or Just a Power Nap?
Gold is taking a breather – not the end of the trend, just a little post-party nap. The 1-hour EMAs are still pointing upwards, but there’s a slight hesitation showing. Watch the 50 EMA (the orange one) – that might be the judge and jury for gold’s fate. If price breaks below, we could see a quick visit to the 3340 zone.
Trend strength? Still strong at 41. Translation: The party isn’t over yet. But on the 1-hour chart, this bullish move is starting to lose steam – trend strength is above the horizon but flattening. What’s more, our short line is sneaking up toward the horizon too… if price dips further, that line might peek above. That’s a classic “trend fatigue” signal – like a boxer taking a breather between rounds.
Yesterday RSI punched through the overbought zone, then promptly got smacked down from 3385. Now it's calmly drifting lower. Currently, RSI is below the 4-hour RSI-EMA, which is a shortish sign… but hey, we never enter trades based on RSI alone, right? 😉
Bonus: That Fair Value Gap (FVG)
Gold left us a beautiful FVG on the chart – like bulls sprinting so fast they spilled their coffee on the carpet. This created a “gap” around 3300–3340. Markets hate mess. They’re perfectionists. And they often go back to clean up spilled coffee before moving on. This gap will likely be filled – the only question is: when?
Will we get it today? Not likely.
But hang tight… we’re not done.
🔮 My Take…
Today I expect a gentle slide. Price feels drawn to 3355 like a moth to flame. 3340 looks like solid support, if price decides to keep sliding. Do I think we’ll fill the entire FVG today? Nah. There’s not enough momentum behind this right now.
But there’s a wild card: the Geopolitical Joker.
If Israel launches a full-on ground offensive in Gaza, that’s like tossing a boulder into a calm lake.
War = Uncertainty = FEAR.
And fear drives money into gold like it’s a medieval castle during a dragon attack.
When fear hits, RSI doesn’t matter. FVG? Forget it. EMAs? Irrelevant.
Money flees risk assets (stocks, crypto) and dives headfirst into the safety of gold.
Two Battle Plans Ahead:
1. The Cleaning Crew Scenario:
No geopolitical drama yet. Price slides gently, fills part of the FVG, maybe tests 3340. If we reach 3330, gold might chill there, gather strength at the 3315 support, and maybe bounce for a new bullish run.
2. The Iron Dome Scenario:
The news hits. Boom. Fear skyrockets. Gold ignores all technicals, skips the cleaning, and rockets toward 3400, maybe even 3440. No questions asked.
What Would I Do Today?
Time for the sniper strategy.
No chasing the herd. No standing in front of a speeding train.
We wait for clear signals.
Buying now? Risky – price might retrace.
Shorting in this bullish mess + geopolitical tension? Market suicide.
Patience is key. If price just chops sideways while everyone holds their breath over the headlines… entering a trade now could backfire spectacularly.
Not financial advice – just a gold-obsessed human sharing thoughts.
What about you?
Will gold clean up the mess, or will the fear-fueled stampede into gold send us sky-high?
And now… for my fellow gold-hunters, the same analysis in Hungarian, because some things just hit harder in your mother tongue
A tegnapi nap érdekes volt, de lehetett rá számítani. Most az a kérdés mi jön a buli után mert 3385-ig felnyomták az árat. A mai elemzés kicsit részletesebb lesz mert vannak geopolitikai hírek ami nagyon befolyásolhatja az arany árát. A jelenlegi megpihenés még nem a trend végét jelenti, csak rápihenés a tegnapi bulira. Konfetti még a hajakba, de rendetlenséget hagytak, így a takarítás ideje jött el. Az EMA-k az 1 órás charton felfelé trendet mutatnak, de ott is látszik egy kicsi megtorpanás. Az 50-es EMA (narancssárga) lehet az a pont, ami eldönti az arany sorsát. Ha átszakítjuk, akkor jöhet a 3340-es szint.
Arena TrendIQ: A trenderő még mindig erős. 41-es értékkel mutatja, hogy itt nincs vége a bulinak. Jelenleg a felfelé menő trend kezd gyengülni az 1 órás charton de még a horizont felett van. Ami érdekes hogy a short vonalunk is megközelítette a horizontot. Ha még lejjebb fog ereszkedni az ár akkor mennyire befigyel horizont fölé.
Arena RSI: Tegnap is benéztünk a túlvett szint felett azóta szépen csorog lefelé ami látszik a charton is. Felszúrt 3385-ig túlvett szint megvolt majd kapott egy pofont és lefelé vette az irányt. Jelenleg a 4 órás RSI-EMA alatt van, ami önmagában shortos jel, de csak RSI-re nem lépünk be pozícióba.
Mit látunk még? Azt hogy hagyott nekünk egy szép FVG-t az aranyunk. A bikák annyira siettek felfelé, hogy "kiöntötték a kávét" a szőnyegre. Ez a grafikonon egy üres terület, egy "rés", amit az árfolyam otthagyott maga után (kb. a 3300-3340 közötti zónában). A piac pedig perfekcionista, utálja a rendetlenséget és a foltokat. Nagyon gyakran visszatér, hogy feltakarítsa maga után kiöntött kávét, és még tovább menne. Ezt hívjuk Fair Value Gap (FVG) betöltésnek.
Számíthatunk rá? Hogy a viharba ne... De nem ma!
🔮szerintem...
Ma finom lecsorgás lesz a piacon. A 3355-ös szint vonzza most az árfolyamot. A 3340-es sáv jó támasznak ígérkezik, ha tovább szeretne lefelé menni. Szerintem ma nem tölti be a teljes FVG-t, mert nincs mögötte ebben a pillanatban azaz erő, ami odáig levinné az árat. És van itt még valami, ami totál áthúzhatja a szép finoman lecsorgás elméletét, ami nem más, mint a Geopolitikai Joker. Ha Izrael valóban megindítja a szárazföldi hadműveletet, az egy hatalmas kő a tóba dobva. A mechanizmus: Háború és bizonytalanság = FÉLELEM. A félelem pedig a befektetőket a legősibb menedékbe, az aranyba hajtja. Ilyenkor nem számít az RSI, az FVG, vagy a mozgóátlag. A pénz a kockázatosabb eszközökből (pl. részvények, kripto) az aranyba menekül. Az arany ilyenkor olyan mint a viharban a stabil, masszív kőház. Amikor kint dörög az ég és villámlik, mindenki oda akar bejutni, biztonságba. Most van két forgatókönyvünk tehát, így a helyzet ravasz és furfangos. A technikai kép egy kisebb, egészséges visszahúzódást, a "takarító hadműveletet" valószínűsíti. A fundamentális kép pedig ennek az ellenkezőjét.
A Takarító Brigád Forgatókönyv: A geopolitikai helyzet nem szól bele azonnal. Az árfolyam szépen lecsorog, hogy feltöltse az FVG egy részét, de a 3340-ig totál egészséges lenne. Ha meg lesz a 3330 ott erőt gyűjthet esetleg az alatta lévő 3315-ös támaszon és onnan indulhatna egy új stabilabb emelkedésnek.
A Vaskupola Forgatókönyv: Jön a hír... A félelem-faktor az egekbe szökik. Az arany ignorál minden technikai szintet elfelejti a takarítást és azonnal kilő célba véve a 3400-as, majd a 3440-es szinteket.
Én mi tennék ma? A legjobb stratégia most a "lesben álló mesterlövése". Nem rohanunk a csorda után és nem is állunk a vonat elé. Megvárjuk, amíg a piac dönt. A jelenlegi szintről vásárolni kockázatos a visszahúzódás miatt. Shortolni pedig egy ilyen bikás trendben és geopolitikai helyzetben öngyilkosság. Várjunk a jelekre, mert ha csak simán oldalazás lesz se le, se pontosan azért mert mások is figyelnek a háttérre, akkor nagyon megszívhatjuk. Ez nem befektetési tanács, csak egy aranyrajongó véleménye. Ti hogyan látjátok? Jöhet a takarítás, vagy a menedék aranyban most mindent visz?

Time is equal to price !Will gold visit again the LL at 3268 or it will pull back from 3340/3344 !
If so we may see gold making a new top at 3400 /3450/3500/3550/3600 .

XAUUSDXAUUSD longterm its going to 5K
Short/midterm its going to 3500
H4 still on a consolidation.
The best thing to do is to wait for the end of the summer.

XAU intra?
Hi ,
Broke low at 3305/04 yesterday.
Made low below 3300
Now retesting this area. Good place to place a ticket.
All the best
Not a guru

continue to maintain gold purchase, 3400⭐️GOLDEN INFORMATION:
Gold prices edged higher on Monday, supported by growing expectations of a Federal Reserve rate cut following last Friday’s disappointing U.S. Nonfarm Payrolls report. XAU/USD is trading around $3,375, up 0.39% on the day.
Speculation over a potential policy shift has strengthened, with markets now pricing in an 87% chance of a rate cut at the Fed’s September 17 meeting — a boost for the non-yielding yellow metal.
Last week’s labor data revealed early signs of weakness in the job market. The U.S. Bureau of Labor Statistics (BLS) revised May and June payrolls down by a combined 258,000 jobs, reinforcing dovish remarks from Fed Governor Christopher Waller, who downplayed tariff-driven inflation and emphasized concerns about the Fed’s full employment mandate.
⭐️Personal comments NOVA:
Uptrend, gold price is maintaining stability. Heading towards 3400, before the expectation of interest rate cut is becoming more and more obvious.
⭐️SET UP GOLD PRICE:
🔥SELL GOLD zone: 3415- 3417 SL 3422
TP1: $3405
TP2: $3394
TP3: $3380
🔥BUY GOLD zone: $3311-$3313 SL $3306
TP1: $3325
TP2: $3338
TP3: $3350
⭐️Technical analysis:
Based on technical indicators EMA 34, EMA89 and support resistance areas to set up a reasonable BUY order.
⭐️NOTE:
Note: Nova wishes traders to manage their capital well
- take the number of lots that match your capital
- Takeprofit equal to 4-6% of capital account
- Stoplose equal to 2-3% of capital account

Gold Sell Setup - M15PEPPERSTONE:XAUUSD
Timeframe: m15
Risk Level: Medium
🔹 Setup:
Price is testing the upper boundary of the descending channel.
📈 Entry:
Current price zone: 3302.5
🎯 Targets (TP):
TP1: 3393
TP2: 3283
TP4: 3264
TP6: 3244
⛔ Stop Loss (SL):
3312.2
#XAUUSD #GOLD #SELL #Signal #MJTrading
Psychology Always Matters:

GOLD Bullish Today , Long Scalping Entry Valid To Get 150 Pips !Here is My 15 Mins Gold Chart , and here is my opinion , we finally above 3296.00 and we have a 30 Mins Candle closure above it , so i`m waiting the price to go back and retest this res and new support and give me a good bullish price action to can enter a buy trade and we can targeting 100 to 150 pips .
Reasons To Enter :
1- New Support Created
2- Bullish Price Action
3- Bigger T.F Giving Good Bullish P.A .

GOLD prep work to ATH retap has started. seed at 3270!First thing first.
Diagram above is in reverse metrics (USDXAU)
--------
GOLD, has been met with some well deserved respite on price growth after a series of parabolic highs this past few weeks. And this healthy trims are warranted in the grand scheme of things -- to sustain its upward trajectory. A price rest is definitely welcomed.
Now based on our latest daily metrics, gold is showing some low key hints of shift -- it may not be visible to 99% of traders -- but it is there now to magnify.
Diagram above is in reverse metrics (USDXAU). It is currently showing some pressure expansion for bears and hinting of prep work to reverse.
This is a precursor of a massive structure change-- for that elusive upside continuation.
On the daily metrics, we got some hop signals here as well from -- first one in a while. Price baselines detaching itself from the descending trend line. There maybe something here now. A good zone to seed on the most discounted bargain levels -- with safety.
Spotted at 3260.
Interim mid target: ATH at 3500
Long term. 4k++
Trade safely.
TAYOR.

downtrend below 3300 , after ADP-NF⭐️GOLDEN INFORMATION:
The Federal Reserve’s policy statement noted that economic activity has slowed in the first half of the year, although the unemployment rate remains low and inflation is still “somewhat elevated.” The Fed reaffirmed its commitment to achieving maximum employment and returning inflation to its 2% target, while also acknowledging that “uncertainty around the economic outlook remains elevated.”
Earlier data showed that U.S. GDP grew in the second quarter, but underlying details painted a softer picture. Consumer spending cooled, and business investment declined significantly. According to Reuters, most economists now forecast full-year GDP growth at 1.5%, below the Fed’s 1.8% projection.
⭐️Personal comments NOVA:
Gold prices reacted negatively as the FED kept interest rates unchanged and Chairman POWELL's hawkish stance. Selling pressure below 3300 is being maintained.
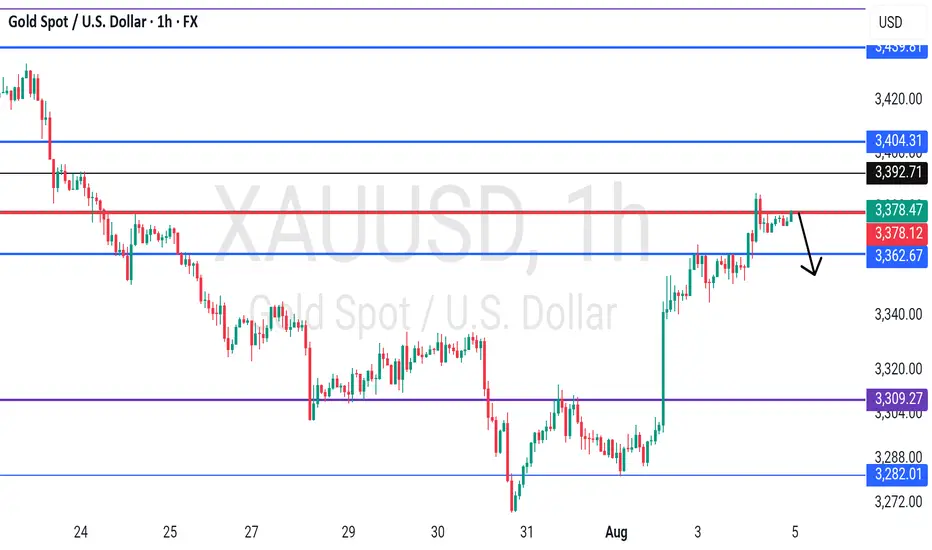
⭐️SET UP GOLD PRICE:
🔥SELL GOLD zone: 3360- 3362 SL 3367
TP1: $3350
TP2: $3340
TP3: $3330
🔥BUY GOLD zone: $3249-$3247 SL $3242
TP1: $3258
TP2: $3270
TP3: $3285
⭐️Technical analysis:
Based on technical indicators EMA 34, EMA89 and support resistance areas to set up a reasonable SELL order.
⭐️NOTE:
Note: Nova wishes traders to manage their capital well
- take the number of lots that match your capital
- Takeprofit equal to 4-6% of capital account
- Stoplose equal to 2-3% of capital account

GOLD Breakout Done , Long Setup Valid To Get 150 Pips !Here is My 15 Mins Gold Chart , and here is my opinion , we finally above 3350.00 and we have a 30 Mins Candle closure above it And Perfect Breakout , so i`m waiting the price to go back and retest this res and new support and give me a good bullish price action to can enter a buy trade and we can targeting 100 to 150 pips .
Reasons To Enter :
1- New Support Created .
2- Bullish Price Action .
3- Bigger T.F Giving Good Bullish P.A .
4- Clean Breakout .

XAUUSD Possibility of a small correction towards 3330, re-entering the bearish phase and moving towards the specified targets

Short!Hello all. after reversing from an LOZ it is time to a Node. be happy and have a wealthy day.(wink)

Will Upcoming Data Determine the Next Gold's Direction?Macro approach:
- Gold retreated this week, reversing early gains to trade near four-week lows amid renewed US dollar strength and caution ahead of the Fed's policy decision.
- The retreat was mainly pressured by stronger-than-expected US economic data and a tentative revival in risk appetite, offsetting pockets of safe-haven demand.
- Key drivers included robust US GDP growth for 2Q, a bounce in consumer confidence, and the Fed's steady rates with a more hawkish tone, suggesting cuts may be further out.
- Meanwhile, recent US-EU and US-China trade deals eased some global uncertainty, damping gold's appeal as a hedge.
- Market participants also eyed the labor market's continued cooling, but resilient consumer spending further buoyed the dollar.
- Gold may remain volatile, with potential upside if upcoming US PCE inflation and NFP reports disappoint expectations. Any escalation in trade tensions or signals of Fed policy easing could renew support for gold prices.
Technical approach:
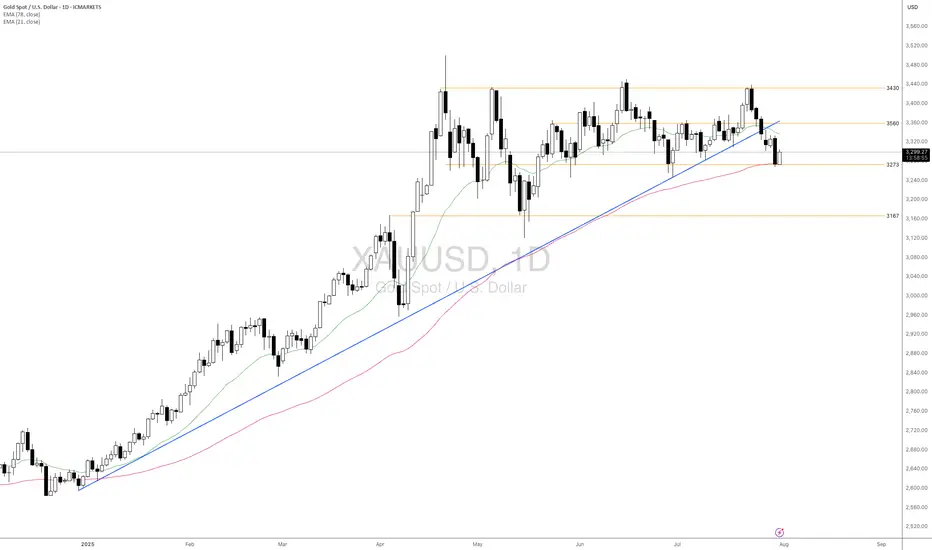
- XAUUSD fluctuated within the range of 3285-3560, which is below the broken ascending trendline. The price between the two EMAs awaits an apparent breakout to determine the next trend.
- If XAUUSD breaks below the support at 3273, confluence with EMA78, the price may plunge to retest the following support at 3167.
- On the contrary, remaining above the support at 3273 may lead XAUUSD to retest the resistance at around 3560.
Analysis by: Dat Tong, Senior Financial Markets Strategist at Exness
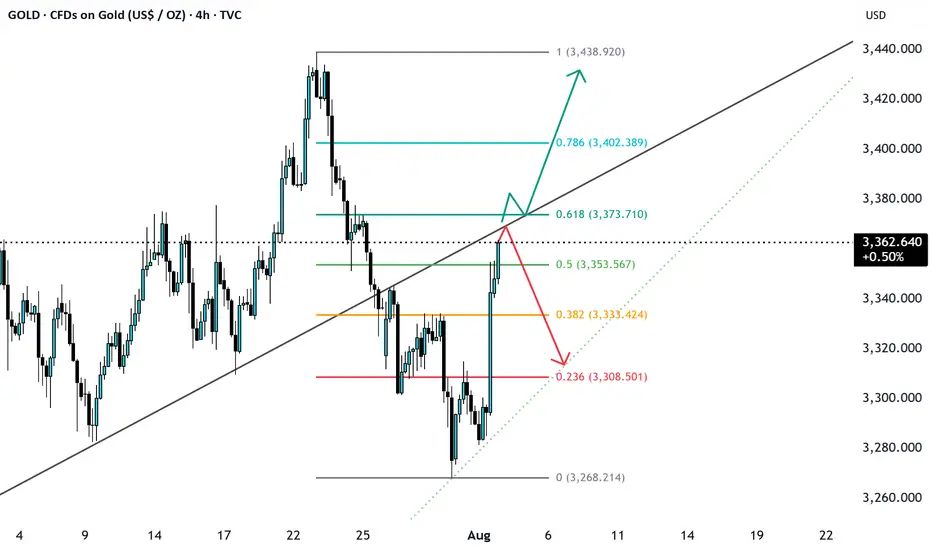
Gold at major resistance and at fib 0.618 level breakout ? Gold after breaking the support, now again reached the support level which will be its resistance now, will it break it or get rejected form here. Enter the long only on breakout and retest till then its bearish trend.
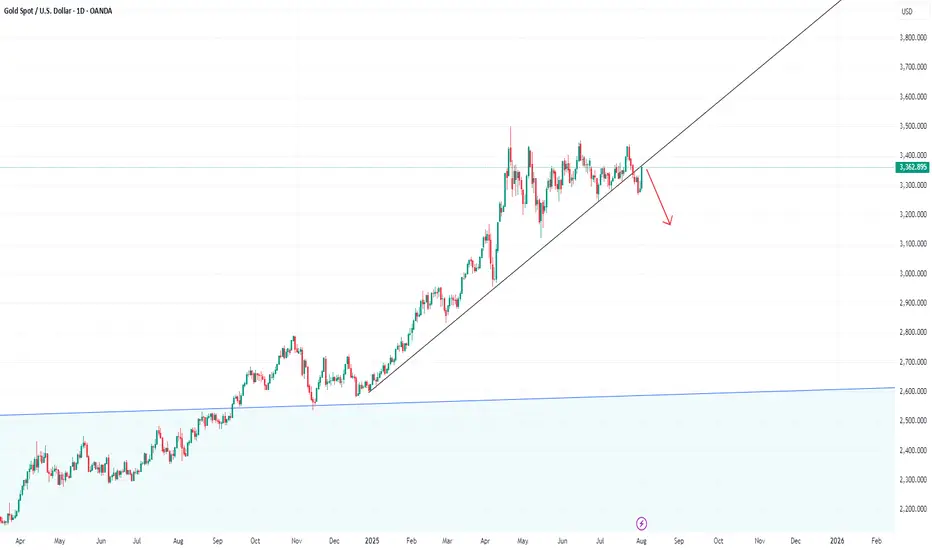
Pullback and then down!I would like to see this daily candle as a pullback to the trendline. So I expect the price to fall.
XAUUSD – Bearish Outlook Ahead of FOMCGold is currently under bearish pressure as markets await the highly anticipated FOMC meeting, scheduled to begin in less than an hour. Investors are closely watching the Fed's interest rate decision and the release of the meeting minutes, which could trigger sharp volatility across the forex and commodities markets.
Technical Outlook:
From a technical perspective, the price action suggests a potential continuation of the bearish trend. If the FOMC event leads to a stronger U.S. dollar or a hawkish tone from the Fed, gold prices may decline further.
Resistance Zone; 3315 / 3330
Support Levels: 3282 / 3260
You May find more details in the Chart.
Trade wisely Best Of Luck Buddies.
Ps: Support with like and comments for better insights Thanks for understand.

GOLD (XAUUSD) -Monthly Analysis & Trading Plan (Aug 2025)GOLD (XAUUSD) -Monthly Analysis & Trading Plan (Aug 2025)
Title: XAUUSD: Correction in Progress, Patience is Key for the Next Move
Chart: XAUUSD Monthly (1M)
Analysis Type: ICT/SMC, Price Action, & Moving Average
Summary:
After a historic and powerful bull run that saw Gold (XAUUSD) breach all-time highs in the first half of 2025, the market has entered a significant corrective phase. The massive red candle in June signaled a strong reversal of momentum, and the current July candle confirms that sellers remain in control, albeit with less intensity. This is a critical juncture for long-term traders, and a strategic approach is required.
Key Observations & Analysis
1. **Price Action & Market Structure:**
The move from late 2024 through May 2025 was a textbook "impulsive leg." The sharp reversal in June 2025, with a powerful bearish candle, likely acted as a **liquidity grab** or a **high-volume distribution event**, trapping late buyers. The market is now in a clear **break in market structure (BOS)** to the downside on this long-term timeframe, suggesting the correction is not over.
2. **ICT/SMC Concepts:**
* **Imbalance/Fair Value Gap (FVG):** The rapid bullish move created significant imbalances on the monthly chart. Price often returns to fill these gaps. The current correction is likely heading to fill or test these inefficiencies.
* **Order Block (OB):** The massive bullish move in late 2024/early 2025 likely created a strong bullish order block. The current sell-off is heading toward this potential institutional demand zone.
* **Liquidity:** The lows from late 2024 and early 2025 will be key liquidity pools. Smart money will likely be targeting these areas for a potential reversal or accumulation.
3. **Moving Average Analysis (MMA):**
* The price is currently trading above both the purple and yellow moving averages, which are still pointing upward. This confirms the long-term trend remains bullish, and the current move is a correction within that trend.
* The **purple moving average** is a key support level to watch. A test of this level would be a high-probability event, and its reaction will be crucial for the next major move.
Suggested Entry & Exit Levels
1. Aggressive Entry (Short)
Rationale
The bearish momentum, though slowing, is still the dominant force. An aggressive trader could look for a continuation of the short-term bearish trend.
Entry/b]
A short entry could be considered on a pullback to the recent highs around **$3,400 - $3,500** if a strong bearish candlestick pattern forms on a lower timeframe (e.g., weekly or daily).
Stop Loss
A tight stop-loss placed just above the recent high, for example, **$3,600**. This is a high-risk entry, so position sizing should be small.
Target
The first major target would be the **moving average support level**, roughly in the **$3,000 - $3,100** zone. The ultimate target for a full correction would be the order block from late 2024, around **$2,800**.
2. Conservative Entry (Long)
Rationale
The long-term trend is still bullish. The current move is a correction. The most prudent approach is to wait for a high-probability long entry at a key support level.
Entry/b]
Wait for price to reach the **purple moving average support zone (around $3,000 - $3,100)**. Look for a clear reversal signal on this level, such as a large bullish "pin bar" or "engulfing candle" on the monthly or weekly chart. This would be a high-probability demand zone for a reversal.
Stop Loss
A stop-loss should be placed below this key support level, perhaps around **$2,850 - $2,900**, giving the trade room to breathe.
Target
The first target for a new bullish leg would be the New swing high around **$3,800**. The ultimate long-term target would be a new all-time high above **$4,000**.
Conclusion
The Gold market is in a crucial phase. The bullish party from earlier in 2025 is over for now, and a healthy correction is underway. **The most logical and safe approach is to wait for the market to complete its corrective move.** Do not attempt to catch a falling knife. Instead, be patient and wait for price to reach a key institutional demand zone (our moving average support or the late 2024 order block) and show a clear sign of reversal. This will present a high-probability, low-risk long entry for the next impulsive move up.
Disclaimer
This is not financial advice. Please perform your own due diligence and risk management. Trading involves a significant risk of loss.

XAUUSD - 4/8/25Theres alot happening that is influencing Gold. But just following the market structure, we see a HTF BoS towards more bearish action. However friday's news did bring a big push up with huge imbalance in the Dollar as well as Gold.
I identified the zone that broke structure above and looking for price to touch this zone before going back down to take out any imbalance. t
The current TP is quite way down at the moment targeting the HTF equal low liquidity, but I will trail my SL.
if this Zone that broke structure is taken out then my bias will shift to bullish trades to retest the ATH.

Gold Intraday Trading Plan 8/5/2025Gold didn't retrace deep enough to 3333 yesterday but bounced from 3345 and touched 3385. The short term bullish trend is still valid right now but we could see sign of slowing down. If further slowing is observed, the drop followed may be very big.
Therefore, I will execute strict management on buying order right now. I am looking for buying signals from 3365, targeting 3400. If there is selling signals from 3400, I will sell toward 3365.