GOLD BUY M15 Gold (XAUUSD) 15-Min Chart Analysis – July 31, 2025
The chart shows a clear bullish structure after a confirmed Change of Character (ChoCH) and Break of Structure (BOS) on the lower time frame. Price has broken above previous resistance zones, indicating strong buying momentum.
Entry Zone:
Price is currently retesting a demand zone (highlighted in pink).
Ideal buy entry was taken after the bullish ChoCH.
Stop Loss:
SL: 3397, placed just below the demand zone for risk protection.
Targets / Resistance Levels:
1. First Resistance: 3308
2. Second Resistance: 3311
3. Third Resistance: 3316
4. Final Target: 3325
Bias:
Bullish, expecting higher highs as long as price holds above the demand zone.
Break and retest strategy is forming, suggesting continuation toward the final target.
GOLD trade ideas


Gold 30Min Engaged ( Bullish & bearish Reversal Entry Detected )————-
➕ Objective: Precision Volume Execution
Time Frame: 30-Minute Warfare
Entry Protocol: Only after volume-verified breakout
🩸 Bullish Reversal : 3354
🩸 Bearish Reversal : 3378
➗ Hanzo Protocol: Volume-Tiered Entry Authority
➕ Zone Activated: Dynamic market pressure detected.
The level isn’t just price — it’s a memory of where they moved size.
Volume is rising beneath the surface — not noise, but preparation.
🔥 Tactical Note:
We wait for the energy signature — when volume betrays intention.
The trap gets set. The weak follow. We execute.
XAUUSD 4H – Massive Sell Setup: Gold Crash Incoming? Gold (XAUUSD) just tapped into a key liquidity zone near the 38.2% Fibonacci retracement at $3,364, followed by a sharp rejection. This aligns with the upper channel resistance and a bearish confluence from previous supply zones.
Price has failed to break above the dynamic EMA cluster and is showing signs of exhaustion after a relief rally. If momentum follows through, this could mark the beginning of a deeper selloff targeting major downside levels.
Short Setup
Entry: Around $3,349–$3,364 (rejection zone)
SL: Above $3,379
🚨Strong bearish engulfing candle confirms seller pressure
🎯 Take Profit Targets (Fibonacci):
TP1: $3,305 (38.2%)
TP2: $3,275 (61.8%)
TP3: $3,241 (Full move – 100% Fibonacci extension)
This setup offers high risk-reward if the rejection holds and price breaks below the mid-zone structure at $3,330. A drop below $3,305 could accelerate the move as liquidity gets swept.

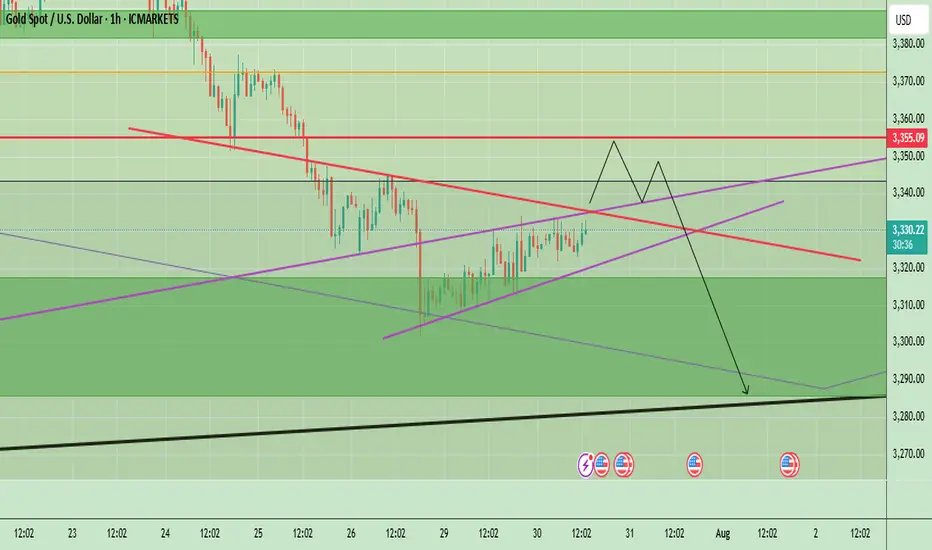
Gold Awaits Fed Rate Decision – Key Levels & Volatility AheadGold is currently trading near $3,332, showing a minor recovery after recent downward momentum. The price action on the 1-hour chart highlights a short-term ascending structure, which often acts as a corrective move rather than a strong bullish trend. The market previously saw significant selling pressure from above $3,355–$3,360, creating a short-term supply zone. Unless the price breaks and holds above this zone, the overall momentum remains bearish.
The chart also shows a projected price path where gold could push slightly higher toward $3,355, meet resistance, and potentially reverse downward again. Key support lies at $3,320, and if this breaks, we could see gold testing $3,290–$3,280 levels, aligning with the black trend line support. However, if bulls manage to break above $3,360, it would signal potential upside continuation toward $3,380–$3,400.
Key Points
- Key Resistance Levels: $3,355 and $3,360 (critical supply zone).
- Key Support Levels: $3,320 (short-term), followed by $3,290–$3,280 (major trendline support).
- Expected Short-Term Move: Possible push toward $3,355 → rejection → decline back toward $3,320 and possibly $3,290.
Bullish Breakout Scenario: A strong close above $3,360 could push price toward $3,380–$3,400.
Overall Bias: Bearish while trading below $3,360.
4hr Chart
Price remains under pressure below the descending trendline. A small pullback toward $3,345–$3,350 is possible, but as long as price stays under this resistance, the bias remains bearish with potential downside targets around $3,300–$3,280.
Key Levels:
- Resistance: $3,350 → $3,381 → $3,394
- Support: $3,324 → $3,281 → $3,254
Today’s FOMC interest rate decision is a key driver for Gold. Here’s the quick analysis:
- If Fed Hikes Rates or Maintains Hawkish Tone:
- Strong USD likely → Gold could face more selling pressure.
- Key support zones: $3,324 – $3,300, then $3,281 and $3,254.
- If Fed Pauses or Turns Dovish:
- Dollar weakens → Gold may bounce toward resistance zones.
- Upside levels: $3,355 – $3,360 and higher toward $3,381 – $3,394 (Fib levels).
Expect high volatility; $3,300 is a critical support to watch. A dovish Fed may give Gold short-term relief, but a hawkish stance could accelerate the downtrend.
Note
Please risk management in trading is a Key so use your money accordingly. If you like the idea then please like and boost. Thank you and Good Luck!
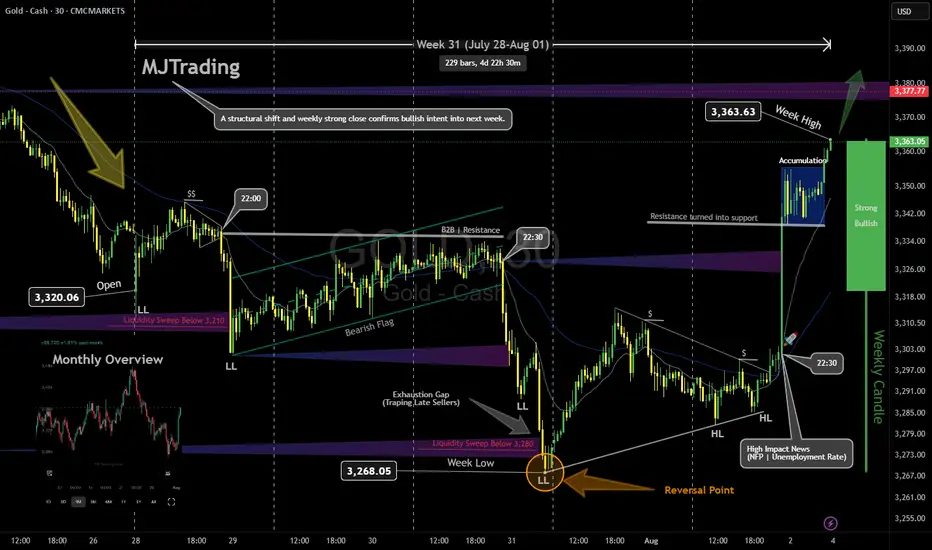
GOLD Weekly Recap & Outlook (Week 31 | July 28 – Aug 01)Note: Some elements may shift depending on your screen size. View the full snapshot in perfect layout:
📈 CAPITALCOM:GOLD
Timeframe: 30m | MJTrading View
⸻
🔹 Weekly Performance
• Open: 3,320.06
• High: 3,363.63
• Low: 3,268.05
• Close: 3,363.05
Gold delivered a classic Smart Money move this week: liquidity sweep, structural shift, and bullish expansion.
⸻
🔹 Price Action Breakdown
1️⃣ Early Week: Bearish Continuation
• Price opened around 3,320 with a gap and extended last week’s bearish leg.
• Formed lower lows (LL) and a bearish flag, signaling continuation.
2️⃣Midweek: Liquidity Grab, Reversal Point and
• Last Bearish leg marks the exhaustion gap and stop run.
• Market printed a liquidity sweep below 3,310 then 3,280 (weekly low), trapping late sellers.
• Smart Money likely absorbed sell-side liquidity before initiating the reversal leg.
• This aligns perfectly with SMC principles: sweep → accumulation → expansion.
3️⃣ Late Week Rally
• Following NFP & Unemployment Rate news, price broke 3,333 and rallied strongly to 3,363.63 confirming a Bullish Market Structure Shift (MSS).
• Resistance turned into support, validating the accumulation phase.
• Price rallied strongly to 3,363.63,.
• The weekly candle flipped bullish, closing near the high, with Smart Money leaving a clear footprint of accumulation and expansion.
⸻
🎯 Key Levels & Outlook
• Support: 3,355 → 3,333 - 3,340
• Resistance: 3,377 → 3,380+
• Bias: Bullish above 3,333.
• Watch for liquidity sweeps of intraday lows to catch new long entries, targeting 3420-3440.
⸻
💡 MJTrading View:
A structural shift and weekly strong close confirms bullish intent into next week.
As long as 3,333 holds, dips are buying opportunities.
⸻
Please share your opinions...
#MJTrading #GoldAnalysis #SmartMoney #LiquiditySweep #PriceAction #MarketStructure #Forex #TradingView #ChartDesigner #BullishMarket
Fortnight Overview:
Psychology Always Matters:
Smart Money Concept (SMC) XAU/USD Bearish Analysis – SMC
1. Market Context
The price is coming off a bullish expansion that mitigated areas of interest, but failed to break through supply structures with force, leaving an imbalance (FVG 4H) and pending liquidity at lower levels.
2. Consolidation Zone
After the surge, the market entered a consolidation phase (accumulation/distribution), forming BOS and ChoCh without generating new HH, a sign of buying weakness.
3. Fake Out and Rejection
A fake out trapped buyers and the price returned to the range, indicating liquidity absorption by institutional investors.
4. Bearish Interest
The previous LL and LH levels were not mitigated and act as price magnets. This creates bearish interest, with a high probability of seeking that liquidity.
5. Trading Plan
• Entry: Rejection at the resistance zone
• Confirmation: Failed retest and rejection (SMA rejection)
• Target: Next LL at the support zone
• Stop Loss: Above the resistance zone/fake out
Summary: The price is showing a distribution structure with accumulated liquidity below the support, increasing the probability of a bearish continuation.
GOOD LUCK TRADERS….

XAU/USD – Endphase der Circle Wave 1 & Vorbereitung auf die KorrOANDA:XAUUSD
We are currently in the final stages of the yellow (Circle) Wave 1 on Gold.
We have just completed wave 4.
How do I identify wave 4? Simple:
📏 I drew a trendline, and once that trendline was broken, the trend of wave 3 was considered complete.
However, we’ve now made a new low, which broke the low of wave 3 — this could very well be our wave A of wave 4 ⚠️.
I’m expecting one more final low, potentially around 3252, or even as low as 3200.
But personally, I lean towards ~3252 as the likely target 🎯.
After that, we should see a move upward into the yellow Fibonacci zone of wave 2 🟡.
The path from Circle 1 to Circle 2 will likely unfold as a corrective A-B-C structure to the upside 🔁.
Following that, we hopefully get a clean five-wave impulse into our (Circle) Wave 3 🚀.

GOLD 4H CHART ROUTE MAP UPDATE & TRADING PLAN FOR THE WEEKHey Everyone,
Please see our updated 4h chart levels and targets for the coming week.
We are seeing price play between two weighted levels with a gap above at 3354 and a gap below at 3297. We will need to see ema5 cross and lock on either weighted level to determine the next range.
We will see levels tested side by side until one of the weighted levels break and lock to confirm direction for the next range.
We will keep the above in mind when taking buys from dips. Our updated levels and weighted levels will allow us to track the movement down and then catch bounces up.
We will continue to buy dips using our support levels taking 20 to 40 pips. As stated before each of our level structures give 20 to 40 pip bounces, which is enough for a nice entry and exit. If you back test the levels we shared every week for the past 24 months, you can see how effectively they were used to trade with or against short/mid term swings and trends.
The swing range give bigger bounces then our weighted levels that's the difference between weighted levels and swing ranges.
BULLISH TARGET
3354
EMA5 CROSS AND LOCK ABOVE 3354 WILL OPEN THE FOLLOWING BULLISH TARGETS
3424
EMA5 CROSS AND LOCK ABOVE 3424 WILL OPEN THE FOLLOWING BULLISH TARGET
3499
EMA5 CROSS AND LOCK ABOVE 3499 WILL OPEN THE FOLLOWING BULLISH TARGET
3561
BEARISH TARGETS
3297
EMA5 CROSS AND LOCK BELOW 3297 WILL OPEN THE SWING RANGE
3236
3171
EMA5 CROSS AND LOCK BELOW 3171 WILL OPEN THE SECONDARY SWING RANGE
3089
3001
As always, we will keep you all updated with regular updates throughout the week and how we manage the active ideas and setups. Thank you all for your likes, comments and follows, we really appreciate it!
Mr Gold
GoldViewFX

Why do you always miss the real opportunities?Judging from the current gold trend, gold rose to a high of around 3368 and then entered a narrow range of fluctuations. Our previous long plan failed to continue to hold at the high level. Although some brothers may feel regretful, the market is always full of variables. We must flexibly adjust our thinking according to market changes. At present, there is a need for a retracement on the technical side. This retracement is not a trend reversal, but provides space for subsequent bullish momentum. Overall, the bullish trend is still dominant, but the current price is approaching the important pressure area of 3370-3385. The short-term carrying capacity has weakened, and it is not advisable to chase highs blindly. It is recommended to be cautious at high levels in operations. In the short term, it can be given priority to try to intervene with short positions in batches in the 3370-3385 area, waiting for a technical correction. If it subsequently retraces to the key support area of 3350-3335 and stabilizes, you can consider the long position layout again and continue to participate in the main bull trend.
Gold operation suggestion: short in batches in the 3370-3385 area, with the target at 3355-3350. If it falls back to the 3350-3335 area and stabilizes, consider entering a long position at the right time.
XAUUSD – Strong Bullish Reversal from Key Support XAUUSD – Strong Bullish Reversal from Key Support
Chart Summary:
Gold (XAUUSD) has shown a clear reaction from a strong support zone near 3260, suggesting bullish momentum is gaining strength. The chart highlights multiple key market structure elements and confirms the potential for a bullish move.
Technical Highlights:
🔻 Strong Support Zone (3260–3280):
Price tapped into a well-defined demand zone with historical significance, initiating a bullish response.
🔺 Resistance Zone (3460+):
A strong resistance level lies ahead. This area may act as a potential target for bulls.
🔁 Break of Structure (BOS):
Multiple BOS marks on the chart indicate trend shifts and liquidity grabs. Most recent BOS aligns with potential reversal.
💹 Bullish Fair Value Gap (FVG):
A bullish FVG near mid-structure confirms institutional interest and adds confluence to the upside move.
📈 Target: 3,366.984 USD
Marked as the next probable short-term liquidity target. If momentum sustains, price may approach resistance above this.
Price Expectation:
If the current bullish momentum holds above the strong support zone, we may see a rally towards 3,366–3,400 USD.
This move could be driven by:
Buy-side liquidity grab above prior highs
Breakout traders entering above BOS
Reaction to macroeconomic calendar (highlighted on the chart)
✅ Educational Takeaway:
This is a textbook example of:
Support-resistance flip
Liquidity concepts (Buy-Side Liquidity)
Fair Value Gaps usage
Volume Profile confluence

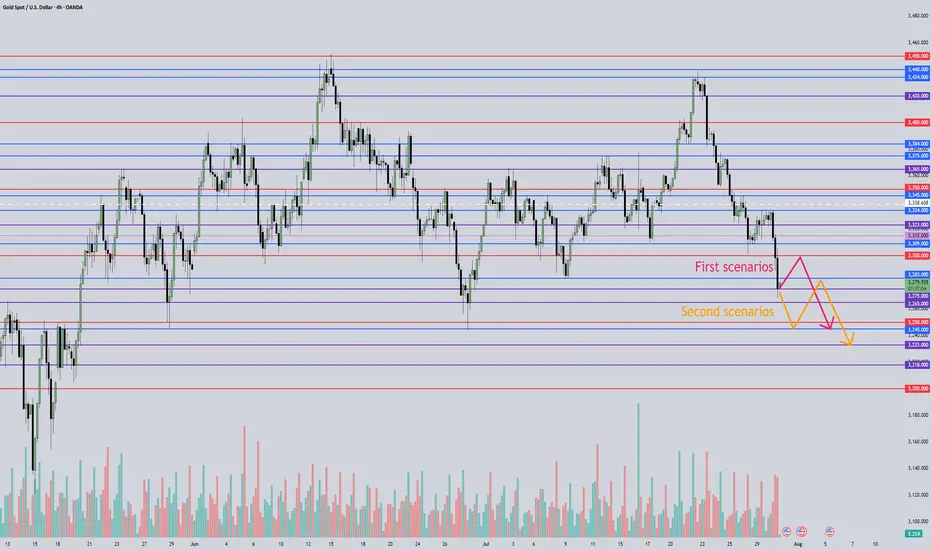
July 31, 2025 - XAUUSD GOLD Analysis and Potential OpportunitySummary:
The Fed held interest rates unchanged, and Powell’s remarks reduced the likelihood of a rate cut in September — this is fundamentally bearish for gold. Until new fundamental developments emerge, the strategy remains: sell on rallies into resistance.
After reviewing the 4H chart, I see two possible scenarios:
Price continues down to 3245, pulls back to 3283, then resumes the drop toward 3245 or even lower.
Price pulls back immediately toward 3300, then resumes the downtrend toward 3245.
These are ideal cases — I will still wait for clear confirmation before taking action.
🔍 Key Levels to Watch:
• 3323 – Resistance
• 3309 – Resistance
• 3300 – Psychological level
• 3283 – Key resistance
• 3268 – Short-term support
• 3260 – Support
• 3245 – Major support
• 3233 – Support
📈 Intraday Strategy:
• SELL if price breaks below 3268 → target 3265, then 3260, 3255, 3250
• BUY if price holds above 3283 → target 3289, then 3295, 3300, 3305
👉 If you find this helpful or traded using this plan, a like would mean a lot and keep me motivated. Thanks for the support!
Disclaimer: This is my personal view, not financial advice. Always use proper risk control.
GOLD short term Analysis. - 15 mins. Gold (XAU/USD) – Harmonic Pattern Analysis (15m Chart)
As of: August 5, 2025
🔶 Pattern Observed: Bearish Harmonic (likely Gartley or Butterfly)
Pattern Completion: Near 3385–3390 zone
The price has tested the PRZ (Potential Reversal Zone) and started showing early signs of weakness.
A clear "Short only below here" marker is drawn just below 3370, signaling key support.
🔻 Short Trade Thesis:
If price breaks and sustains below 3370, bearish confirmation is triggered.
This confirms the harmonic pattern's validity and opens the path for impulsive downside targets.
🎯 Downside Targets (if 3370 breaks):
First target: 3310–3320
Second target: 3265–3270
Final target (extended move): 3180–3200
⚠️ Invalidation:
If price breaks above 3395–3400, the harmonic setup is invalidated.
In such case, avoid any short setups and re-analyze price action for new trend direction.
Conclusion:
This harmonic pattern suggests a high-probability short setup below 3370, with clean targets mapped out. However, it's critically important to wait for confirmation (break and retest or strong momentum candle) before entry. If the price starts moving up from current levels without breaching 3370, this setup becomes invalid.
⚠️ Disclaimer:
This analysis is for educational and informational purposes only and should not be considered as financial advice. Trading commodities and financial instruments involves significant risk and may not be suitable for all investors. Please perform your own due diligence or consult with a licensed financial advisor before making any trading decisions. The author is not liable for any losses incurred based on this analysis.

Gold Surges on Non-Farm Data; 3330 Key Next WeekGold was strongly boosted by the significantly bullish non-farm payroll data, surging sharply like a rocket 🚀, with gains that completely "wiped out" all the weekly losses. The current gold trend, as if injected with super momentum, has completely broken the previous long-short stalemate. Starting from the 3300 level, it has been breaking through obstacles all the way up to 3350. At present, 3330 is like a critical "battleground" ⚔️ fiercely contested by both long and short sides.
This week, when gold was still "lingering" below 3300, I emphasized repeatedly that a rebound was inevitable – we just needed to stay calm and wait for the opportunity. As it turns out, our judgment was spot on, and we successfully took profits around 3340, reaping good gains 💴. Now, gold prices are oscillating back and forth in the 3340-3350 range. Based on a comprehensive analysis of the current trend, I boldly predict that gold is likely to pull back to around 3330 next week, so everyone can prepare in advance 🤗
⚡️⚡️⚡️ XAUUSD ⚡️⚡️⚡️
🚀 Sell@ 3350
🚀 TP 3330 - 3320 - 3310
🚀 Buy@ 3300 -3310
🚀 TP 3320 - 3330 - 3340
Daily updates bring you precise trading signals 📊 When you hit a snag in trading, these signals stand as your trustworthy compass 🧭 Don’t hesitate to take a look—sincerely hoping they’ll be a huge help to you 🌟 👇

Gold at a Crossroads: $100 Drop Ahead or New All-Time High?Gold is now sitting at a critical decision zone near the $3300 level — a key bank-level area. If we see a daily candle close below this level, I anticipate a minimum drop of 1,000 pips, with the first major support around the $3220–$3200 range. The $3200 level is extremely significant, and I’ll discuss its importance more in future updates if necessary.
On the flip side, if buyers step in and we get a daily close above $3300, I still believe it’s too early to jump into longs. The selling pressure remains quite obvious, and we’ve already seen multiple failed attempts to push beyond this level toward the $3500 all-time high. That tells me the orders at this level might be exhausted.
Personally, I’ll only consider a long position if we get at least a clean 4-hour candle close above $3350.
It’s going to be an exciting week ahead with high-impact data releases including ADP, Core PCE, the Federal Funds Rate — and most importantly, Friday’s NFP.
📌 Stay tuned for updates throughout the week!
Disclaimer: This is not financial advice. Just my personal opinion!!!

XAU/USD) Bearish Trend Read The captionSMC Trading point update
Technical analysis of Gold (XAU/USD) on the 1-hour timeframe, suggesting a potential short-term sell setup targeting a key support zone.
---
Analysis Summary
Asset: XAU/USD (Gold Spot)
Timeframe: 1H
Current Price: 3,371.56
Bias: Bearish pullback toward lower support
---
Key Technical Insights
1. FVG (Fair Value Gap):
Price tapped into a premium supply zone / FVG (highlighted in yellow at the top), showing rejection.
This zone likely acted as a liquidity grab, triggering potential reversal.
2. Structure Shift (SS):
Minor bullish market structure appears to be breaking down, signaling a shift in momentum.
3. Target Point:
Price is expected to revisit the support zone at 3,330.77, where prior accumulation and a bullish order block exist.
This also aligns with the 200 EMA around 3,340.48, adding confluence.
4. RSI (14):
RSI is currently at 54.86, indicating neutral momentum with room for downside.
---
Target Point
Target Zone: 3,330.77 (Key support and potential long re-entry area)
---
Trade Idea
Direction Entry Zone Stop-Loss Target
Sell 3,370–3,375 Above 3,390 3,330
Mr SMC Trading point
---
Summary
Gold is showing signs of short-term exhaustion after filling the FVG zone and is likely to pull back toward the 3,330 support area, making it a potential intraday short opportunity. The structure break, EMA, and RSI support this retracement.
Please support boost 🚀 this analysis)


XAUUSD: Market Analysis and Strategy for August 4th.Gold Technical Analysis:
Daily Chart Resistance: 3400, Support: 3300
4-Hour Chart Resistance: 3370, Support: 3330
1-Hour Chart Resistance: 3363, Support: 3352.
Last week's NFP data was positive for gold prices, sending gold prices sharply higher. The market trend was much stronger than expected, breaking through the resistance level of 3333 and then rising to around 3360.
The daily chart shows Friday's sharp rise, erasing the losses from the first four days of last week. This signals continued bullishness for this week and the market outlook.
However, for those of us who are day traders, please be cautious about buying at high levels. After all, excessive short-term gains in gold could lead to profit-taking.
Technically, the daily MACD fast and slow lines are about to form a golden cross near the zero axis, indicating that the downward correction is nearing its end. However, the 1-hour RSI indicator shows a strong overbought signal, suggesting continued movement towards the lower support level.
For today's trading, it's best to wait for a pullback before buying. This is both safer and offers greater profit potential. Focus on the lower support level around 3333-3320. Upside targets could be in the 3375-3390 range.
Buy: near 3330
Sell: near 3370

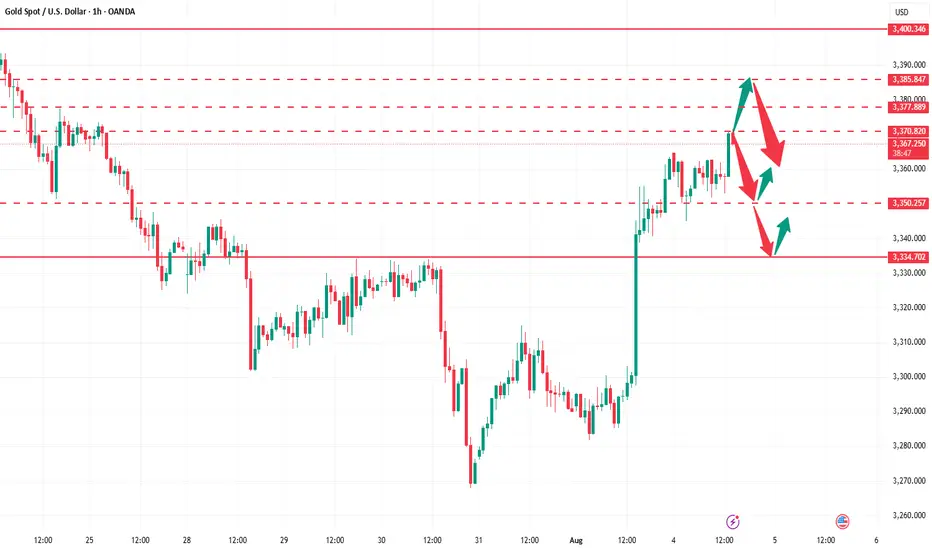
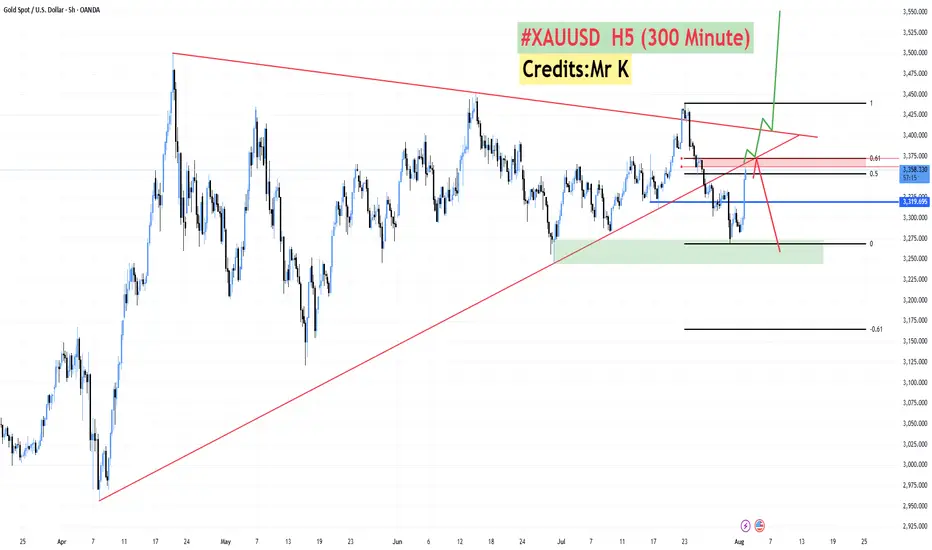
**#XAUUSD H5 Higher Timeframe Analysis**
📊 **#XAUUSD H5 Higher Timeframe Analysis**
What we witnessed today was a **tremendous recovery in Gold 🟡** after **3–4 consecutive bearish sessions 📉**.
📅 **Today’s candle** has **completely flipped the weekly structure**, turning a fully **bearish weekly candle into a bullish one 📈** — thanks to the **NFP data** that came in **favor of Gold and against the Dollar 💵❌**.
🔍 However, price is now approaching a **critical confluence zone**:
* 🧭 A **long-running trendline** (since April)
* 🔴 An **H4 Bearish Order Block**
* 📐 The **Fibonacci Golden Zone (0.50–0.618)** at **3362–3372**
📌 **From this level, we have two possible scenarios:**
1️⃣ **Sharp Rejection 🔻:**
Price may **reverse sharply** from the 3362–3372 zone and **resume the bearish trend**.
2️⃣ **Breakout & Trap Theory 🔺:**
If price **sustains above this zone**, it may signal that the recent **3–4 day drop was a fake breakdown**, designed to **trap sellers** and grab liquidity for a **further upside move**.
✅ **Confirmation will come if we get an H4–H6 bullish candle close above the trendline** and back inside the **buying zone of 3375–3390**.
🔓 **A breakout above the triangle pattern** will likely lead to a **strong bullish continuation 📈🚀**.
Gold long from 3295I think this might be the bottom .
Next week gold will be sitting at 3400$ level.
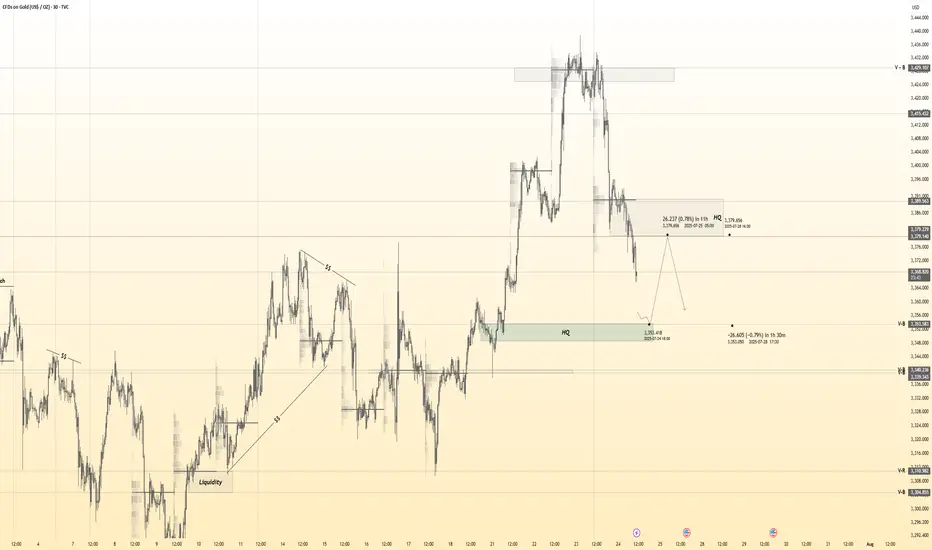
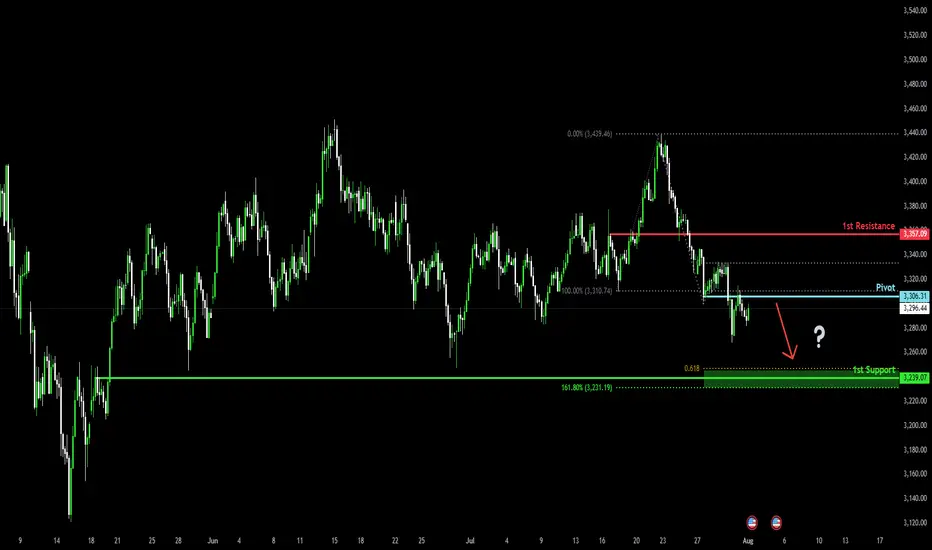
Potential bearish drop?The Gold (XAU/USD) has reacted off the pivot and could drop to the 1st support.
Pivot: 3,306.31
1st Support: 3,239.07
1st Resistance: 3,357.09
Risk Warning:
Trading Forex and CFDs carries a high level of risk to your capital and you should only trade with money you can afford to lose. Trading Forex and CFDs may not be suitable for all investors, so please ensure that you fully understand the risks involved and seek independent advice if necessary.
Disclaimer:
The above opinions given constitute general market commentary, and do not constitute the opinion or advice of IC Markets or any form of personal or investment advice.
Any opinions, news, research, analyses, prices, other information, or links to third-party sites contained on this website are provided on an "as-is" basis, are intended only to be informative, is not an advice nor a recommendation, nor research, or a record of our trading prices, or an offer of, or solicitation for a transaction in any financial instrument and thus should not be treated as such. The information provided does not involve any specific investment objectives, financial situation and needs of any specific person who may receive it. Please be aware, that past performance is not a reliable indicator of future performance and/or results. Past Performance or Forward-looking scenarios based upon the reasonable beliefs of the third-party provider are not a guarantee of future performance. Actual results may differ materially from those anticipated in forward-looking or past performance statements. IC Markets makes no representation or warranty and assumes no liability as to the accuracy or completeness of the information provided, nor any loss arising from any investment based on a recommendation, forecast or any information supplied by any third-party.
GOLD DAILY CHART ROUTE MAPHey Everyone,
Daily Chart Update – Bounce + Rejection: Structure Still Dominates
Just a quick follow up on our range structure, we got exactly what we were anticipating.
Price gave us the perfect bounce off 3272, launching into 3433 for THE test of resistance. That move delivered another clean 160+ pip rotation, once again showing how laser accurate the structure has been.
As expected, 3433 held as resistance, and the lack of a break and hold above confirms another clean rejection. The range between 3272 support and 3433 resistance remains firmly in play, and structure continues to govern price action to the pip.
Here’s where we are now:
🔹 Range Still Active
Price continues to rotate inside our 3272–3433 box. Until we see a clean break and close beyond either boundary, we’ll keep playing the range.
🔹 No Breakout = No Change
The failure to break and lock above 3433 confirms rejection. We’re still looking for EMA5 lock for potential breakout confirmation, until then, range trades rule.
🔹 Precision Holds
Both 3272 and 3433 have now been tested and held perfectly. The respect these levels continue to show reaffirms their importance in our roadmap.
Updated Key Levels
📉 Support – 3272
Continues to act as a major pivot. Valid long entries remain on dips into this zone, unless a breakdown occurs.
📈 Resistance – 3433
Now officially tested and confirmed. Watching closely for any future breakout attempts or another rotation lower.
Thanks again for all the amazing support. Sticking to the plan, trading the structure, and staying disciplined.
Mr Gold
GoldViewFX

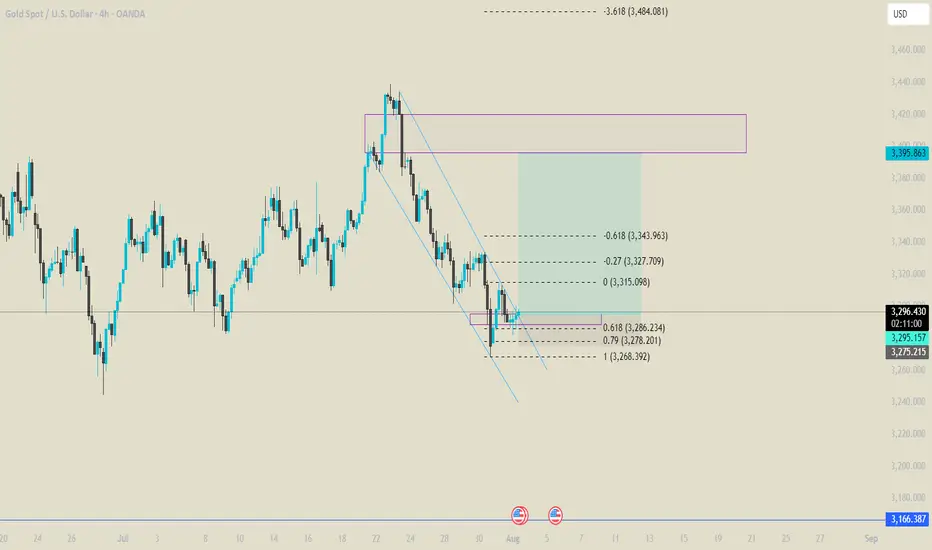
XAUUSD Technical AnalysisTechnical Analysis – Symmetrical Triangle with Retest
Current Market Situation
The chart shows a symmetrical triangle pattern, which is a continuation pattern often followed by strong directional movement.
The price has broken below the triangle, signaling a potential bearish move.
Currently, the price is in the retest phase of the broken triangle, which is an important area to confirm the bearish trend before continuing downward.
Key Zones
Retest Zone (Pullback): Located between current price and 3,374, which is a strong resistance area.
Targets (TP):
TP1: 3,322.97
TP2: 3,285.87
TP3: 3,262.59
Possible Scenarios
✅ Bearish Scenario (Preferred):
If the price holds below the retest zone, we expect a continuation to the downside towards:
Target 1: 3,322.97
Target 2: 3,285.87
Target 3: 3,262.59
⚠ Bullish Scenario (Alternative):
A daily close above 3,374 will invalidate the bearish scenario and may trigger a reversal.
Conclusion
The market shows a strong technical indication of a bearish continuation after confirming the retest.
Any daily close above 3,374 would cancel the bearish scenario.
It is recommended to monitor price action closely in the retest zone for confirmation before entering trades.
