XAU/USD | Gold Below $3345 – Key Demand Awaits at $3282–$3296!By analyzing the gold chart on the 4-hour timeframe, we can see that after dropping to the $3301 area, strong demand came in, helping the price stabilize above $3300 and rally up to over $3334. Currently, gold is trading around $3331. If the price fails to break and hold above $3345 within the next 8 hours, we may see a price correction soon. A key demand zone lies between $3282–$3296, where a strong bullish reaction could occur if price revisits this area. Important supply levels to watch are $3366, $3382, $3393, and $3404.
Please support me with your likes and comments to motivate me to share more analysis with you and share your opinion about the possible trend of this chart with me !
Best Regards , Arman Shaban
GOLD trade ideas

GOLD prep work to ATH retap has started. seed at 3270!First thing first.
Diagram above is in reverse metrics (USDXAU)
--------
GOLD, has been met with some well deserved respite on price growth after a series of parabolic highs this past few weeks. And this healthy trims are warranted in the grand scheme of things -- to sustain its upward trajectory. A price rest is definitely welcomed.
Now based on our latest daily metrics, gold is showing some low key hints of shift -- it may not be visible to 99% of traders -- but it is there now to magnify.
Diagram above is in reverse metrics (USDXAU). It is currently showing some pressure expansion for bears and hinting of prep work to reverse.
This is a precursor of a massive structure change-- for that elusive upside continuation.
On the daily metrics, we got some hop signals here as well from -- first one in a while. Price baselines detaching itself from the descending trend line. There maybe something here now. A good zone to seed on the most discounted bargain levels -- with safety.
Spotted at 3260.
Interim mid target: ATH at 3500
Long term. 4k++
Trade safely.
TAYOR.

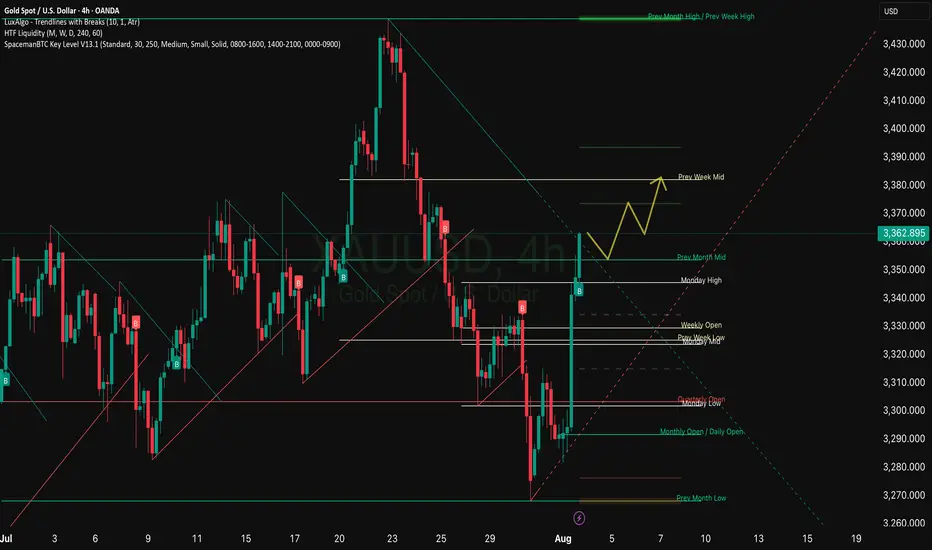
XAU/USD - Potential Targets this WeekDear Friends in Trading,
How I see it,
Let me know if anything is unclear, inputs and questions always welcome.
I don't always have the right answers, but I do share my opinion freely.
I sincerely hope my point of view offers a valued insight
Thank you for taking the time study my analysis.

Bulls maintain weekend above 3400⭐️GOLDEN INFORMATION:
Gold (XAU/USD) eased back from a more than two-week high near $3,409–3,410 during Friday’s Asian session, as traders booked profits ahead of the weekend. A broadly positive tone in equity markets, coupled with a modest rebound in the U.S. Dollar, added to the downward pressure on bullion. Even so, several factors continue to underpin the metal, urging caution for aggressive bearish positioning.
Lingering trade-related uncertainty—intensified by President Donald Trump’s latest tariff threats this week—has helped maintain gold’s safe-haven appeal. At the same time, growing expectations that the Federal Reserve will resume its rate-cut cycle in September are likely to cap any sustained dollar strength, encouraging dip-buying interest around the $3,380 level.
⭐️Personal comments NOVA:
Tariff tensions, along with a very positive market about the possibility of interest rate cuts, helped gold prices return above the 3400 zone.
⭐️SET UP GOLD PRICE:
🔥SELL GOLD zone: 3428- 3430 SL 3435
TP1: $3418
TP2: $3408
TP3: $3392
🔥BUY GOLD zone: $3373-$3371 SL $3366
TP1: $3382
TP2: $3395
TP3: $3410
⭐️Technical analysis:
Based on technical indicators EMA 34, EMA89 and support resistance areas to set up a reasonable BUY order.
⭐️NOTE:
Note: Nova wishes traders to manage their capital well
- take the number of lots that match your capital
- Takeprofit equal to 4-6% of capital account
- Stoplose equal to 2-3% of capital account


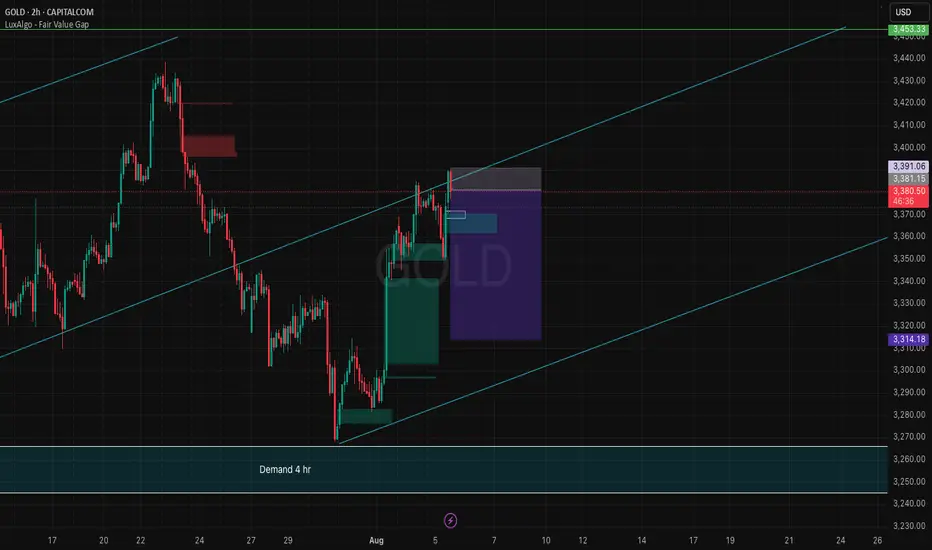
XAUUSD H2 | Downside Target 3270Gold (XAUUSD) recently rejected from a key resistance zone around 3300, showing strong bearish momentum on the 2H timeframe.
💡 Setup Idea:
• Price broke support → Retest as new resistance ✅
• Clean imbalance left behind → Fills expected 📉
• Target: 3270 zone (300 pips move) 🎯
• Risk-Reward potential is solid for intraday/swing entries.
Trade Plan:
If price holds below 3300, we expect continuation toward the 3270 zone. This area also aligns with previous structure and liquidity grab.
🕐 Timeframe: 2H
📌 Resistance: 3300
🎯 Target: 3270
📍 RR: 1:2+
#XAUUSD #GoldSetup #PriceAction #SmartMoney #FXTrading #TradingView #ForYou

GOLD ROUTE MAP UPDATEHey Everyone,
Following yesterday’s move into the 3305 retracement range, we got the expected reaction without an EMA5 lock, which further confirmed the rejection from that level and led to a clean bounce into 3228 just like we analysed.
From here, we anticipate price to range between 3328 and 3305. EMA5 cross and lock above 3328 or below 3305 will be key to confirming the next directional move.
We’ll continue to monitor for that confirmation and adjust accordingly.
We will keep the above in mind when taking buys from dips. Our updated levels and weighted levels will allow us to track the movement down and then catch bounces up.
We will continue to buy dips using our support levels taking 20 to 40 pips. As stated before each of our level structures give 20 to 40 pip bounces, which is enough for a nice entry and exit. If you back test the levels we shared every week for the past 24 months, you can see how effectively they were used to trade with or against short/mid term swings and trends.
The swing range give bigger bounces then our weighted levels that's the difference between weighted levels and swing ranges.
BULLISH TARGET
3348
EMA5 CROSS AND LOCK ABOVE 3348 WILL OPEN THE FOLLOWING BULLISH TARGETS
3369
EMA5 CROSS AND LOCK ABOVE 3369 WILL OPEN THE FOLLOWING BULLISH TARGET
3397
EMA5 CROSS AND LOCK ABOVE 3397 WILL OPEN THE FOLLOWING BULLISH TARGET
3422
BEARISH TARGETS
3328 - DONE
EMA5 CROSS AND LOCK BELOW 3328 WILL OPEN THE FOLLOWING BEARISH TARGET
3305 - DONE
EMA5 CROSS AND LOCK BELOW 3305 WILL OPEN THE SWING RANGE
3289
3267
As always, we will keep you all updated with regular updates throughout the week and how we manage the active ideas and setups. Thank you all for your likes, comments and follows, we really appreciate it!
Mr Gold
GoldViewFX

xauusdPrevious analysis failed
If the last bottom is not broken, we will most likely
According to the analysis, we will have gold price movement

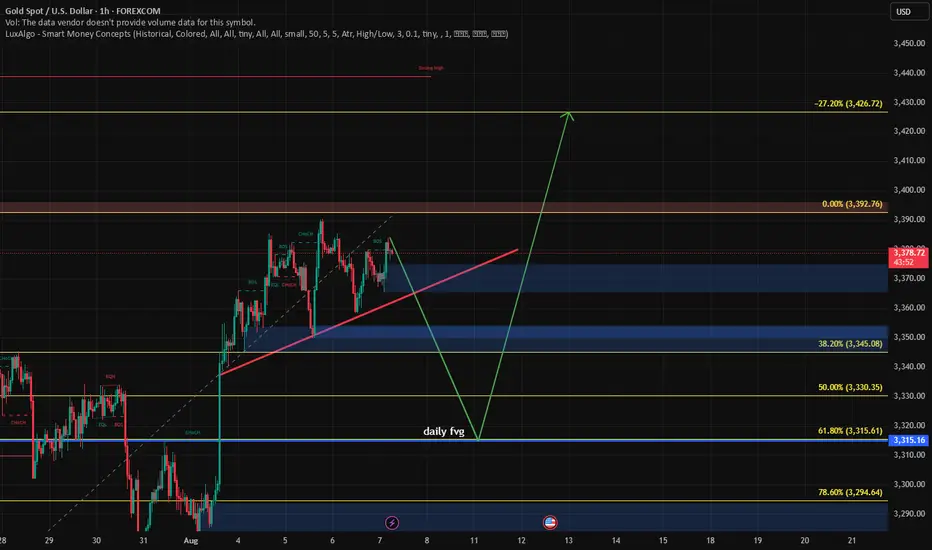
XAUUSD to the moon Current situation: price around $3360, short-term targets — rebound to $3415–3420 or fall to $3330–3300.
Trend: moderately bullish, but consolidation is possible in the quarter. Sustainable growth is possible with lower rates and increased geo-risks.
Tactics: consider buy on dip positions around $3330–3350 with a target of $3400+, or sell on rise in the $3415+ zone with signs of indicator reversal or dollar growth.
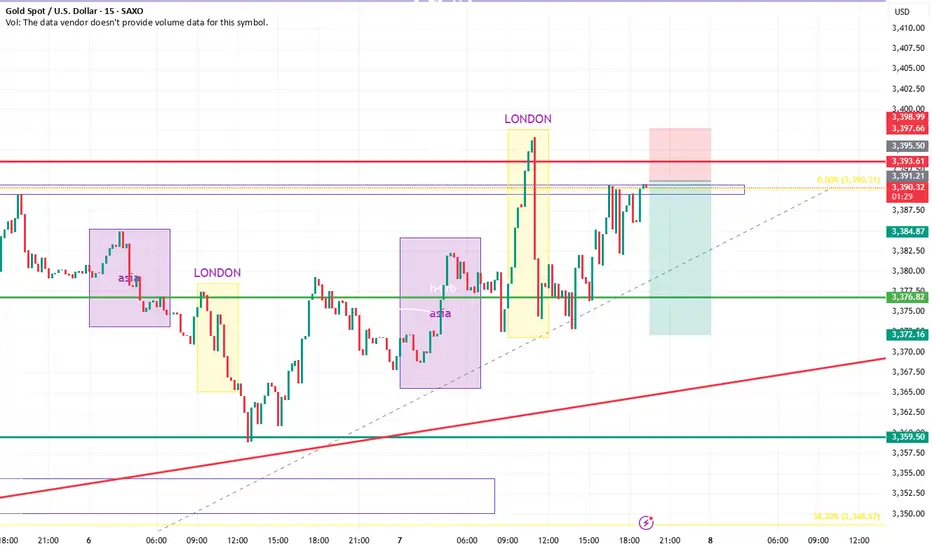
How to seize the best entry point for gold?Gold continued its bullish trend from last Friday, rising to a high of 3385 yesterday. However, the upward momentum failed to sustain, and new highs were not reached during today's Asian and European trading sessions. The short-term bullish trend has ended, and the market is showing signs of correction. Currently, gold is facing downward pressure in the short term, and the short-term trend is volatile. Strategically, we can watch for a rebound to the 3375-3385 area during the European trading session and try to participate in short-term short selling. The target is below 3365-3355. The long-term structure remains bullish. Therefore, if the price falls back to the 3355-3340 area and stabilizes, we can still consider entering long positions to continue the medium-term uptrend. In terms of trading, we should pay attention to the rhythm of the market, betting on rebound resistance with short-term short positions and then going long on dips, maintaining flexibility.

Gold Outlook This is my personal conviction on golds outlook \, anything can happen, always remember I do not won the market
GOLD Breakdown: Key Levels, Smart Money Trap & Price RecapHere's a full breakdown on GOLD covering the major levels I'm watching today, what the market did yesterday, and a key trap that many traders fall for.
This video is for educational purposes only and based on my personal trading plan.

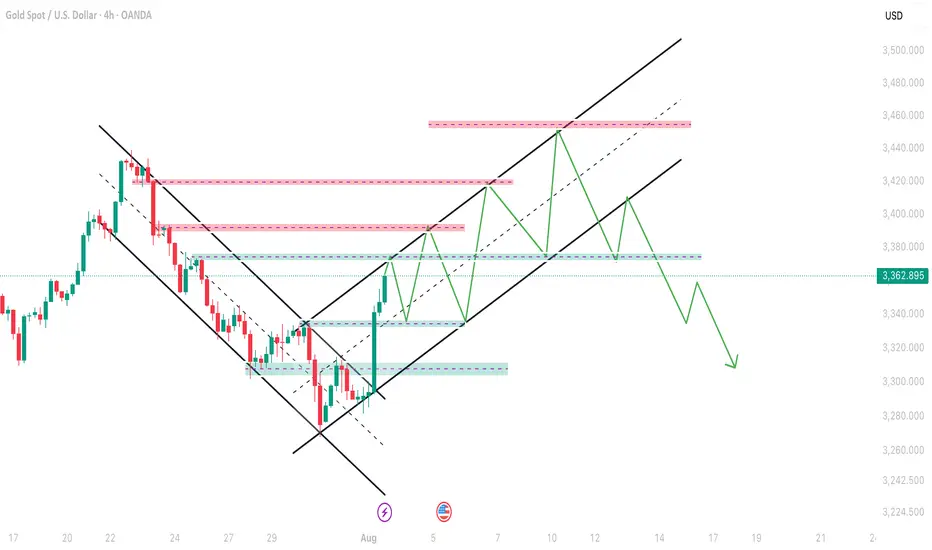
Gold Plan B For 4 Aug onwardsAs you can see that gold is moving good in channel of Bullish so next hurdle can be 3374-3380 and then it can retest the support of Non-Farm 3336-3340 and then continue this channel till further 3452-3458 and then we can expect a big fall in gold and this time support point will be 3290-3300 which will hold gold to go up again.
Gold breaks through 3400 and is about to challenge a new high
💡Message Strategy
Fundamental Analysis: The Macro Environment and Policy Expectations Are Intertwined
From a fundamental perspective, the recent trend in gold prices is driven by multiple factors. First, rising expectations for a September Federal Reserve rate cut have become a key factor supporting gold prices. Last Friday's US non-farm payroll data, which fell short of expectations and saw a significant downward revision from the previous reading, fueled market concerns about an economic slowdown and pushed US Treasury yields lower.
The increased expectations for a rate cut have reduced the upside potential for the US dollar and US Treasury yields, indirectly providing support for gold.
In terms of market sentiment, a rebound in global stock markets has weakened gold's safe-haven demand. The MSCI World Index snapped a six-day losing streak, with the Asia-Pacific Index rising 0.6%. Japan's Nikkei 225 rose 280 points on Tuesday. Europe's STOXX 50 and STOXX 600 indices both rose approximately 0.4%. The UK's FTSE 100 approached its all-time high of 9,150 points. The three major US stock indices performed particularly strongly on Monday, with the S&P 500 rising 1.5%, the Dow Jones Industrial Average soaring 585 points, and the Nasdaq Composite Index rising 1.9%.
The recovery of risk appetite has made investors more inclined to chase high-yield assets, and the attractiveness of gold has temporarily declined.
📊Technical aspects
Technically, gold is likely to continue trading in a narrow range between its 50-day and 100-day moving averages. Key support levels at $3,350 and resistance at $3,385 will be the focus of near-term bull-bear trading. A breakout from fundamental data or news could signal a clearer trend for gold prices.
In the long term, slowing global economic growth, central bank gold purchasing, and persistent geopolitical risks will continue to provide structural support for gold.
If the bulls can regain their footing on the bottom of the ascending triangle pattern and break through the resistance level of $3,380, gold prices are expected to further challenge $3,440 and even retest the historical high.
💰Strategy Package
Long Position:3370-3375,SL:3350,Target: 3400-3420
GOLD Short From Resistance! Sell!
Hello, Traders!
GOLD surged up sharply
On Friday and is already
Retesting the horizontal
Resistance of 3377$
From where we will be
Expecting a local pullback
On Monday as Gold
Is locally overbought
Sell!
Comment and subscribe to help us grow!
Check out other forecasts below too!
Disclosure: I am part of Trade Nation's Influencer program and receive a monthly fee for using their TradingView charts in my analysis.

xau usd a probable scene Market can sweep its trend line liquidity and could take another buy entry at the given level.. and also can go to the target ...its just for an educational and study purpose , i dont recommend to take trade at this point. just watch and see
XAUUSD 4Hour TF - August 3rd,2025🟦 XAUUSD 4H Analysis Long Idea
📅 August 3rd, 2025
🔹 Top-Down Trend Bias:
• Monthly – Bullish
• Weekly – Bullish
• Daily – Bullish
• 4H – Bullish
Price has broken out of a consolidation, confirming short term bullish momentum in alignment with the higher timeframes. We’re now watching how price reacts on a potential retest of the key $3,320 structure.
🔍 Key Level: $3,320
This former resistance now acts as a critical support zone. How price reacts here will determine short-term direction.
✅ Scenario A: Bullish Continuation
Clean retest of $3,320–$3,335
1.Look for bullish confirmation: wick rejections, bullish engulfing, or lower timeframe structure shift
Target 1: $3,395
Target 2: $3,450
This setup aligns with the overall bullish bias. We have ideal R:R with a clear invalidation to exit on if $3,320 fails as support.
⚠️ Scenario B: Bearish Rejection
1.Failure to hold $3,320 = potential trap breakout
2.Look for structure below $3,320 + bearish conviction
Target: $3,225 support zone
Only valid if $3,320 flips to resistance and confirms structure shift.
🧠 Final Notes
• Let price confirm the setup
• Structure > emotion
• Both scenarios are valid, but only with confirmation

GOLD TO FILL THE IMBALANCE/BSL As the gold was touched the demand zone and fvg at the level of 3400/3419 we will see the trend reversal towards the imbalance/fvg with the buyside liquidity to be taken out.
We can set the trade when it will retest the demand zone again.

Daily gold analysisDaily gold analysis
A long position with the target and stop loss as shown in the chart
The trend is up, we may see more upside
All the best, I hope for your participation in the analysis, and for any inquiries, please send in the comments.
He gave a signal from the strongest areas of entry, special recommendations, with a success rate of 95%, for any inquiry or request for analysis, contact me
Elliott Wave Analysis – XAUUSD, August 4, 2025📊
🔍 Momentum Analysis:
D1 Timeframe: Momentum continues to rise strongly. It's expected that the price will keep rising for at least two more trading days, pushing the momentum indicator into the overbought territory, reinforcing the current bullish trend.
H4 Timeframe: Momentum is showing signs of a potential bearish reversal, indicating a possible corrective pullback during Monday’s trading session.
H1 Timeframe: Momentum is strongly bullish, especially evident from the powerful upward move on Friday. Price may continue rising at the open of the Asian session, potentially creating a Gap. However, caution is advised, as this Gap could signal exhaustion.
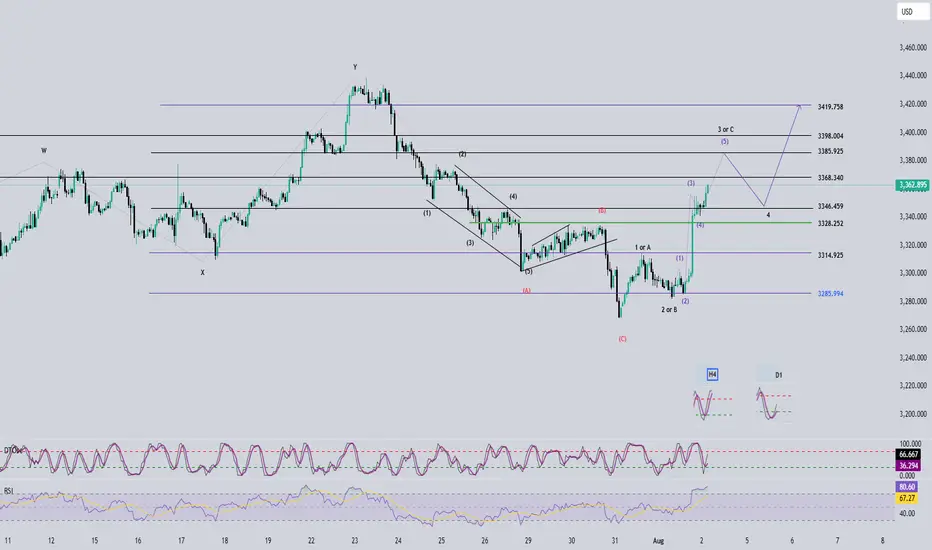
📌 Wave Pattern Analysis:
Given Friday's strong price action, the primary scenario currently favors wave 3 within the 5-wave bullish structure (12345 – black). However, we cannot entirely eliminate the possibility that this is wave C within an ABC corrective structure (black).
Presently, the price is forming a smaller 5-wave bullish structure (blue), likely in the final wave 5. Attention should be paid to two critical target zones:
🎯 Blue Wave 5 Targets:
• Target 1: 3368
• Target 2: 3385
⚠️ Next Scenario:
Upon completing the blue 5-wave structure, a corrective move downward will occur.
• If the correction does not break below 3315, the larger 5-wave bullish structure (12345 – black) is confirmed, and the price will continue upward to complete black wave 5.
• If the correction breaks below 3315, the structure shifts to an ABC corrective pattern (black), increasing the likelihood of a deeper decline to complete the larger corrective wave C (red).
🧩 Combining Momentum & Wave Analysis:
• D1 momentum strongly supports the continuation of the bullish trend.
• H4 momentum forecasts a short-term bearish correction on Monday, aligning with the formation of wave 4 correction.
• H1 momentum suggests the possibility of a Gap at Monday's Asian session open, marking the beginning of a corrective pullback as momentum reverses.
🎯 Short-term Trading Plan:
We will trade the current blue wave 5 with the following limit order plan:
✅ Sell Limit Zone: 3385 – 3387
⛔️ Stop Loss (SL): 3399
🎯 Take Profit (TP1): 3368
🎯 Take Profit (TP2): 3355
📌 Note:
The detailed trading plan for capturing the larger wave 4 correction (black) will be updated once sufficient evidence confirms the completion of the blue wave 5.
Happy trading, everyone! 🚀
XAUUSD Analysis todayHello traders, this is a complete multiple timeframe analysis of this pair. We see could find significant trading opportunities as per analysis upon price action confirmation we may take this trade. Smash the like button if you find value in this analysis and drop a comment if you have any questions or let me know which pair to cover in my next analysis.

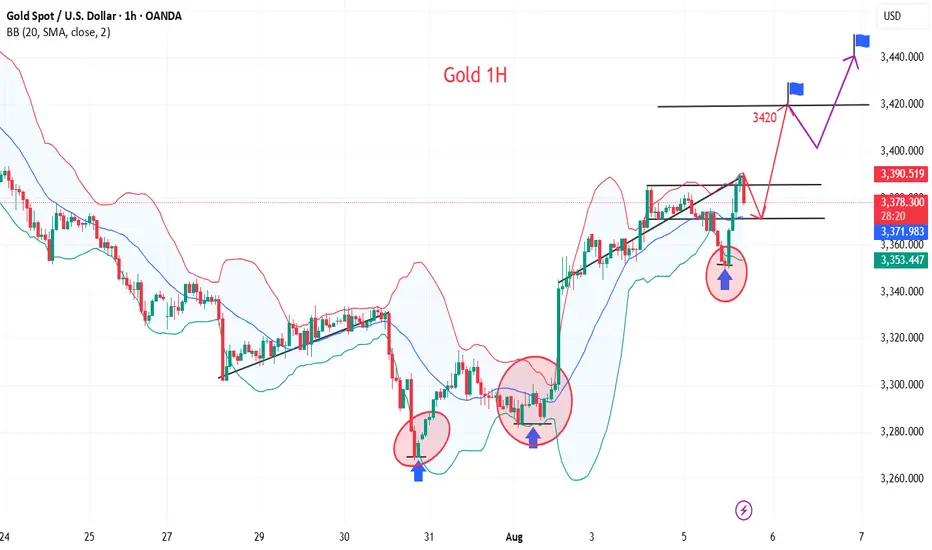
GOLD 1H 5AUGHello to all traders. 😎😎
I hope all your deals will hit their targets. 🎉🎉
I have identified two paths for gold for today.
In the red movement we have a downward fall and a fair value gap filling and a fall to the $3300 range
and in the black path we have a correction to the $3360 to $3365 range and then a rise to the $3395 to $3400 range.
In any case, I think we will have a correction at least to the $3365 range and then we can decide whether the market will fall or rise from that range.
⚠️⚠️⚠️⚠️Don’t forget to apply proper risk management!
What Do You Think?
Which scenario do you think is happen? **Share your thoughts!** ⬇️
Don't forget that this is just an analysis to give you an idea and trade with your own strategy. And don't forget the stop loss🛑🛑🛑
❤️❤️❤️The only friend you have in financial markets is your stop loss❤️❤️❤️
Please support me with your ✅' like'✅ and comments to motivate me to share more analysis with you and share your opinion about the possible trend of this chart with me 🙏😊
Be Happy , Ali Jamali
