Xausd techinical analysis.Xausd techinical analysis next move posibale at h1 time frame not finchinical advice.
GOLD trade ideas

Accumulation pattern awaiting breakout confirmationIntraday Outlook: Accumulation pattern awaiting breakout confirmation
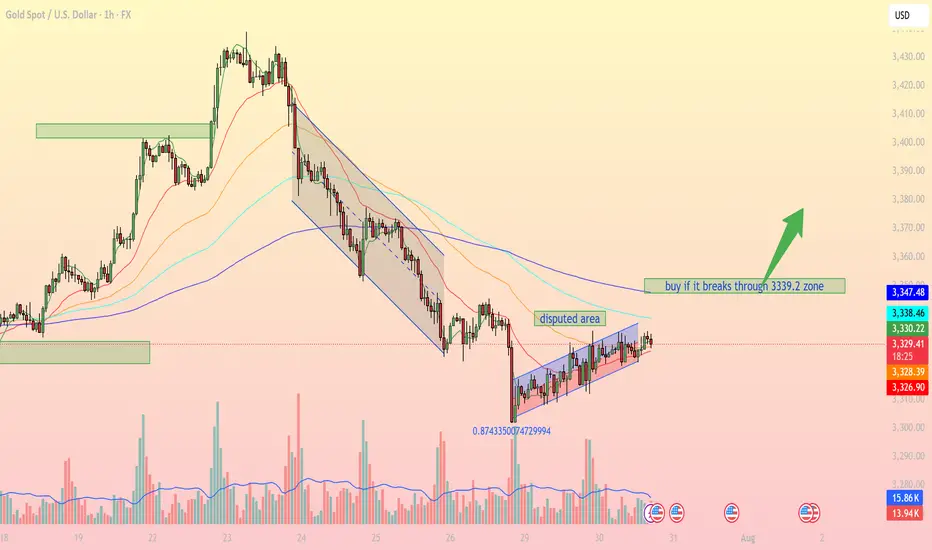
On the 1H timeframe, XAUUSD is forming a clear consolidation pattern within a narrow ascending channel after falling from a prior distribution zone. Buyers are attempting to regain control, but strong resistance remains around the 3,339 – 3,347 USD area.
1. Technical Breakdown:
Trendline & Channel: Price is currently moving inside a small rising channel, indicating a short-term bullish bias, though momentum remains limited.
EMA Dynamics: EMA 20, 50, and 100 are beginning to converge, signaling a potential breakout. A bullish EMA crossover (EMA20 > EMA50) could confirm stronger upward momentum.
Disputed Area: This zone represents heavy indecision between bulls and bears. A clear breakout above or below is needed for directional clarity.
Fibonacci Level: The 0.874 retracement level from the recent low shows strong buyer interest, potentially forming a short-term bottom.
2. Key Support & Resistance Levels:
3,339.2 USD Major resistance – needs to be broken for bullish continuation
3,347.4 USD Next resistance if breakout occurs
3,328.2 USD Immediate support (current price zone)
3,326.7 USD Strong support if price retraces
3. Suggested Trading Strategies:
Scenario 1 – Breakout Buy Strategy:
Entry: Buy if price breaks and closes above 3,339.2 USD on the 1H chart.
Stop Loss: Below 3,328 USD.
Take Profit: First target at 3,347, extended targets at 3,358 and 3,372 USD.
Scenario 2 – Pullback Long Entry:
If price fails to break resistance, consider buying the dip near the 3,326 – 3,328 USD support zone for a better risk-reward setup.
Scenario 3 – Breakdown Sell Setup:
If price breaks below 3,326 USD and exits the channel, a bearish move towards 3,295 – 3,300 USD becomes likely.
Gold is in a key consolidation phase, with the 3,339 USD resistance acting as the decisive breakout zone. Traders should closely monitor price action, volume, and EMA behavior to catch the next directional move.
Follow for more trading strategies like this. Save this post if you find it useful!
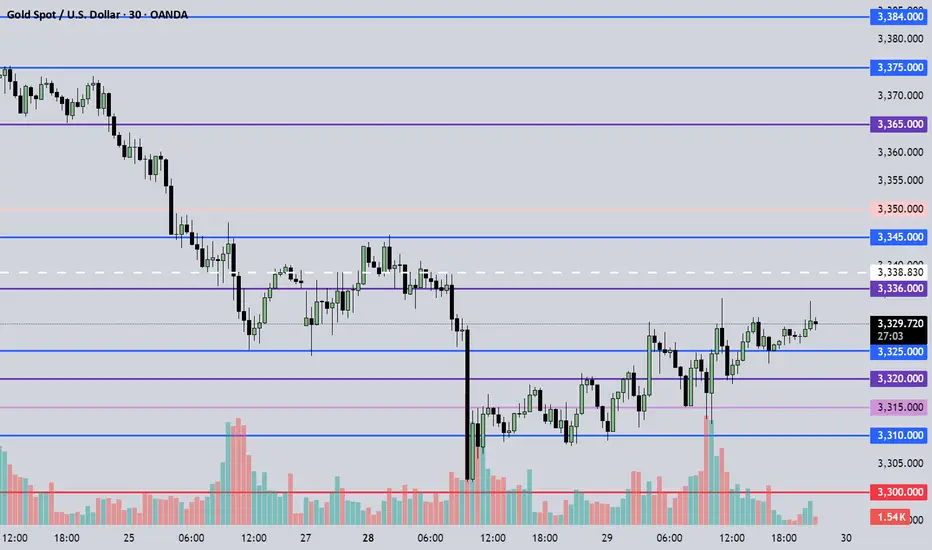
July 30, 2025 - XAUUSD GOLD Analysis and Potential Opportunity🔍 Key Levels to Watch:
• 3384 – Resistance
• 3375 – Key resistance
• 3365 – Resistance
• 3345 – Resistance
• 3336 – Resistance
• 3325 – Key support
• 3310 – Support
• 3300 – Psychological level
• 3283 – Major support
• 3275 – Support
• 3265 – Support
📈 Intraday Strategy:
• SELL if price breaks below 3325 → target 3320, then 3315, 3310, 3300
• BUY if price holds above 3330 → target 3336, then 3345, 3350, 3356
👉 If you find this helpful or traded using this plan, a like would mean a lot and keep me motivated. Thanks for the support!
Disclaimer: This is my personal view, not financial advice. Always use proper risk control.
Gold - Breakout and retest of a bullish FlagBullish flag break out and price is in a demand zone. As long as the demand holds, pressure will be to the upside.

August 4, 2025 - XAUUSD GOLD Analysis and Potential OpportunitySummary:
Gold is currently in a sideways-to-bullish structure. Strong resistance remains around 3440–3450; if this level fails to break, it offers a high-probability shorting opportunity. Near-term focus is on the 3350 support level — if it breaks, bearish momentum may pick up and selling the pullback becomes ideal. If 3350 holds, consider buying the dip and targeting a test of 3375. Stay flexible and responsive to price action at key levels. Manage risk accordingly.
📍 Key Levels to Watch:
• 3400 – Resistance
• 3384 – Resistance
• 3375 – Key resistance
• 3365 – Resistance
• 3350 – Psychological level
• 3345 – Support
• 3334 – Key support
• 3323 – Support
• 3310 – Support
📈 Intraday Strategy
SELL if price breaks below 3350 → target 3340, then 3334, 3323, 3315
BUY if price holds above 3365 → target 3370, then 3375, 3384, 3394
👉 If you find this helpful or traded using this plan, a like would mean a lot and keep me motivated. Thanks for the support!
Disclaimer: This is my personal view, not financial advice. Always use proper risk control.

SUPER BUY GOLD XAUUSD Gold has ripped all levels of take profit and has gone up and gave us a small amount of drawdown with huge gains in return, simple trading price action and (M&Ws)

XAU / USD 4 Hour ChartHello traders. We have news thins morning, we have Trump and Powell this afternoon. I am not trading the news, but I did mark the area we need to break out of. I can see this going either way. I will check back later. Be well and trade the trend. Beware the volatility and trade safely today. Big G gets a shout out.

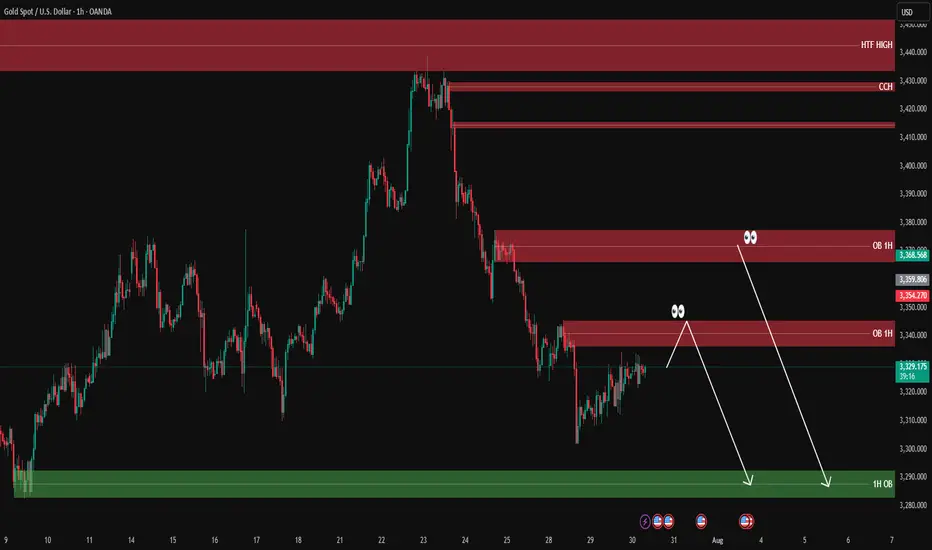
XAUUSD analysis - 1H FVG and OB setupsOn the 1H timeframe, price is currently approaching two key supply zones (OB 1H):
🔴 First OB zone: around 3354 – 3360
🔴 Second OB zone: around 3368 – 3370
We're watching these zones for potential short setups, only with confirmation on the lower timeframes (5M or 3M).
If price reacts to one of these OBs, we expect a move down toward the green 1H demand zone around 3280 – 3290, where a long setup may later form.
📌 Key scenarios:
1️⃣ Price hits the first OB → confirmation → short
2️⃣ Price moves to the second OB → confirmation → short
3️⃣ Target for both setups = green OB around 3280
4️⃣ No entry without confirmation from LTF
❗️ Do NOT enter without lower timeframe confirmation.
GOLD Will Go Up! Buy!
Take a look at our analysis for GOLD.
Time Frame: 2h
Current Trend: Bullish
Sentiment: Oversold (based on 7-period RSI)
Forecast: Bullish
The market is approaching a key horizontal level 3,372.49.
Considering the today's price action, probabilities will be high to see a movement to 3,395.61.
P.S
Please, note that an oversold/overbought condition can last for a long time, and therefore being oversold/overbought doesn't mean a price rally will come soon, or at all.
Disclosure: I am part of Trade Nation's Influencer program and receive a monthly fee for using their TradingView charts in my analysis.
Like and subscribe and comment my ideas if you enjoy them!

Will gold continue to fall on July 29:
Comprehensive analysis of the gold market and trading strategy recommendations
News analysis
Short-term support factors
Weakened US dollar: The market is in a wait-and-see mood before the Fed's interest rate meeting, and the US dollar bulls are temporarily suspended, providing support for interest-free assets such as gold.
Safe-haven demand: Policy uncertainty (such as the Fed's interest rate decision) may trigger a short-term return of funds to gold.
Repressive factors
Trade situation easing: The US-EU tariff agreement, US-Japan and US-China trade progress boost risk appetite and weaken the safe-haven appeal of gold.
Bull-bear game: Gold is currently at a balance between "macro game" and "technical adjustment", and needs to wait for the FOMC statement and economic data (GDP, PCE) to guide the direction.
Technical analysis
Long-term trend (monthly/weekly)
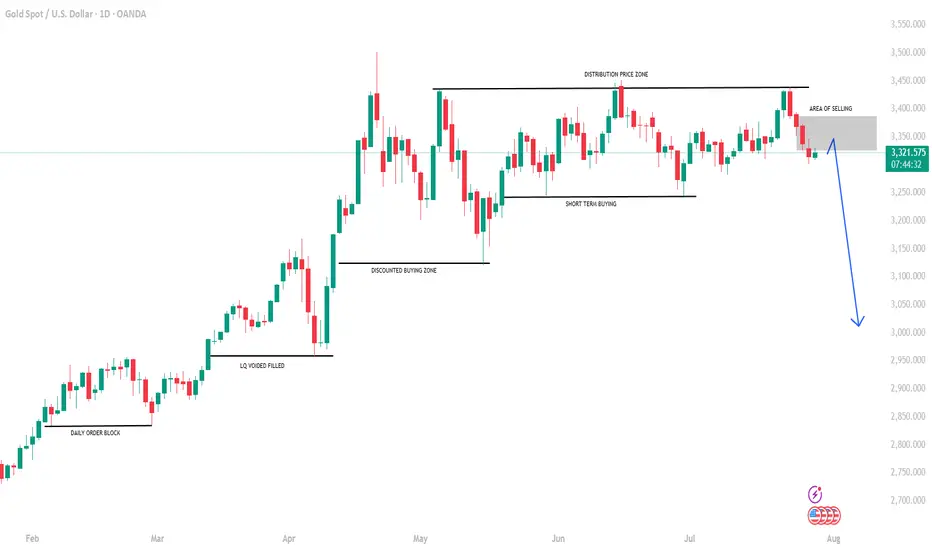
Top signal appears: 3 consecutive months of long upper shadows (April-June). If the long upper shadow is closed again in July, it may confirm that the bears are dominant, and the market may drop to the 3000-2950 area in the future.
Key resistance: 3400-3500 area is a historically strong pressure. Even if the Fed cuts interest rates to stimulate the rise, it may form a "lure to buy" and then reverse.
Short-term key position (daily/4 hours)
Bull-short watershed: 3350 is the short-term strong and weak boundary. If it breaks through, it will look up to 3370-3405; if it is under pressure, it will look down to 3330-3290.
Oscillation characteristics: The recent long-short continuity is poor (such as last week's sharp rise and then a sharp drop), so be wary of repeated washes.
Today's operation strategy
Short-order opportunity
Entry area: 3330-3340 (aggressive investors can arrange in batches), stop loss above 3350.
Target position: 3290-3280, look at 3245 after breaking down.
Long-order opportunity
Pullback support: 3290-3280 light position to try long, stop loss below 3270, target 3310-3320 (short-term rebound).
Breakthrough follow-up
Break above 3350: Wait and see if it is a false breakthrough. If it stabilizes, you can buy short-term to 3370-3405 (need to cooperate with the Fed's dovish signal).
Break below 3280: Be cautious when chasing shorts, avoid low-level sweeps, and pay attention to the support of 3245.
Risk warning
Federal Reserve decision: If the interest rate is cut but the "hawkish expectations" are released (such as the subsequent suspension of interest rate cuts), gold may rise and fall.
Data impact: If GDP/PCE is stronger than expected, it may strengthen the US dollar and suppress gold prices.
Summary: At present, gold is in a volatile bearish pattern. It is recommended to sell short at the rebound high as the main trading idea, and strictly stop loss. Conservatives can wait for the trend to become clear after the Fed's decision before making a layout.
GOLD: Time for massive drop? +3000 pips move! Gold has failed to breakthrough the previous resistance indicating a strong sellers hold around $3440 region. Now since the price has stared dropping we can see it dropping around $2800 in long term. In order for this to happen we need strong confirmation, which will help us understand the possible volume.
Agree with our idea?
Like and comment!
GOLD - Monthly breakout retest may confirm multi-year bull cycleHello everyone, what are your thoughts on the long-term outlook for XAUUSD?
Looking at the monthly chart (1M), we can clearly see that XAUUSD has broken out of the long-standing ascending channel that has held since 2015 — a major signal suggesting the start of a new bullish cycle. Price is now retesting the previously broken trendline, hinting at the possibility of a fresh upward leg to resume the longer-term bullish trend we've seen recently.
Personally, I'm targeting $3,600 in the medium term, and potentially $4,000 by 2026–2028 if institutional capital continues to rotate back into safe-haven assets like gold.
What about you — do you think BTC/USD will rise or fall in the coming years?
And what’s your target for it?

XAU / USD Weekly ChartHello traders. News was good for the US dollar this morning. Powell did nothing, as expected, and gold is testing the lower boundries of the weekly candle body from last week. So now the question is, do we push down more, or does gold move up to take out all the leveraged shorts that are in profit? I marked the area to watch. Buys and sells with break and close out of the zone. Let's see how the daily and 4 hour candles play out. Shout out to Big G. Be well and trade the trend.

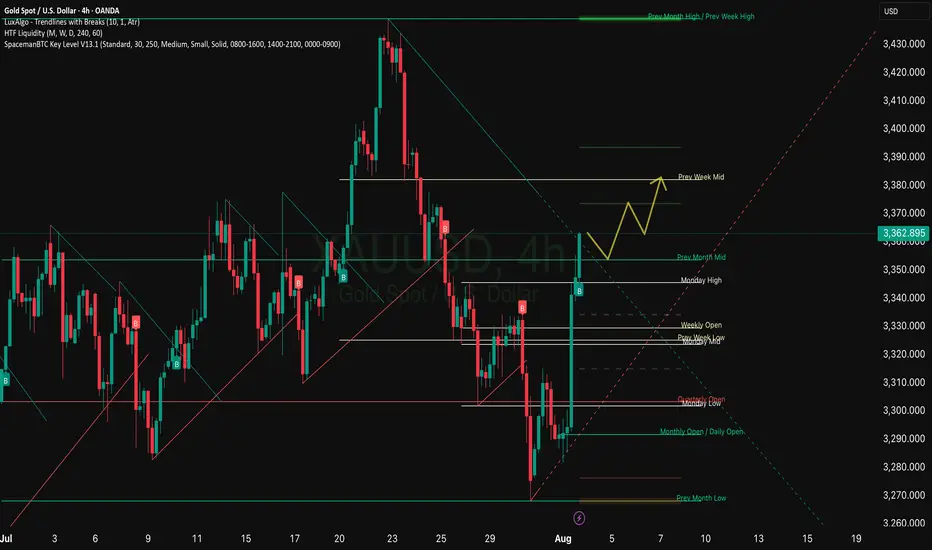
XAU/USD - Potential Targets this WeekDear Friends in Trading,
How I see it,
Let me know if anything is unclear, inputs and questions always welcome.
I don't always have the right answers, but I do share my opinion freely.
I sincerely hope my point of view offers a valued insight
Thank you for taking the time study my analysis.

Gold OutlookI think Gold is about to do a minor recovery Pump , after days of Red, maybe we are about to see some relief green, this is my very first long trade

XAUUSD Does it need to test the 1D MA100 first?Gold (XAUUSD) is attempting to break below its Triangle formation just 4 days after marginally breaking above it. This has invalidated that pattern so after breaking also below its 1D MA50 (blue trend-line), it could technically go for a 1D MA100 (green trend-line) test for the first time since January 06 2025.
If it does, there will be more probabilities for a stronger than before rebound to make a new High. Our Targe is the 2.0 Fibonacci extension at $3620.
Keep also an eye on the 1D RSI Buy Zone, which has been giving the most optimal buy signals since April 07 2025.
-------------------------------------------------------------------------------
** Please LIKE 👍, FOLLOW ✅, SHARE 🙌 and COMMENT ✍ if you enjoy this idea! Also share your ideas and charts in the comments section below! This is best way to keep it relevant, support us, keep the content here free and allow the idea to reach as many people as possible. **
-------------------------------------------------------------------------------
Disclosure: I am part of Trade Nation's Influencer program and receive a monthly fee for using their TradingView charts in my analysis.
💸💸💸💸💸💸
👇 👇 👇 👇 👇 👇

XAU / USD 4 Hour ChartHello traders. Here is a lower time frame analysis pertaining to the weekly that I recently posted. Area to watch is marked. It is the end of the month, things get tricky. Trade carefully. Be well and trade the trend. Shout out to Big G. Happy Wednesday.

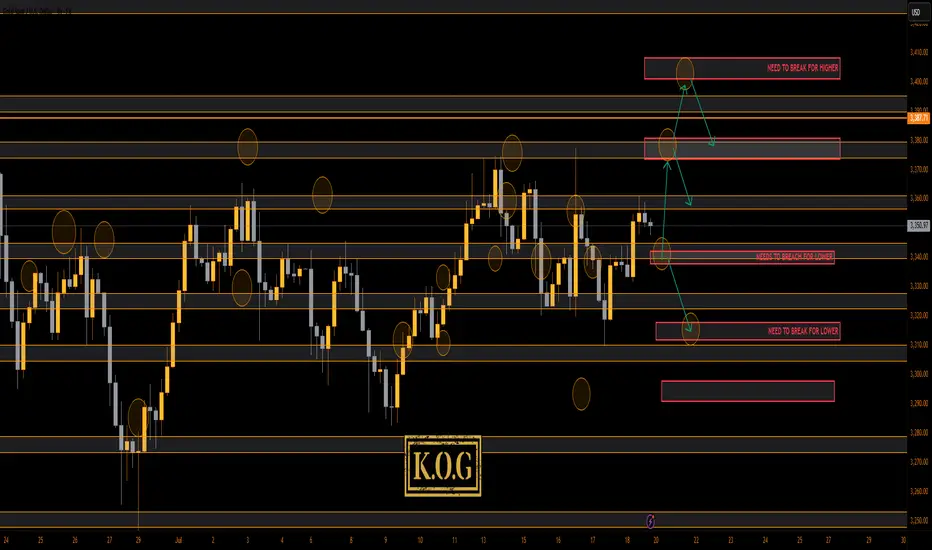
THE KOG REPORT THE KOG REPORT:
In last week’s KOG Report we said we would be looking for a price to attempt the higher level red box sitting around the 3370-75 region and if not breached, we felt an opportunity to short would be available from that region. We said if that failed and the move commenced, we would be looking at a complete correction of the move back down into the 3330-35 region, where we would then monitor price again in anticipation of a long from there or the extension level of 3310 which was also a red box short target (move complete). As you can see from the above, not only did we get that higher red box, we rejected, completed the move downside and then our traders managed to get that long trade all the way back up into the Excalibur target, red box targets and the hotspots shared in Camelot.
A decent week again, not only on Gold but also the numerous other pairs we trade, share targets on and analyse.
So, what can we expect in the week ahead?
For this week we can expect more ranging price action, but due to the previous range from last week being so tight, it looks like we’ll see a breakout coming in the latter part of the week unless there is news to bring us unexpected volume.
We have the key level below 3335-40 support and above that resistance and a red box sitting at 3375-80. This is the region that needs to watched for the break, and if broken we should hit the range high again at 3400-10. However, if rejected, we could again see this dip to attack that lower order region 3310-6 before attempting to recover.
Last week we wanted to see that curveball and although we did see some aggressive price action, I think we will see something extreme for this week. It’s that lower level 3310-6 that is a key region for bulls, if broken we can see a complete flush in gold taking us down into the 3250’s before we start the summer run. That for us would be the ideal scenario going into the month end, but, we’ll play it how we see and as usual, we go level to level and update any changes as we go along.
KOG’s Bias for the week:
Bullish above 3340 with targets above 3355, 3361, 3368, 3372 and above that 3385
Bearish below 3340 with targets below 3335, 3330, 3322, 3316, 3310 and below that 3304
RED BOX TARGETS:
Break above 3350 for 3355, 3361, 3367, 3375 and 3390 in extension of the move
Break below 3340 for 3335, 3330, 3320, 3310 and 3306 in extension of the move
Please do support us by hitting the like button, leaving a comment, and giving us a follow. We’ve been doing this for a long time now providing traders with in-depth free analysis on Gold, so your likes and comments are very much appreciated.
As always, trade safe.
KOG
XAUUSD to the moon Current situation: price around $3360, short-term targets — rebound to $3415–3420 or fall to $3330–3300.
Trend: moderately bullish, but consolidation is possible in the quarter. Sustainable growth is possible with lower rates and increased geo-risks.
Tactics: consider buy on dip positions around $3330–3350 with a target of $3400+, or sell on rise in the $3415+ zone with signs of indicator reversal or dollar growth.
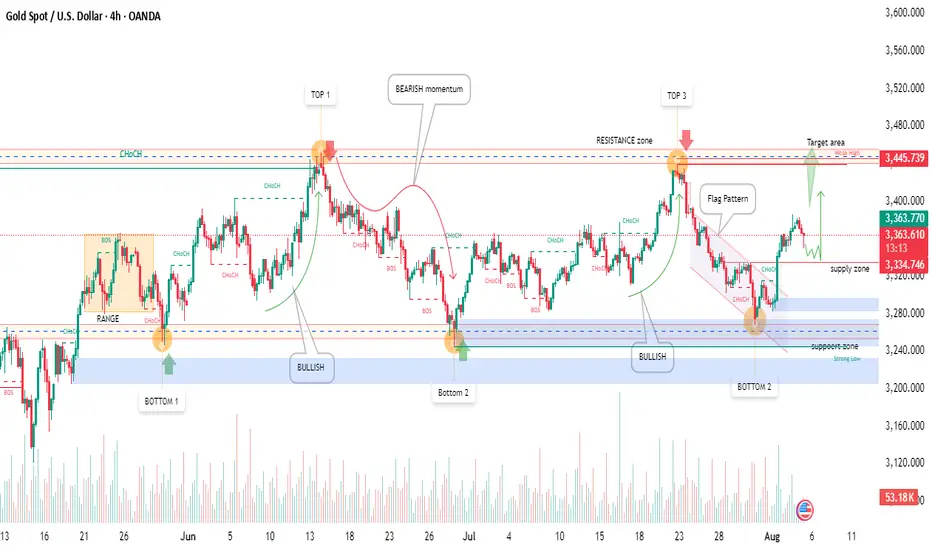
Gold(XAU/USD) 4H 5Aug2025 Price Analysis-Bullish Setup in Play!🧠 Technical Overview:
Gold has shown a solid bullish structure after rebounding from a strong support zone marked around the $3,250 area. We witnessed a textbook flag pattern breakout followed by a Change of Character (ChoCH) confirming bullish momentum.
🔹 Support Zones:
Strong demand near $3,250 – $3,280
Bullish reaction visible from Bottom 2
🔹 Resistance Zones:
Key supply zone at $3,334 – $3,356
Target area near the weekly high at $3,445
🏹 Trade Idea:
A bullish continuation is expected from the current zone after price retested the flag breakout.
🔸 Entry Zone: $3,334 – $3,356 (supply flip)
🔸 Target: $3,445 (Weekly High)
🔸 Stop Loss: Below $3,280 (support zone)
📊 Market Sentiment:
✅ Bullish momentum confirmed by multiple ChoCHs
✅ Strong buying volume at support
❗ Watch for price action confirmation at current supply zone
🏁 Summary:
Gold is currently respecting bullish structure with a clear path toward the $3,445 target. Traders can look for long opportunities after confirmation within the supply zone.
💬 What’s your outlook on Gold? Bullish or Bearish? Comment below!
How to seize the best entry point for gold?Gold continued its bullish trend from last Friday, rising to a high of 3385 yesterday. However, the upward momentum failed to sustain, and new highs were not reached during today's Asian and European trading sessions. The short-term bullish trend has ended, and the market is showing signs of correction. Currently, gold is facing downward pressure in the short term, and the short-term trend is volatile. Strategically, we can watch for a rebound to the 3375-3385 area during the European trading session and try to participate in short-term short selling. The target is below 3365-3355. The long-term structure remains bullish. Therefore, if the price falls back to the 3355-3340 area and stabilizes, we can still consider entering long positions to continue the medium-term uptrend. In terms of trading, we should pay attention to the rhythm of the market, betting on rebound resistance with short-term short positions and then going long on dips, maintaining flexibility.

GOLD ROUTE MAP UPDATEHey Everyone,
Another PIPTASTIC day on the charts with our analysis once again hitting gold!!!
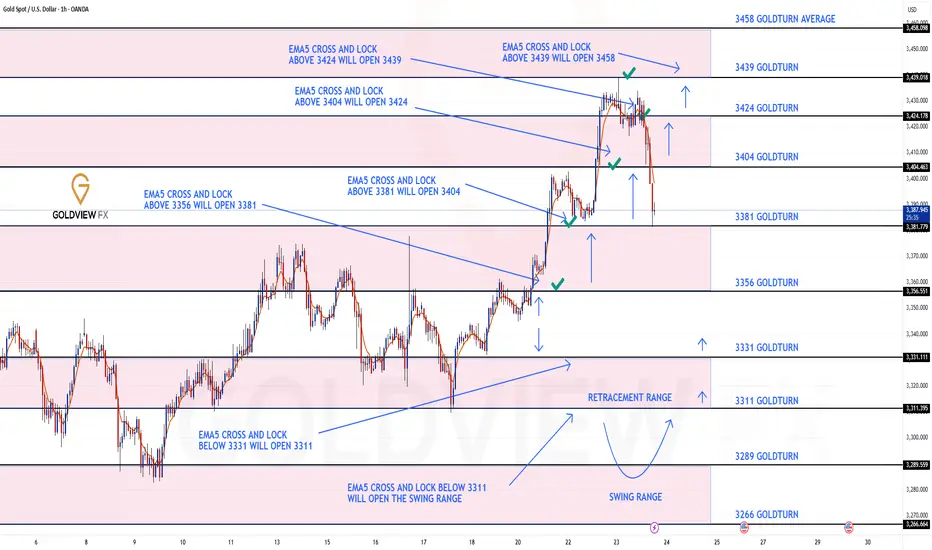
After completing all our bullish targets yesterday we stated that we will now look for EMA5 lock above 3424 to open the next bullish level at 3439.
- This played out perfectly completing 3439 to perfection!!
We are now seeing no further lock above 3439 confirming the rejection, which we are seeing now. We will now look for lower Goldturns to be tested for support and bounce inline with our plans to buy dips.
We will keep the above in mind when taking buys from dips. Our updated levels and weighted levels will allow us to track the movement down and then catch bounces up.
We will continue to buy dips using our support levels, taking 20 to 40 pips. As stated before, each of our level structures gives 20 to 40 pip bounces, which is enough for a nice entry and exit. If you backtest the levels we’ve shared every week for the past 24 months, you’ll see how effectively they were used to trade with or against short/mid-term swings and trends.
The swing ranges give bigger bounces than our weighted levels, that’s the difference between the two.
BULLISH TARGET
3356 - DONE
EMA5 CROSS AND LOCK ABOVE 3356 WILL OPEN THE FOLLOWING BULLISH TARGETS
3381 - DONE
EMA5 CROSS AND LOCK ABOVE 3381 WILL OPEN THE FOLLOWING BULLISH TARGET
3404 - DONE
EMA5 CROSS AND LOCK ABOVE 3404 WILL OPEN THE FOLLOWING BULLISH TARGET
3424 - DONE
EMA5 CROSS AND LOCK ABOVE 3424 WILL OPEN THE FOLLOWING BULLISH TARGET
3439 - DONE
EMA5 CROSS AND LOCK ABOVE 3439 WILL OPEN THE FOLLOWING BULLISH TARGET
3458
BEARISH TARGETS
3331
EMA5 CROSS AND LOCK BELOW 3331 WILL OPEN THE FOLLOWING BEARISH TARGET
3311
EMA5 CROSS AND LOCK BELOW 3311 WILL OPEN THE SWING RANGE
3289
3266
As always, we will keep you all updated with regular updates throughout the week and how we manage the active ideas and setups. Thank you all for your likes, comments and follows, we really appreciate it!
Mr Gold
GoldViewFX
xauusdPrevious analysis failed
If the last bottom is not broken, we will most likely
According to the analysis, we will have gold price movement
