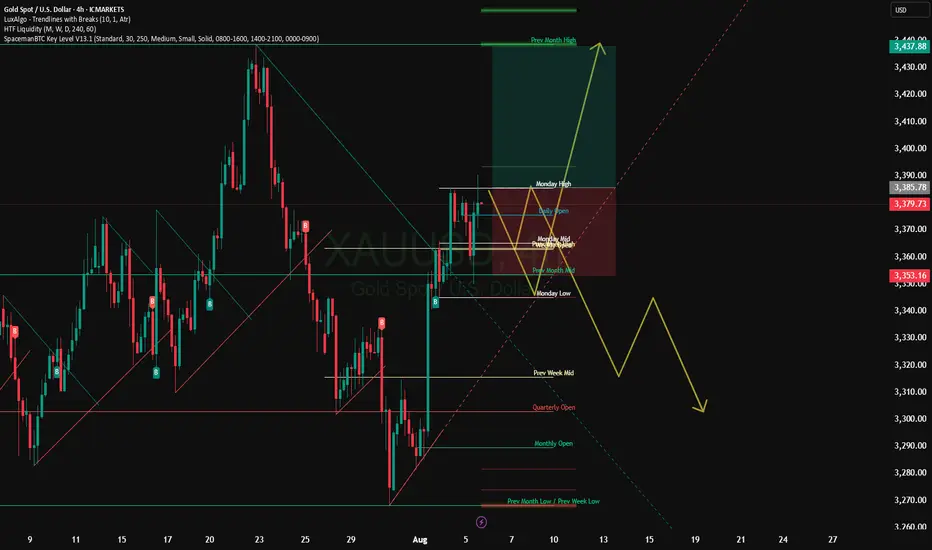
GOLD - WAVE 5 BULLISH TO $3,734 (UPDATE)As I said on our last update, this 'Gold Bullish Scenario' remains valid as price has still failed to close below $3,245 (Wave 2) low.
As long as Gold remains above Wave 2 high ($3,245), this Gold bullish bias remains an option. As traders we always have to be prepared to adapt to different market conditions.
GOLD trade ideas

BULLISH REVERSALAfter struggling between the 2 key levels, XAUUSD showed a change of character indicating a reversal. Target is 500 pips.

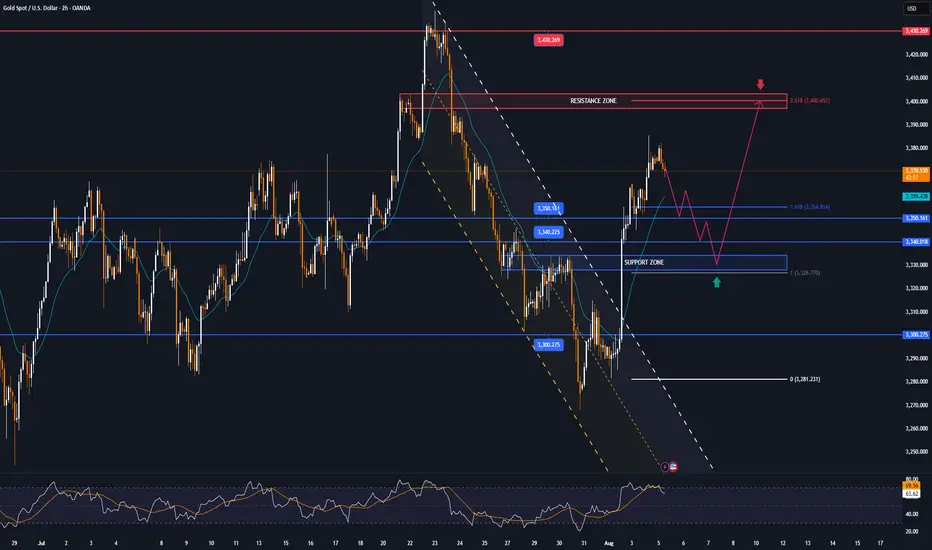
Roadmap to 3982: Key Long Entries and Profit ZonesThe initial long entry zone is between 3290 and 3275 .
From this range, an uptrend is expected to begin, targeting 3416 , which is our first exit point to close the initial long position.
After that, we wait for the next long entry , ideally around 3333 to 3319 . A new upward movement from this range is expected to reach 3455 . At this level, we continue to hold the position while placing the stop loss at the entry level to protect profits.
The next take profit target is 3650 , which may be reached by the end of 2025 or in 2026.
The final target is 3982 , which is likely to be hit in 2026, as the market may not have enough strength to reach it in 2025.

GOLD down slightly, watch today's data, technical conditionsOANDA:XAUUSD edged lower in Asian trading on Tuesday (August 5), currently trading around $3,380/ounce. On Tuesday, the US ISM services PMI will be released, which is the most important economic data of the week and is expected to impact the gold market.
OANDA:XAUUSD prices surged after weak jobs data increased the possibility of the Federal Reserve cutting interest rates.
Data released last Friday showed that the number of new jobs in the US non-farm sector in July was much lower than expected, and the total number of non-farm jobs in the first two months was revised down by 258,000, indicating a sharp deterioration in the labor market.
Traders now see an 87% chance of a rate cut in September, up from 63% last week, according to CME Group's FedWatch tool. Expectations of a rate cut have boosted gold prices, as the dollar provides support for the precious metal.
The US ISM non-manufacturing purchasing managers index (PMI) for July will be released today (Tuesday) and is expected to be 51.5, up from 50.8 previously.
The July ISM services PMI could impact the US dollar and gold, depending on whether it is biased towards supporting a rate cut or pausing rate cuts for an extended period.
Gold itself does not generate interest, but generally performs well in low-interest-rate environments and is seen as an inflation hedge.
On the trade front
Today (August 5), US President Donald Trump threatened to raise tariffs on Indian goods in protest at India's purchase of Russian oil. New Delhi called Trump's attack "absurd" and pledged to protect its economic interests, deepening the trade rift between the two countries.
Trump posted on the social media platform Truth Social: "India not only buys massive amounts of Russian oil, but also sells much of it on the open market at a huge profit. They don't care how many people are being killed in Ukraine by the Russian war machine."
Trump added: "Accordingly, I will be substantially increasing the tariffs that India pays to the United States."
However, Trump did not specify the specific tariff amount.
Responding to Trump's remarks, an Indian foreign ministry spokesperson said on Monday that India would "take all necessary measures to protect its national interests and economic security." The spokesperson added: "These actions against India are unjustified and unjustifiable."
Over the weekend, Reuters reported that India would continue to buy oil from Russia despite Trump’s threats.
In July, Trump announced that he would impose a 25% tariff on imports from India, and US officials have also pointed to a range of geopolitical issues as holding up the signing of a US-India trade deal.
Trump has also described the BRICS group as generally hostile to the US. Those countries have rejected Trump’s accusations, saying the group protects the interests of its members and the developing world as a whole.
Technical Outlook Analysis OANDA:XAUUSD
On the daily chart, although gold has been very volatile in recent times, it is still moving sideways, with price action clinging to the EMA21. And after a strong recovery in the past three trading sessions, gold is temporarily limited by the 0.236% Fibonacci retracement level, which was the bullish target that readers paid attention to earlier. The return above the EMA21 provides gold with initial conditions for bullish expectations, but a new trend has not yet formed.
If gold takes its price action above the 0.236% Fibonacci retracement level and stabilizes above it, it will have room to continue rising with the next target being the raw price point of $3,400 rather than the $3,430-$3,450 target. But at its current position, it still has no clear trend either up or down.
Meanwhile, once gold sells below the 0.382% Fibonacci retracement level, it could continue to decline with a target of $3,246 in the short term, which also means that the $3,300 – $3,292 area is the current key support area.
Momentum-wise, the Relative Strength Index (RSI) is also hovering around 50 with little fluctuation, indicating a hesitant sentiment in the market without leaning to either side.
For the day, the technical outlook for gold is a sideways consolidation but the technical conditions are slightly more bullish, and the notable positions are listed as follows.
Support: $3,350 – $3,340 – $3,300
Resistance: $3,400 – $3,430
SELL XAUUSD PRICE 3402 - 3400⚡️
↠↠ Stop Loss 3406
→Take Profit 1 3394
↨
→Take Profit 2 3388
BUY XAUUSD PRICE 3329 - 3331⚡️
↠↠ Stop Loss 3325
→Take Profit 1 3337
↨
→Take Profit 2 3343
Gold weekly chart with buy and sell entries plus swing trade ide1. Overall Chart Analysis
Timeframe and Trend: This 4-hour chart highlights a short-term downtrend with signs of exhaustion and consolidation. Gold peaked sharply on the left (possibly a local high around 2,400+), followed by a steep decline with lower highs and lower lows, forming what looks like a descending channel (diagonal trendlines connecting peaks and troughs). Recent candles show sideways ranging with smaller bodies and wicks, indicating indecision or a potential reversal setup. This could be a bear flag pattern or a base for accumulation.
Key Patterns:
Bearish Decline: Strong red candles early on suggest impulsive selling, possibly driven by external factors like USD strength or rising yields. However, the downtrend is losing steam, with recent bounces off lower levels.
Range-Bound Action: Price is trapped in a horizontal range (bounded by your marked lines), with dojis and spinning tops signaling buyer-seller balance. A breakout could lead to a volatile move.
Support and Resistance: Your green lines (lower) align with support zones where price has reversed upward multiple times. Red lines (upper) act as resistance caps, rejecting rallies.
Indicators (Inferred):
Moving Averages: Price is likely below key MAs (e.g., 50-period or 200-period EMA), confirming bearish bias. A golden cross (shorter MA crossing above longer) near green lines could validate buys.
RSI (Relative Strength Index): Potentially oversold (below 30) at green line tests, supporting buy entries. Neutral or overbought (above 70) near red lines would favor sells.
Volume and Momentum: Volume bars on the right show spikes on down moves but fading recently, hinting at bearish exhaustion. MACD might show narrowing histograms, indicating weakening momentum.
Volatility: If Bollinger Bands are applied, they're likely contracting, suggesting an imminent expansion (breakout).
Market Bias: Bearish in the short term due to the downtrend, but with bullish potential if support holds (gold's macro uptrend from inflation/geopolitical hedging). Watch for catalysts like US economic data or Fed announcements. The setup favors range trading (buy low, sell high) until a clear breakout.
Risk Considerations: Gold can move 50-100 pips per 4H candle; use tight stop-losses (SL) 1-2% away from entries. Risk no more than 1% of your account per trade. Multi-timeframe confirmation (e.g., daily chart) is recommended.
2. Analysis of Marked Levels and Entry Rationale
Your lines are horizontal, with green lines clustered at lower price levels (buy zones, e.g., around 2,300–2,320) and red lines at higher levels (sell zones, e.g., around 2,340–2,360). These appear to be based on prior price action (swing points). I'll group them by color and explain the technicals, drawing from support/resistance, patterns, Fibonacci, and momentum.
Green Lines: Potential Buy Entries (Bullish Setups)
These lower lines seem to mark strong support areas where price has bounced repeatedly, often with bullish candle formations. They could represent the floor of the descending channel or a demand zone.
Technicals Supporting Buys:
Support Zones: Green lines align with historical swing lows (e.g., visible double or triple bottoms in the chart's dips), where buyers have defended price. This creates a "value area" for accumulation, especially in gold's broader bullish context.
Candlestick Patterns: Bullish signals like hammers, bullish engulfing, or long lower wicks appear at these levels—indicating rejection of lower prices and potential reversal. For example, a green candle closing above the line after a touch would confirm entry.
Fibonacci Retracement: Drawing from the chart's high (left peak) to low, green lines likely hit key levels like 61.8% or 78.6% retracements—common for buying deep pullbacks in trending markets.
Momentum and Divergence: RSI bullish divergence (price lower lows, RSI higher lows) or an oversold reading supports upside. The downtrend's slowing pace (smaller red candles) suggests fading sellers.
Trend Context: These are counter-trend buys in a downtrend—ideal for scalps or reversals. Wait for confirmation, like a 4H close above the green line or increased volume.
Entry Strategy: Enter long on a retest of the green line with bullish confirmation (e.g., RSI >30 crossover). Place SL 20-30 pips below the line to account for wicks.
Suggested Take-Profit Levels:
TP1 (Conservative): Nearest minor resistance or 38.2% Fibonacci level—e.g., if entry at ~2,310, TP at 2,330 (1:1 risk-reward, ~20 pips profit for quick partial exit).
TP2 (Aggressive): Mid-range or next red line—e.g., 2,340–2,350 (1:2 ratio, scale out 50% of position).
Stretch TP3: If bullish breakout above the channel, target prior highs (e.g., 2,370–2,400). Trail stops using a 20-period MA or ATR-based levels for dynamic exits.
Red Lines: Potential Sell Entries (Bearish Setups)
These upper lines appear to cap price action, with rejections forming bearish patterns. They could be the ceiling of the channel or supply zones.
Technicals Supporting Sells:
Resistance Zones: Red lines correspond to prior swing highs (e.g., failed rallies in the mid-chart), round psychological numbers, or the upper channel boundary. Multiple touches with downside reversals confirm seller control.
Candlestick Patterns: Bearish indicators like shooting stars, bearish engulfing, or long upper wicks at red lines signal rally failures—sellers stepping in aggressively.
Fibonacci Extension/Retracement: From the downtrend's wave, red lines might align with 38.2% or 50% retracements—prime spots for selling into strength within a bearish structure.
Momentum Indicators: RSI overbought (above 70) or bearish divergence (price higher highs, RSI lower highs) at these levels reinforces downside. MACD line cross below signal line could trigger entries.
Trend Context: Aligns perfectly with the downtrend's "sell the rallies" mantra. The overall lower highs pattern suggests continuation unless broken.
Entry Strategy: Enter short on a rejection from the red line (e.g., red candle close below it with volume). Place SL 20-30 pips above the line.
Suggested Take-Profit Levels:
TP1 (Conservative): Nearest minor support or green line below—e.g., if entry at ~2,350, TP at 2,330 (1:1 ratio, ~20 pips for scalping).
TP2 (Aggressive): Lower range or channel support—e.g., 2,310–2,300 (1:2 ratio, partial close).
Stretch TP3: If bearish breakdown below green lines, target extended supports (e.g., 2,280–2,250 via 161.8% Fibonacci extension). Trail stops with a parabolic SAR or based on recent swing lows.
3. Additional Suggestions and Scenarios
Breakout Scenarios:
Bullish Breakout: A strong close above the highest red line (e.g., on high volume or positive news) invalidates sells—switch to longs targeting 2,400+ (macro resistance).
Bearish Breakdown: Close below the lowest green line accelerates downside to 2,250–2,280 (next major support, possibly a monthly low).
Risk-Reward and Position Management:
Prioritize 1:2+ RR (e.g., risk 20 pips to gain 40+). Use partial profits: Exit 50% at TP1, trail the rest.
Combine with oscillators: Avoid buys if RSI <20 (extreme oversold) or sells if >80 (overbought).
Time of Day: Gold volatility peaks in NY/London sessions; avoid thin markets.
Potential Biases or Warnings:
Gold's inverse correlation to USD (check DXY) or bonds could override technicals—e.g., a weak USD might break red lines upward.
The range is tightening; a false breakout is possible. If consolidation persists, consider straddle strategies.
This is a technical view only; fundamental shifts (e.g., Middle East tensions boosting gold) could alter dynamics.

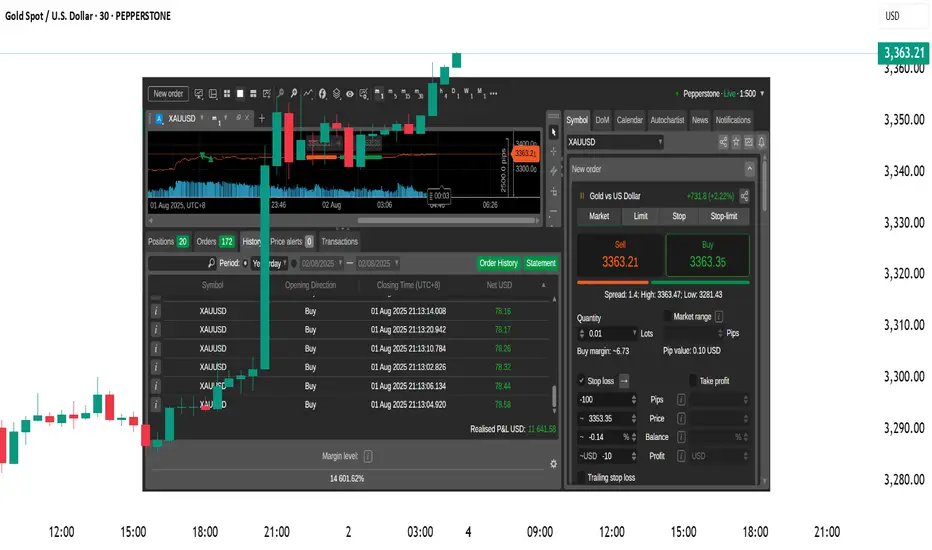
XAUUSD Live Trade with 11,641 USD ProfitsI managed to ride the momentum last night on XAUUSD and made over 11,641 usd profit on a live trading account. Gold usually create a range. It will create a top and a bottom then it will spend most of its time inside that range. That is pretty much how XAUUSD moves. If you can identify the top and the bottom then you can short it from the top and do a long trade on the bottom. The price will just travel from bottom to top and top to bottom. You can scalp your way to profits on this move if you can time it properly. Once in a while, a break from the top or the bottom happens. This is where you switch from trading the range to trading breakouts.
When you trade breakouts, you must trade it with the knowledge that less than 15 percent of breakouts are successful. Failed breakouts are very common. You need to have some form of stoploss below your breakout levels. You will know that the breakout fails once your stoploss is hit. If the breakout is successful then ride it. Do not put some TP (target price or take profit price) rather just trail your profits. Move your stops a few pips behind the price. Just enough distance to let the price breathe. If the price reverses then it will hit your stops. If the breakout is strong then you will ride it for a while until it reverses.
It will form another top and bottom again and move inside that range. Switch your approach again in trading long trades near the bottom and short trades near the top.
Just remember to always have some stoploss on every trade and never try to predict what the market will do or how the price will move. Let the market do its thing and just react to its movements.
Goodluck on your trades.
Gold Approaches Key Reversal Zone After Liquidity Sweep.Gold has recently broken out of a parallel channel during the New York session, followed by a strong upward move triggered by the NFP (Non-Farm Payroll) news event. Currently, the market is trading near a key trendline resistance zone. In this area, the price has also swept the liquidity residing above recent highs, indicating that potential buy-side liquidity has been taken out.
This level now becomes critical for observation. If the market forms a Market Structure Shift (MSS) or provides any valid bearish confirmation — such as a strong rejection candle, bearish engulfing, or a break of lower timeframe support — then there is a high probability that a downward move may follow from this zone.
As always, conduct your own research (DYOR) and wait for price action to confirm the bias before executing any trades. Acting on confirmation rather than assumptions protects both capital and strategy.

XAUUSD – Strong Bullish Reversal from Key Support XAUUSD – Strong Bullish Reversal from Key Support
Chart Summary:
Gold (XAUUSD) has shown a clear reaction from a strong support zone near 3260, suggesting bullish momentum is gaining strength. The chart highlights multiple key market structure elements and confirms the potential for a bullish move.
Technical Highlights:
🔻 Strong Support Zone (3260–3280):
Price tapped into a well-defined demand zone with historical significance, initiating a bullish response.
🔺 Resistance Zone (3460+):
A strong resistance level lies ahead. This area may act as a potential target for bulls.
🔁 Break of Structure (BOS):
Multiple BOS marks on the chart indicate trend shifts and liquidity grabs. Most recent BOS aligns with potential reversal.
💹 Bullish Fair Value Gap (FVG):
A bullish FVG near mid-structure confirms institutional interest and adds confluence to the upside move.
📈 Target: 3,366.984 USD
Marked as the next probable short-term liquidity target. If momentum sustains, price may approach resistance above this.
Price Expectation:
If the current bullish momentum holds above the strong support zone, we may see a rally towards 3,366–3,400 USD.
This move could be driven by:
Buy-side liquidity grab above prior highs
Breakout traders entering above BOS
Reaction to macroeconomic calendar (highlighted on the chart)
✅ Educational Takeaway:
This is a textbook example of:
Support-resistance flip
Liquidity concepts (Buy-Side Liquidity)
Fair Value Gaps usage
Volume Profile confluence


gold 4hour say: put sellstop in lowpersonaly i predict mini crash on gold and waiting for it , now we have powerfull 3angel pattern we must put sellstop in last low , buystop on last high
sellstop stoploss = last high
if sellstop open like new traders , dont close it soon , wait minimum 2 week ,understand?
ALERT= if gold can break last high , it can start new up trend, wave , so if you have old sells ,you must put SL or hedge buystop in last low
if sell
wishhhhhhhhhhhhhh youuuuuuuuuuuuuuuu win

XAU / USD Daily ChartHello traders. We are at an area of interest for me which is marked on the chart. We can push down to fill that wick, or reject and move back up a bit to take out any existing short positions in profit. I will post a lower time frame chart shortly. We will see Pre NY volume starting in a little under 2 hours. 7:20 am est here in the US is when we someimes see a shift to sometimes partially correct the overnight session's move. Not saying that's what will happen, just explaining what I see happen a lot of the time. Let's see how things play out. Be well and trade the trend. Shout out to Big G.

XAUUSD sclping setupXAUUSD M15 create double doji evning shoting star.
Sell below: 3361.00
Stop Loss: 3364.00
1st TP: 3355
2nd TP: 3351
3rd TP: 3347
4th TP: 3341
If breakout rising trendline and 3340 then gold more downward move 3330, 3318 and 3302.

Gold prices soar to new highs!Market News:
Spot gold prices fluctuated at high levels in early Asian trading on Monday (August 4), currently trading around $3,349 per ounce. Gold prices surged by over 2% last Friday (August 1), reaching a weekly high. This is due to the fact that US July non-farm payroll data fell far short of expectations, increasing the likelihood of a Federal Reserve rate cut. Furthermore, Trump's new round of tariff announcements has fueled safe-haven demand. Global economic uncertainty, a weakening US dollar, and rising expectations of a Fed rate cut have all provided strong momentum for the rise in international gold prices.
Against the backdrop of continued global economic uncertainty, gold's appeal as a safe-haven asset is expected to further increase. Investors should closely monitor market trends to seize potential opportunities. This trading day, attention should be paid to the US June factory orders monthly rate and continued monitoring of news related to the international trade and geopolitical situation.
Technical Analysis:
From a macro perspective, the monthly chart shows four consecutive long upper shadows and three dojis. This high-level doji formation in an uptrend is overwhelming, prompting caution in buying and caution in the market. Be wary of potential sell-offs in the future. We have repeatedly emphasized the importance of the monthly gold chart in recent months!
On a weekly basis, gold bottomed out and rebounded last week, hitting the middle support band and rebounding. Prices remain within the range, currently shrinking to 3268-3438. The Bollinger Bands continue to close, while the MA5 and MA10 levels remain in a volatile pattern. A unilateral trend still needs time to develop. On a daily basis, there was an extreme rally on Friday night, with the daily chart closing with a large real bullish candlestick. The price directly broke through the short-term moving average and the middle support band, forming a strong Yang-enclosing-Yin pattern. This is a positive bullish signal. So, is it a good time to buy on Monday?
I personally don't recommend buying directly from high levels. Gold rebounded from 3268, surging nearly $100 over two trading days without a significant pullback. Even if there was a pullback on Thursday, it was a single-digit pattern, which doesn't provide solid support for a bullish rally. Therefore, I don't recommend chasing long positions. Instead, watch for a potential sell-off after a rally. Focus on resistance at 618 and resistance near 3376, a previous top-bottom reversal.
Looking at gold on both the 4-hour and hourly charts, the Bollinger Bands are showing signs of opening after last Friday's surge. However, it's important to note that such surge-like openings are generally not sustainable, and will close again upon retracing technical indicators. The 4-hour candlestick chart is currently trading above the upper band, no longer favoring a buy-now-up move. The 1-hour moving average is blunting, and the upper band of the Bollinger Band is about to close. Overall, while gold is strong, it's best not to chase the bulls. Focus on selling opportunities on rallies today, and then consider a bullish move after a pullback.
Trading strategy:
Short-term gold: Buy at 3330-3333, stop loss at 3322, target at 3360-3380;
Short-term gold: Sell at 3375-3378, stop loss at 3387, target at 3340-3320;
Key points:
First support level: 3342, second support level: 3330, third support level: 3316
First resistance level: 3376, second resistance level: 3388, third resistance level: 3400

XAUUSD
XAUUSD Updated in H1 :
The gold signal is marked on the chart based on the latest price changes and the supply and demand in the market. These points include the entry point, stop loss, and take profit

Gold continues to go long in the 3280-3300 range.Gold continues to go long in the 3280-3300 range.
Today, we remain firmly bullish on a bottom in the 3280-3300 range.
On August 1st, the Federal Reserve, while keeping interest rates unchanged, acknowledged slowing economic growth, triggering a repricing of expectations for a rate cut.
This led to a rebound in gold prices, but of course, this was just a pretext for the price increase.
Recently, gold prices experienced a four-day decline (July 23-28), falling from $3431 to $3268, as progress in trade negotiations and a rebound in the US dollar dampened safe-haven demand.
Non-farm Payrolls
Here are the key takeaways:
Today's US July non-farm payrolls data (expected to increase by 110,000, compared to 147,000 previously) will determine expectations for a September rate cut by the Federal Reserve.
A weak reading (e.g., below 100,000) could push gold prices back towards $3,400;
A strong reading (above 150,000) would remain bearish for gold. Gold prices continue to decline, and we are long in the 3280-3300 range.
Today, we remain firmly bullish on gold bottoming in the 3280-3300 range.
On August 1st, the Federal Reserve, while keeping interest rates unchanged, acknowledged slowing economic growth, triggering a repricing of rate cut expectations in the market.
This led to a rebound in gold prices, but of course, this was just a pretext for the price increase.
Recently, gold prices experienced a four-day decline (July 23-28), falling from $3431 to $3268, as progress in trade negotiations and a rebound in the US dollar dampened safe-haven demand.
Non-farm Payroll Data
Here are the key takeaways:
Today's US July non-farm payroll data (expected to increase by 110,000, compared to 147,000 previously) will determine expectations for a September rate cut by the Federal Reserve. A weak reading (e.g., below $100,000) could push gold back to $3,400.
A strong reading (above $150,000) would continue to be bearish for gold.
Technical Analysis and Trading Recommendations
Key Levels:
Support:
$3,270 (100-day moving average)
$3,248 (June low);
Resistance:
$3,300 psychological level
$3,340 (21-day/50-day moving average crossover).
Trading Strategy:
Short-term:
1: If the price holds above $3,300, initiate a long position with a target of $3,330-3,350.
2: If the price falls below $3,270, a drop to $3,248 is possible.
3: Focus on the key watershed at $3,300
4: Key Point:
As long as the gold price is above $3,300, I believe it's a good time to buy the dip. Following the upward trend in gold prices is a very wise choice.
As shown in Figure 4h:
The potential for gold prices to rebound is becoming increasingly clear.
The lower edge of the wide fluctuation range is slowly stabilizing.

BuyLondon Session
Daily Volume
Untapped Zone
Market Structure
NT:: Limit order must be tapped before the breach of the red line
XAUUSD The beginning of large-scale growthCurrent picture and structure
The instrument is trading in a narrow range of $3,360-3,375, demonstrating low volatility - ADX is at the low of 2025, which confirms consolidation
The price is held inside a long-term ascending channel, with an increase of about 27% since the beginning of 2024
Indicators and signals
RSI (14): around 58-59, indicates moderate overbought, but remains in the bullish momentum zone
Stochastic (%K ~61%) and MACD (value ~3.8): Buy signals - short-term upward momentum is confirmed
ADX (14): around 23-24 - range, weak trend without a clear direction
Moving averages on different timeframes give a common signal indicator "Strong Buy" in daily and weekly frames
Support and resistance levels
Key support:
$3,360 — current lower stop range
$3,330–3,293 — swing low zone, critical for short-term sales
Main resistance:
$3,400–3,415 — profit acceptance zone and possible reversal pressure
$3,450 — psychological and technical barrier upon breakout of current zone
XAU / USD 30 Minute Chart Quick Scalp SellHello traders. As per my previous post, gold moved through my area of interest and I took a small micro lot position. Sold from the red line, closed 75% of the trade's profit at the next red line. My remaining 25% of the trade is the runner, and I will let that run for a bit. My Stop loss is at my entry point, so zero loss, profit secured and I am thankful to BIg G. Let's see what the NY open does in a few hours. Be well and trade the trend. More analysis to come.

Nonfarm Pay Attention Zone✏️ OANDA:XAUUSD is recovering and increasing towards the resistance zone of yesterday's US session. The 3315 zone is considered a strategic zone for Nonfarm today. A sweep up and then collapse to the liquidity zone of 3250 will be scenario 1 for Nonfarm today. If this important price zone is broken, we will not implement SELL strategies but wait for retests to BUY. It is very possible that when breaking 3315, it will create a DOW wave with the continuation of wave 3 when breaking the peak of wave 1.
📉 Key Levels
SELL trigger: Reject resistance 3315.
Target 3250
BUY Trigger: Break out and retest resistance 3315
Leave your comments on the idea. I am happy to read your views.

XAUUSD Gold Trading Plan – Monday, 4th August 2025 (M30 TF)Strategy Type: Intraday Trend Trading (Buy-the-Dip)
Timeframe: 30-Minute (M30)
Market Bias: Bullish
Execution Style: Step-Ladder Scaling into Strength
🧠 Market Outlook
Gold remains in a bullish trend structure, supported by geopolitical risk, moderate inflation sentiment, and the weakening US Dollar. While Friday showed signs of short-term exhaustion, price is still forming higher lows on the 30-minute chart, suggesting intraday momentum remains to the upside.
Based on current price action and Fibonacci retracement levels, I expect a healthy pullback early Monday before a push towards new short-term highs. I will be trading in phases — buying on dips and scaling out at each resistance zone.
✅ Phase 1: Buy on Dip at 3352 (Key Support Zone)
Entry Zone: 3352
Reasoning:
3352 lines up with M30 demand zone (previous accumulation area)
61.8% Fibonacci retracement of the last M30 bullish swing
Likely to act as intraday support if price retraces from current levels
Confirmation:
Strong bullish candlestick reversal (e.g. bullish engulfing, hammer, or rejection wick) on M30
Volume uptick or bullish divergence on RSI preferred
Stop Loss:
Just below 3346 (below the last valid swing low to protect the trade)
🎯 Target 1: 3361
Why: This is the first intraday resistance and previous minor high on M30
Action:
Secure partial profits (~50%)
Move SL to breakeven or +5 pips to protect capital
Wait for next retracement
✅ Phase 2: Wait for Pullback After 3361
Retracement Zone: Expected dip to 3356–3358 area (new higher low)
Re-Entry Condition:
Retest of breakout level with strong bullish candle on M30
Maintain bullish market structure
🎯 Target 2: 3370
Why: This is the next resistance zone and price magnet based on Friday's volume profile
Action:
Secure additional 30% profit
Trail SL below structure (~3362)
✅ Phase 3: Wait for Final Dip Before Final Push
Retracement Zone: Around 3364–3366 (support flip area)
Re-Entry Condition:
Rejection of this zone with continuation pattern (bullish flag, ascending triangle)
🎯 Target 3: 3379
Why: 3379 is near the top of current intraday channel and strong resistance on 4H/M30
Action:
Close all remaining positions
Assess for potential breakout above 3380 only if momentum is strong
⚠️ Risk Management Plan
Max Risk: 1.5% account risk split across 3 phases (0.5% per entry)
All SLs defined before entry — no averaging down
Trades invalidated if price breaks and closes below 3346 on M30
🔁 Summary Table
Entry Level Target Action
Buy @ 3352 TP1 = 3361 Secure partial profit, trail SL
Re-buy ~3356–3358 TP2 = 3370 Secure partial profit, trail SL
Re-buy ~3364–3366 TP3 = 3379 Close full position
🧭 Other Key Watch Points
DXY: Watching for rejection below 104.60 – bullish for Gold
News Events: Low-impact day; watch for any unscheduled Fed speakers
RSI + Volume: Using RSI (14) and OBV to confirm entry strength on M30

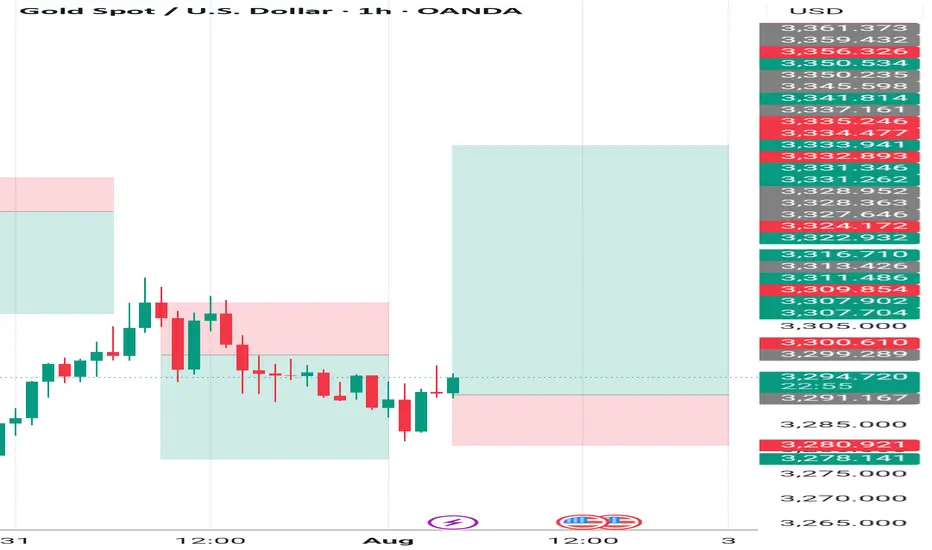
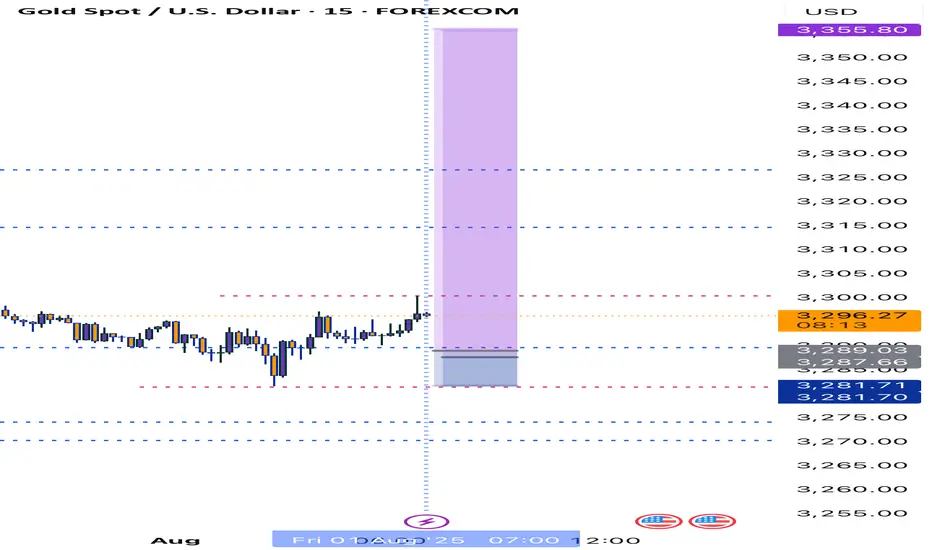
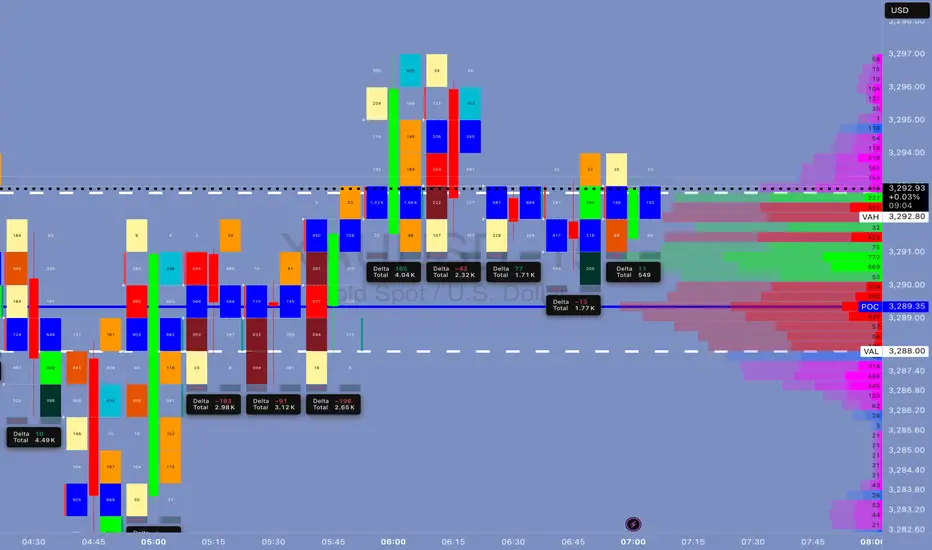
XAUMO XAUUSD (Gold Spot) ANALYSIS | AUG 01, 2025 | CAIRO TIME GMThis is a stealth bullish accumulation day. Market maker completed a fake drop and now prepping breakout. Play long bias from control zone with stop-hunt fade backup. Schabacker would call this a false breakdown spring + congestion base rally.
XAUUSD (Gold Spot) ANALYSIS | AUG 01, 2025 | CAIRO TIME GMT+3
🔍 Multi-Timeframe Technical Breakdown (Daily → 5m)
1️⃣ Price Action & Patterns
Daily: Bullish rejection tail forming (pin bar) off VAL (3,288). Strong buyer defense.
4H: Classic bullish engulfing off VAL support. High rejection wick to downside. Micro-structure shows market maker trap.
1H: V-shape recovery seen. Absorption bar confirmed via footprint delta spike.
15m: Buyers stepping in at POC (3,289.35), stealthy buying—confirmed by divergence between delta & price.
5m: Accumulation in box range between 3,289–3,292. High absorption on bid side, low offer lifting—sign of stealth long build.
2️⃣ Volume & Delta Footprint
POC Cluster across all TFs: 3,289.00–3,291.50 is the control zone.
Volume Node Rejection at 3,288 = confirmed buyer base.
Delta: Absorption → sellers hitting bids but no follow-through = market maker trap → bullish implication.
Volume Spike at 3,288 = fakeout move likely manipulated to hunt stops.
3️⃣ Support/Resistance
VAL: 3,288 🔥 Strong Demand Zone
POC: 3,289.35–3,291.75 🧠 Smart Money Zone
VAH: 3,292.80 🎯 Break above confirms momentum
Res. Extension: 3,296.20, 3,300
Fibonacci Confluence: 3,288 = 61.8% golden retracement from recent rally
5️⃣Volatility
Compression near VAH = Volatility Expansion imminent.
Expect Breakout in next 1–2 hours (likely post 09:00 Cairo Time – Kill Zone)
6️⃣ Market Maker Philosophy
Last 3 days show liquidity vacuum trap below 3,288.
MM has triggered stop hunts to shake weak longs.
Building long inventory stealthily under POC.
Expecting rally trap to suck in breakout buyers → then retrace → final breakout continuation.
🧨 JEWEL TRADE ENTRY (Highest Probability)
📈 Order: Buy Stop
🎯 Entry: 3,293.10
🛑 Stop Loss: 3,287.70
💰 Take Profit: 3,302.40
📊 Confidence: 87%
🧠 Justification: Breakout of VAH/Golden Zone + High Volume Node = Trend Shift Confirmed
This is for EDUCATIONAL PURPOSE ONLY, and not financial advise.
Direct Buy In Gold : Coming Currently gold is trading under falling wedge pattern which will explode soon once volume will come . Buying here is good idea imao
