Gold May Dip Mildly Before US Data📊 Market Overview:
Spot gold is trading around $3,329/oz, up ~0.1%, supported by falling U.S. Treasury yields and a slightly weaker dollar, while investors await potential Fed dovish signals or rate cut in September . Meanwhile, easing U.S.–EU trade tensions weighed on safe-haven demand for gold.
📉 Technical Analysis:
• Key Resistance: ~$3,335–3,350 (recent highs and potential test zone)
• Nearest Support: ~$3,310 (previous stable support)
• EMA09 position: Price is above EMA9, indicating a mild bullish bias in the short term
• Momentum/Volume: RSI ~53 (neutral), MACD & StochRSI showing small buy signals. However, bullish momentum is fading, suggesting a possible mild pullback
📌 Conclusion:
Gold may dip modestly toward $3,310 if the dollar strengthens or if Fed rate-cut expectations recede. A break above $3,335–3,350 could pave the way for further gains, though current momentum remains insufficient to confirm a breakout.
💡 Suggested Trade Strategy:
SELL XAU/USD: $3,333–3,336
🎯 Take Profit: 40/80/200 pips
❌ Stop Loss: $3339
BUY XAU/USD: $3,310–3,308
🎯 Take Profit: 40/80/200 pips
❌ Stop Loss: $3305
GOLD trade ideas

Gold analysis by majidbabaeiasl My predictions for gold in previous years have been quite accurate and calculated. Right now, I think a wave 4 correction, which is a micro-wave, is taking place.

XAUUSD Outlook – July 29, 2025
Gold enters a high-risk environment starting today.
All eyes are on Jerome Powell's speech, which will signal whether the Fed remains firm on its hawkish stance or adopts a more dovish tone.
📈 That said, a broader look at the chart suggests the market has already aligned itself with the dominant trend.
🗓️ In addition to today’s speech, tariff-related news expected on Friday doesn’t seem likely to disrupt the ongoing bullish momentum in gold — or in crypto markets, for that matter.
🧠 That’s the general market read I'm sensing right now, but we’ll have to see how it unfolds.
🎯 Personally, I still view the $3290 level as a solid buy zone, with the potential to become one of gold’s historical bottoms.

The Illusion of ControlThere comes a point in every trader’s journey when you do everything right, and it still goes wrong.
You plan the trade meticulously, plot the levels, define your risk, wait patiently for the setup, and enter with the kind of discipline that would make any textbook proud. You follow your rules. You trust your process. And yet, the market does what it does!
It breaks through your stop as if your risk management was never there. Sometimes it gaps hard against you, leaving no room to act. Sometimes it simply meanders sideways, wearing down your conviction until, exhausted and uncertain, you exit - only to watch the market finally rally the moment you’re out.
This experience is frustrating and discouraging. Yet, for those with enough experience, it's a familiar scenario.
It's not just about losing money, though that definitely stings. This kind of hit really messes with your confidence, throws off your game, and makes you feel disconnected from your work. Before you know it, those sneaky little doubts creep in: Did I miss something? Could I have stopped this? Am I just not good enough at this yet?
So you go back to the charts, really digging into every detail. You watch replays, try out new filters, and pile on more indicators, scrutinizing the trade from every possible angle. You tell yourself this super careful process makes you better, a crucial part of being a professional. But if you're real with yourself, it's more than just getting better. Underneath all this striving for improvement is often a deeper reason: you really want to be in control.
We often discuss risk management, patience, and emotional discipline, yet we seldom acknowledge our deep-seated desire to control the market. We invest countless hours in learning, testing, and refining, expecting our efforts to yield tangible results. When the market doesn't respond as we anticipate, it's disheartening. This is because, at our core, we not only aspire to be skilled traders but also crave the belief that we are truly in command.
The market just does its thing, plain and simple. It doesn't care how much work you put in or how carefully you prepare. It's not about rewarding effort; it just moves. Trying to find a reason for every little change is pointless, like trying to argue with the ocean. You can't outsmart randomness; you can only learn to coexist with it.
The best traders do prepare with care. They’re thoughtful, meticulous, and dedicated. But many cross a subtle line, often unknowingly - the line where preparation morphs into obsession, where working harder becomes an emotional shield, and where we start to believe that if we can just control every input, we can guarantee the output.
This is where it all becomes dangerous. Not financially, necessarily, but psychologically. When your self-worth becomes intertwined with your performance, every loss starts to feel personal. Every drawdown feels like an indictment. You tell yourself you’re striving for excellence, but what you’re really chasing is certainty; and in a domain governed by uncertainty, that’s a recipe for chronic frustration.
The truth is, trading isn't about being right all the time, or even most of the time. The real skill is staying cool when you mess up and not freaking out when things go sideways. You don't have to be perfect; you just need to handle the unknown without needing to control it. You won't pick up this tough lesson from courses, forums, or even tons of practice, unless you're truly reflecting on what you're doing. You learn it by watching winning trades go bad, by handling losses without freaking out, and by being able to stay cool when things get uncomfortable.
You know that annoying feeling we sometimes get? It's usually just fear, popping up as worries about messing things up, looking foolish, or not being quite good enough. When you're trading, these fears can seriously mess with your mind. You might jump into trades too quickly, fiddle with your stop-loss, settle for smaller gains, or just abandon your whole strategy when things get tough. We might try to convince ourselves we're being clever, but typically, we're just trying to escape feeling uncomfortable.
Trying too hard to control the market often hurts your edge. Trading systems usually don't fail because of math errors; they fail because traders don't have the patience to stick with them through tough times and let them do their job.
Every trader eventually faces a fundamental, liberating truth: you are not in control. Once you accept this, you can stop trying to control the uncontrollable and instead concentrate on what you can manage: your risk, routine, discipline, and behavior.
Detaching from the outcome isn't about indifference or a lack of concern; it's about embracing trust. Trust in your preparation. Trust in your edge. Trust in the law of large numbers — that over time, if you execute consistently, the results will follow. Not perfectly, not smoothly, but faithfully.
You build trust over time, often without even realizing it. It's about sticking to your plan even when things aren't going your way, taking losses in stride, and not messing with something that's working, just because it hasn't paid off yet.
Over time, your trading approach transforms. You no longer dwell on every loss or micromanage winning trades. The urge to constantly adjust your system after a bad week/month subsides. Your perspective broadens; you begin to think in terms of years, not just days. This shift cultivates a deeper, process-driven confidence, untethered from mere numbers. You stop striving for absolute control, and in doing so, discover a sense of peace.
True mastery isn't about dominating the market, but rather relinquishing the illusion that you ever could.
GOLD BEARS WILL DOMINATE THE MARKET|SHORT
GOLD SIGNAL
Trade Direction: short
Entry Level: 3,366.62
Target Level: 3,261.15
Stop Loss: 3,436.93
RISK PROFILE
Risk level: medium
Suggested risk: 1%
Timeframe: 1D
Disclosure: I am part of Trade Nation's Influencer program and receive a monthly fee for using their TradingView charts in my analysis.
✅LIKE AND COMMENT MY IDEAS✅

Gold soaring with NFP debacle as an catalystQuick update: Gold is Trading on NFP fuelled relief rally and Bearish Technicals are invalidated once again (I announced lately that this might happen if NFP delivers downside surprise / debacle). The Hourly 4 chart's Ascending Channel increases it's gains towards Overbought levels as #3,352.80 benchmark is showcasing strong durability. Both Weekly chart (#1W) and Monthly (#1M) are on mild gains (# +0.65% and # +0.71% respectively) and with ranging candles (Gold consolidating above the Support for the fractal) I do not see any rebound (to the downside) possibility yet.
My position: As discussed above, I will keep Buying every dip on Gold and will not Sell Gold throughout today's session (if I do, will be aggressive in & out Scalp only). Gold remains very sensitive to every Bullish development while Bearish ones are still on second place.

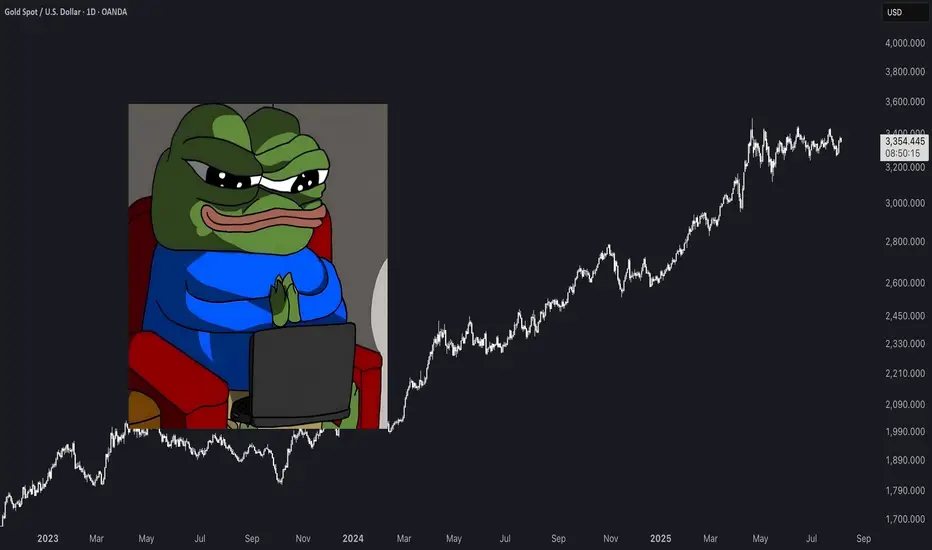
Gold Continues Its Upward Momentum Despite Short-Term Pullback📊 Market Summary
• Spot gold slipped slightly by ~0.1% to around $3,354–$3,361/oz due to profit-taking after last week’s sharp rally following weaker-than-expected U.S. job data
• The U.S. added only 73,000 jobs in July, boosting expectations of a Federal Reserve rate cut in September, with a current market probability of around 81%
• Ongoing geopolitical risks, trade tensions, and robust central bank and ETF gold demand continue to support the long-term bullish outlook
________________________________________
📉 Technical Analysis
• Key resistance: ~$3,360–$3,370/oz (short-term highs, potential profit-taking zone).
• Nearest support: ~$3,330/oz (watch for buying interest on pullbacks).
• EMA09: Price is currently hovering around the short-term EMA (~EMA09), still below EMA50, indicating a mild sideways bias. According to Economies.com, gold hasn’t confirmed a stable uptrend above EMA50 yet
• Candlestick / volume / momentum:
o Today's candle shows mild profit-taking, but momentum remains bullish from the prior session. Volume shows light distribution, not strong selling.
________________________________________
📌 Outlook
• Gold may continue rising slightly in the short term if the upcoming U.S. inflation data (due August 12) remains soft, reinforcing the likelihood of a Fed rate cut
• Conversely, if the U.S. dollar strengthens unexpectedly or new data comes out more robust, gold could retreat back to the $3,330 zone.
________________________________________
💡 Suggested Trading Strategy
SELL XAU/USD : $3,370–$3,373
🎯 TP: 40/80/200 pips
❌ SL: $3,377
BUY XAU/USD : $3,330–$3,333
🎯 TP:40/80/200 pips
❌ SL: $3,327

XAUUSD (SHORT)
Price broker the trendline and had to come back to retest it to confirm breakout. We expecting bears to come in for fither sells.
NB:DXY correlating with GOLD direction as extra confirmation,

Short position is expected As price reacted to demand area, we expect that the price will continue to move in uptrend.
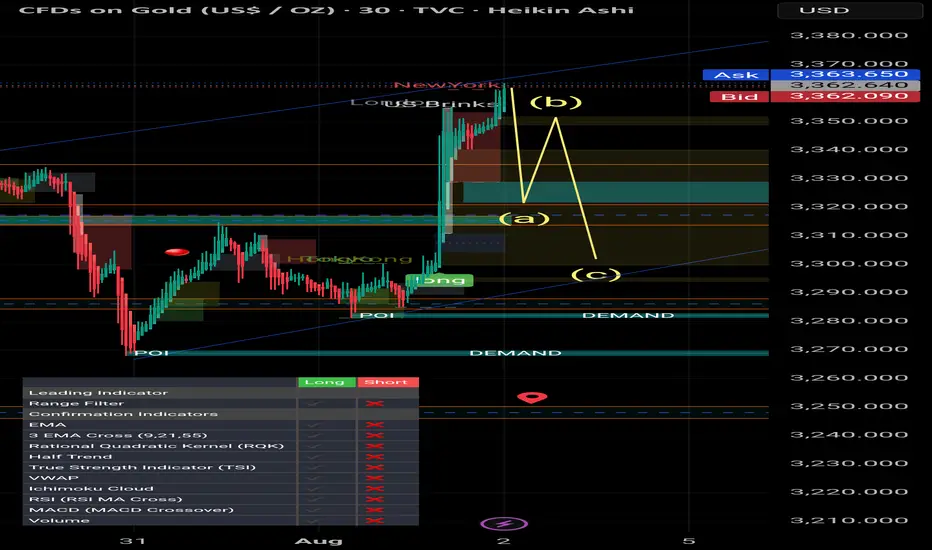
Smart Money / Price Action 5min scalping road map# 📈 ABC Pattern Explained for TradingView (Smart Money / Price Action)
The **ABC pattern** is a 3-leg corrective move in market structure, commonly used in price action, Elliott Wave, and Smart Money trading. It's mainly used to identify **pullbacks** or **correction zones** before a continuation of the main trend.
---
## 🔹 Structure of the ABC Pattern:
- **Point A**: The beginning of the move — often the end of a strong impulsive wave.
- **Point B**: The first retracement or pullback from Point A.
- **Point C**: The second corrective move that often goes beyond A, forming the completion of the correction phase.
The ABC legs can be:
- **A to B**: Impulsive or corrective.
- **B to C**: Generally a counter-trend retracement.
---
## 🔸 How to Identify on Chart:
1. **Find a strong trend** (uptrend or downtrend).
2. **Look for the first correction** — mark it as Point A to B.
3. **Next wave** that attempts to continue the trend but fails — mark the end as Point C.
4. **Use Fibonacci tools** to measure:
- **B retracement of A** (typically 50%–78.6%)
- **C extension** of AB (typically 127.2%–161.8%)
---
## 🔧 How to Draw on TradingView:
> You can use the `Trend-Based Fib Extension` tool or draw manually using the `Path` or `ABC pattern` tool.
### Step-by-Step:
1. Select the `ABC Pattern` tool from the **left toolbar** under “Prediction and Measurement Tools”.
2. Click on **Point A** (3320$).
3. Click on **Point B** (3350$).
4. Click on **Point C** (final corrective wave 3300$ ).
5. TradingView will automatically plot the shape with labels.
---
## 🧠 Pro Tips:
- Look for **liquidity sweep** or **order blocks** near Point C.
- Entry opportunity is often **after C**, targeting a **continuation** of the main trend.
- ABC is often part of **larger structures** like **complex pullbacks** or **smart money retracements**.
---
## ✅ Example Use:
- **Buy Scenario**:
- Strong uptrend → Price drops from A to B (retracement).
- Then price rises to C, failing to break above A → Possible new higher low formed.
- Enter long if price breaks above Point B again.
- **Sell Scenario**:
- Strong downtrend → A to B is a pullback.
- C attempts new high, fails → short entry after break of B.
---
## 📌 Settings Tip for Mobile Users:
- Zoom in for better point control.
- Use “Lock” feature to prevent accidental move.
- Customize color and label visibility in the style tab.
---
## 🔍 Keywords:
`ABC Pattern`, `Elliott Correction`, `Smart Money`, `Liquidity Grab`, `Break of Structure`, `Trend Continuation`, `Price Action Trading`, `Market Structure`
---
GOLD - WAVE 5 BULLISH TO $3,734 (UPDATE)As I said on our last update, this 'Gold Bullish Scenario' remains valid as price has still failed to close below $3,245 (Wave 2) low.
As long as Gold remains above Wave 2 high ($3,245), this Gold bullish bias remains an option. As traders we always have to be prepared to adapt to different market conditions.

Gold is in the Bearish Direction after Formation ManipulationHello Traders
In This Chart GOLD HOURLY Forex Forecast By FOREX PLANET
today Gold analysis 👆
🟢This Chart includes_ (GOLD market update)
🟢What is The Next Opportunity on GOLD Market
🟢how to Enter to the Valid Entry With Assurance Profit
This CHART is For Trader's that Want to Improve Their Technical Analysis Skills and Their Trading By Understanding How To Analyze The Market Using Multiple Timeframes and Understanding The Bigger Picture on the Charts
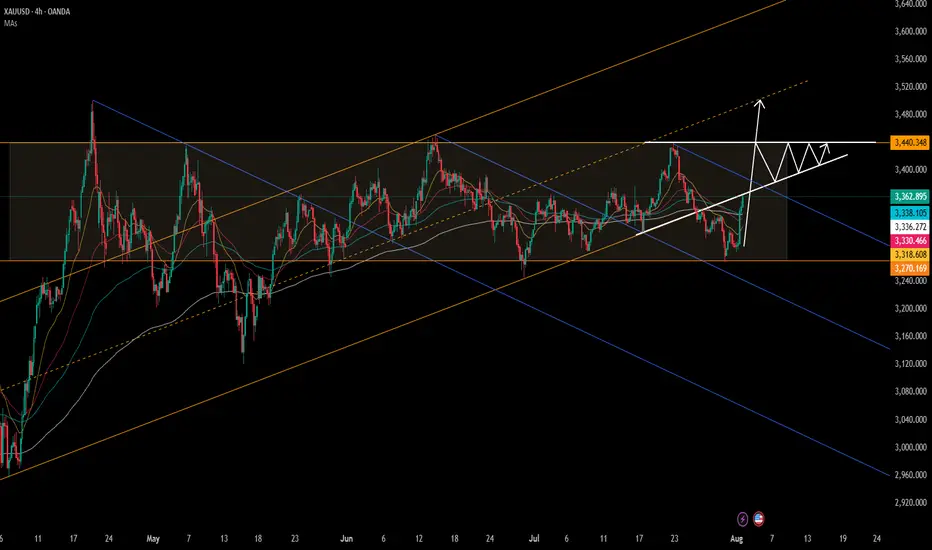
Go long on gold at low prices, targeting above 3400.Go long on gold at low prices, targeting above 3400.
Gold 4-Hour Chart:
As shown in the chart, from a macroeconomic perspective, despite the rise in gold prices, it remains trapped within a trend channel.
Currently, gold prices are under pressure in the 3370-3380 range.
On Friday, driven by risk aversion, gold prices briefly rose to $3363. With the Federal Reserve resuming its rate hikes over the weekend, expectations for a September rate hike have risen to 80%.
The most robust strategy for gold prices next week: enter long at low prices and manage your position accordingly.
Going long at current prices is not recommended. Instead, watch for potential declines due to profit-taking after the price dips.
Upward resistance lies near 3370 and 3380, where previous reversals occurred.
Every waterfall pattern offers a buying opportunity on the decline.
Although gold is currently strong, if we are bullish, we should not chase the gains. Simply wait patiently for prices to fall back to lower levels before going long.
Short-term intraday trend
Upside focus: Resistance at 3372-3385
Downside focus: Support at 3345-3340 and 3315-3320.
Gold Strategy:
1: Buy on the first dip into the 3338-3343 range, with a small stop-loss and a target price of 3370-3380.
2: Go long at low prices and control position size. This is definitely the most stable trading strategy. Patiently maintain a swing strategy. Target 3400+.
3: Continue to monitor resistance near 3440 next week. As shown in the chart, a converging triangle pattern may form.
How to maintain stable operations before NFP dataYesterday, gold closed the month with a long upper shadow doji candlestick, indicating strong upward pressure, with monthly resistance at 3439-3451. Today marks the beginning of the month, and with the release of numerous data indicators such as NFP, unemployment benefits, and PMI, there is considerable uncertainty, so intraday trading should proceed with caution.
Judging from the daily chart, the current MACD indicator is dead cross with large volume, and the smart indicator is running oversold, indicating a low-level fluctuation trend during the day. At present, we need to pay attention to the SMA60 moving average and the daily middle track corresponding to 3327-3337 on the upper side, and pay attention to the intraday low around 3280 on the lower side. The lows of the previous two days at 3275-3268 cannot be ignored. There is a possibility that the low-level oscillation will touch the previous low again.
From the 4H chart, technical indicators are currently flat, with no significant short-term fluctuations expected. Low-level volatility is expected to persist within the day. Then just focus on the support near 3275 below and the middle track pressure near 3307 above. Looking at the hourly chart, gold is currently oscillating below the mid-range band, with resistance at 3295-3307 to watch in the short term.
Overall, the market is expected to remain volatile before the release of today's data. Based on Wednesday's ADP data, this round of data is also expected to be around $100,000. The contrast between ADP and NFP last time deserves our caution. The current market is basically optimistic about the short-selling situation, which is exactly what I am most worried about. If the gold price can stabilize above 3,300 before the NY data, the possibility of NFP data being bullish cannot be ruled out.
Intraday European trading suggestion: if the current gold price falls back to 3285-3280 and stabilizes, you can consider short-term long positions, with the target at 3295-3305. If the gold price tests the low of 3275-3268 again and does not break through, you can consider a second chance to go long. After making a profit of $10-20, you can consider exiting the market with profits. The market is volatile and unstable, so be sure to bring SL with you and pay close attention to the impact of the NFP data. Conservative investors can enter the market after the data is released.
I maintain my #3,277.80 and #3,252.80 TargetsI didn't engaged any re-Sell orders throughout yesterday's session and re-Sold Gold on #3,295.80 ahead of Asian session, with plan to keep orders over-night. However due NFP, Gold might be stationary / ranging until the news as I closed both of my orders on #3,291.80 / each #9.000 Eur Profit and my #3,300.80 pending Sell limit has been triggered over-night which is now running in Profits with Stop on breakeven. I do expect #3,277.80 and #3,252.80 Targets to be met within #1 - #3 sessions and if there aren't NFP numbers, I would keep all three orders / set of Selling orders maintaining my first #3,277.80 Target. Due the news, Gold might fluctuate within Neutral Rectangle until the news.
Technical analysis: My earlier Selling configuration / Technical expectations was confirmed on Hourly 4 chart under prolonged weakness and Price-action respecting the trend-line guarding the downtrend (very Bearish formation) as Hourly 1 chart is already an aggressive Descending Channel (width opened on Williams) that should reach it’s next local Low’s (currently Trading slightly below Double Bottom) and Oversold state near my take Profit of #3,252.80 benchmark. If the bands are widened Traders may witness #3,277.80 test, also if gets invalidated and #3,270.80 gives away, #3,252.80 mark extension test is inevitable. In any case I will update my Targets or levels of Profit taking if I decide to exit earlier than #3,252.80 benchmark to be in accordance with the Daily chart’s period / I already ride Selling wave since #,3,300's and my Profit will be already good to ignore.
My position: DX is soaring, Gold is under Bearish Technical developments and #3,252.80 benchmark is my final Target of current Selling leg. Only factor which can reverse this Intra-day but not postpone is NFP. I expect downside Jobs surprise which may reverse DX from local High's however hot upside surprise will make Gold test #3,252.80 Intra-day. NFP or not I do believe Gold is Bearish. Trade accordingly.
XAUUSD: BUYThere are some good trading opportunities in the market. That's when to buy. Gold prices haven't fallen further since falling back to 3390. There's no further negative news. Therefore, there won't be a significant short-term decline. Our focus will be on tomorrow's non-farm payroll data update. This is a crucial factor that can cause gold prices to rise or fall significantly in the short term.
I'll update you with real-time buy and sell opportunities. This is based on research from the Swing Trading Center. It's highly authoritative. Don't miss out! Remember to stay tuned.
XAUUSD: BUY 3292-3282 TP 3320. SL 3265

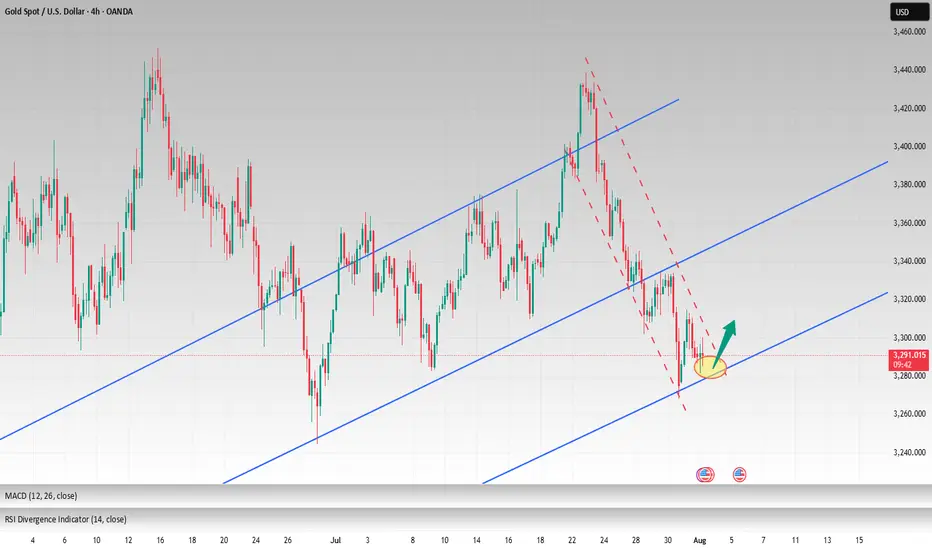
Gold is faking a bullish trapWe are gonna go down to the 3294 level before we see a bounce up. The 3294 level is gonna show up as a strong support to push trough the 3345 area.

Xauusd sell to buy ideaThere is going to be more sells all the way down to the support zone before a big buy to ALL TIME HIGH let's anticipate

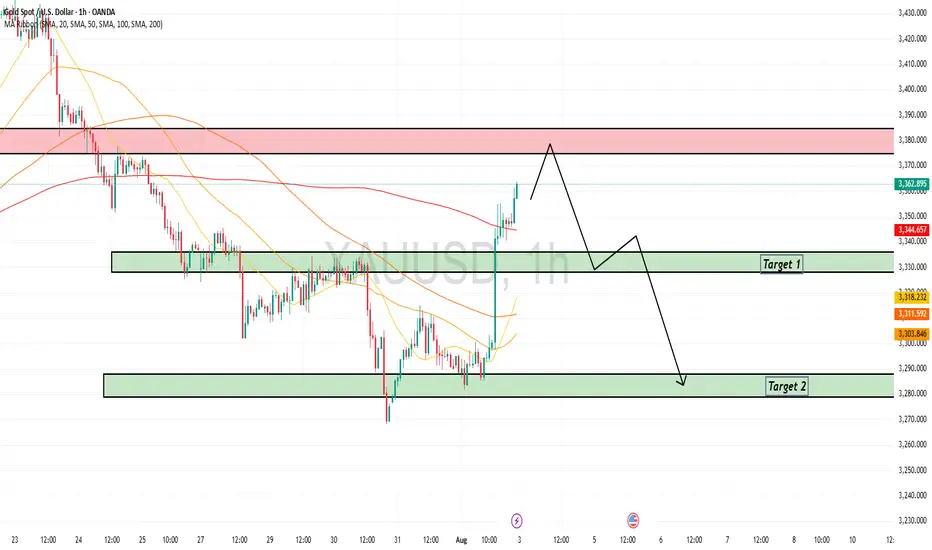
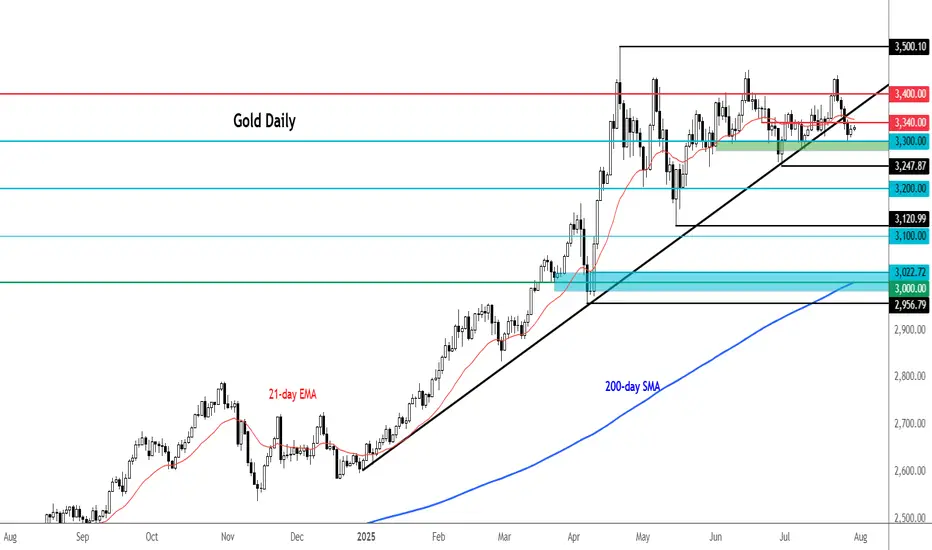
Gold remains below trend line ahead of FOMCAhead of today's US GDP and FOMC policy decision, gold was trading little-changed. The metal has breached its 2025 bullish trendline, which was positioned in the $3,330–$3,350 area. This breakdown shifts the technical outlook to mildly bearish, although further downside confirmation is needed through the loss of additional support levels to solidify bearish control.
From a bullish standpoint, the metal must reclaim and hold above the broken trendline to reignite upward momentum. However, the longer it remains below the $3,330–$3,350 zone, the greater the likelihood of a short-term correction—particularly if the immediate support at $3,300 fails. A break below this level would expose the June low at $3,247 as the next significant support.
By Fawad Razaqzada, market analyst with FOREX.com
On the upside, resistance is now stacked at $3,350, $3,385, and $3,430
7/30: Watch for Sell Opportunities in the 3352–3363 ZoneGood morning, everyone!
After a period of consolidation and decline, gold has found preliminary support near the 3300 level, and early signs of a bottom formation are emerging. The key technical level now lies around the 3332–3337 resistance zone. Based on current price structure, a breakout is likely, with major resistance seen at 3352–3358, while 3323–3316 serves as the primary support range.
However, caution is warranted as today’s ADP employment data may significantly influence short-term price action. Whether gold can hold above the 3337–3343 level depends on the data's impact.
From a broader perspective:
On the weekly chart, the 20-period moving average (MA20) has climbed to around 3276, yet the overall structure remains bearish for bulls
On the daily chart, gold is still trading below the MA60, facing notable resistance
This week's key events — ADP (Wednesday), jobless claims, and NFP (Thursday and Friday) — will likely shape gold’s medium-term trend
Trading Strategy for Today:
Focus on the 3313–3353 trading range, and be highly responsive to data-driven volatility.
Important note: If gold rises to 3343–3358 before the ADP release, then regardless of whether the data is bullish or bearish, the preferred approach is to sell into strength, as a post-data pullback is a likely scenario.

XAUUSD – TCB Strategy Setup✅ TCB Strategy Analysis
Trend Phase
HTF Bias: Recently shifted from bearish to potential bullish — clear breakout from descending channel.
Current Structure: Price has broken above channel and retested former structure resistance (~3325) as support.
Bias: Bullish continuation forming.
🚨 XAUUSD – TCB Strategy Setup (EP1 Active, EP2 Pending) 💥
Price just broke out of the descending channel and is now forming a solid base above the 3325 zone.
✅ EP1 (Pullback Buy) already triggered after price retested support.
📍 EP2 will activate on clean breakout + retest of 3330 zone.
🎯 Targets:
• TP1: 3348
• TP2: 3356–3360
If price loses 3325 structure, we reassess. For now, I’m bullish while structure holds.
This setup aligns 100% with the TCB Strategy:
Trend Phase: Bullish structure forming
Countertrend: Liquidity sweep + reclaim
Breakout Phase: Incoming on 3330 retest
🧠 Flow with structure, not emotion.
💬 Drop your comment if you're trading Gold too.
#TCBFlow #XAUUSD #GoldAnalysis #SmartMoney #BreakoutTrading #FlowWithTCB

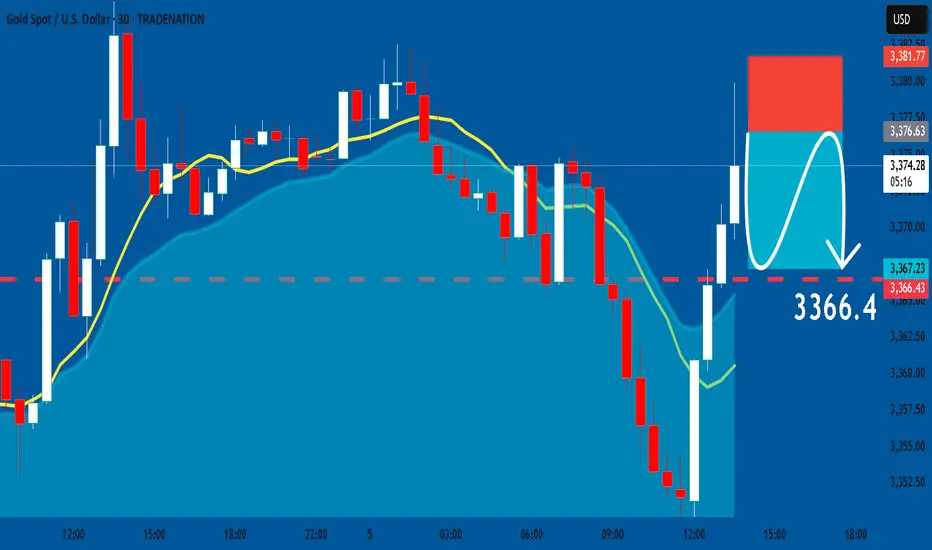
GOLD: Short Signal with Entry/SL/TP
GOLD
- Classic bearish setup
- Our team expects bearish continuation
SUGGESTED TRADE:
Swing Trade
Short GOLD
Entry Point - 3376.5
Stop Loss - 3381.7
Take Profit - 3366.4
Our Risk - 1%
Start protection of your profits from lower levels
Disclosure: I am part of Trade Nation's Influencer program and receive a monthly fee for using their TradingView charts in my analysis.
❤️ Please, support our work with like & comment! ❤️
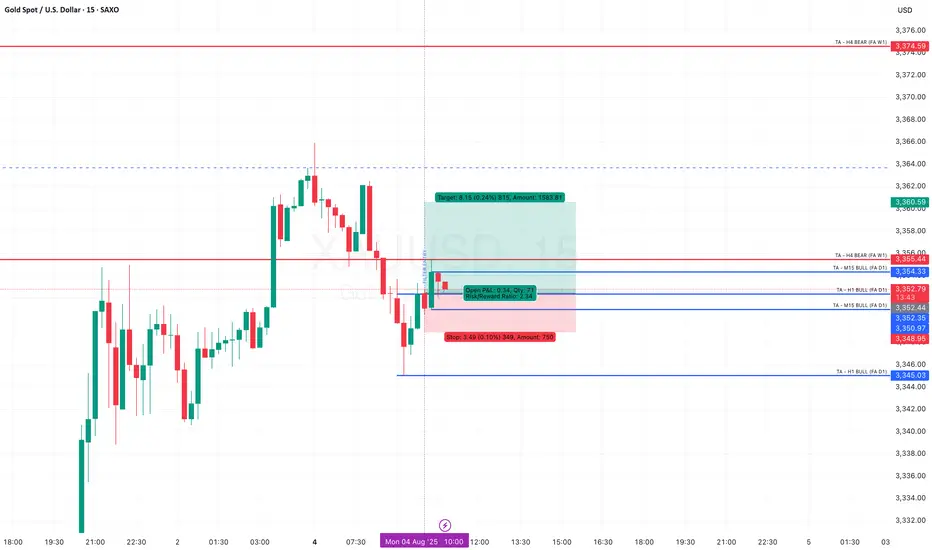
XAU / USD 30 Minute Chart Quick Scalp SellHello traders. As per my previous post, gold moved through my area of interest and I took a small micro lot position. Sold from the red line, closed 75% of the trade's profit at the next red line. My remaining 25% of the trade is the runner, and I will let that run for a bit. My Stop loss is at my entry point, so zero loss, profit secured and I am thankful to BIg G. Let's see what the NY open does in a few hours. Be well and trade the trend. More analysis to come.
