(XAUUSD) H1 timeframe sell analysis(XAUUSD) H1 timeframe sell analysis:
Sell Analysis for Gold OANDA:XAUUSD (XAUUSD) – H1 Timeframe
Technical Structure:
1. Downtrend Channel:
Price was previously trading within a downward sloping channel.
A breakout occurred to the upside (bullish breakout).
2. Order Block (OB):
Price made a strong bullish move from the OB zone.
3. Reversal Swing:
Price tested the resistance level around 3,364.800.
Weak bullish momentum is visible, indicating a possible reversal.
Sell Entry Zone:
Entry Price: Around 3,356 (Reversal swing area).
Stop Loss: Above the resistance – 3,378.000
Confirmation: Look for bearish candle formation near the resistance zone.
Take Profit Levels:
1. TP1: 3,344.000
2. TP2: 3,326.000
3. TP3: 3,306.000
Stop loss 3,378
You can select TP1, TP2, or TP3 depending on your risk appetite.
Reasoning for Bearish Bias:
A rejection wick has formed at the resistance level.
The reversal swing suggests price may be forming a lower high.
Multiple take profit levels are aligned with Fibonacci levels and previous support zones.
After a strong bullish move from the OB zone, a correction is expected.
GOLD trade ideas

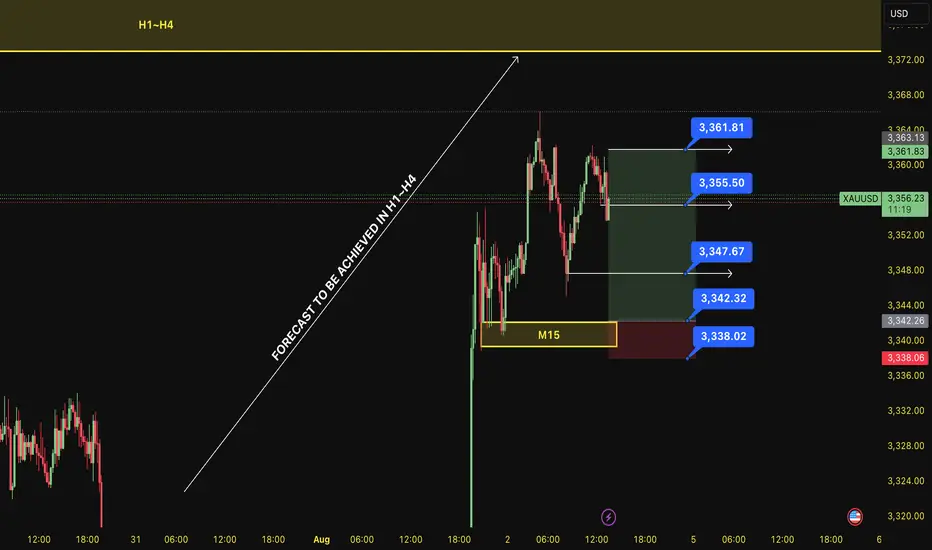
BUY XAU 4.8.2025Confluence order: BUY at M15
Type of order: Limit order
Reason:
- The current top is not touching anything, expected to rise to the H4~H1 above.
Note:
- Management of money carefully at the last bottom (3,347)
Set up entry:
- Entry buy at 3,342
- SL at 3,338
- TP1: 3,347 (~1R)
- TP2: 3,355 (~3R)
- TP3: 3,361 (~4,5R)
Trading Method: Price action (No indicator, only trend and candles)
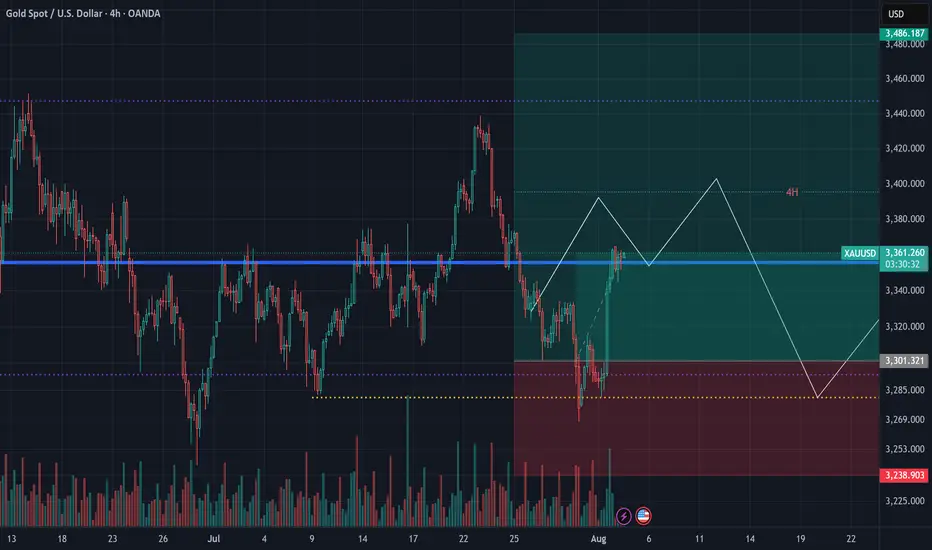
XAUUSD Gold Swing Trading Plan – 1st Week of August 2025 (H4 TF)Strategy Type: Swing Trade (Multi-Day Positioning)
Timeframe: H4 (4-hour)
Market Bias: Bullish Continuation
Risk Profile: Medium-to-Low Frequency, High Conviction
Trade Style: Buy-the-Dip, Scale-out Strategy
🧠 Macro & Technical Outlook
Gold is currently maintaining a bullish higher-high, higher-low structure on the H4 chart, reflecting continued strength from macro drivers including inflation hedging, softening USD, and a shift toward safe-haven assets amid geopolitical and economic uncertainty.
The market has recently completed a local impulse wave and is entering a healthy retracement phase. This sets up a textbook swing opportunity, where pullbacks to key Fibonacci levels can be capitalised for the next bullish leg up.
🔍 H4 Trading Plan Summary
✅ Phase 1: Buy on Pullback to 3360
Entry Zone: 3360 (H4 support and key retracement level)
Reasoning:
Confluence of dynamic support and 50–61.8% Fibonacci retracement zone of the previous H4 swing
Former resistance turned support (RBS zone)
Volume tapering and RSI cooling off — signalling a healthy setup for bullish continuation
Entry Trigger:
Bullish engulfing or pin bar candle on H4
Optional confirmation: RSI > 40 after bounce, MACD crossover
Stop Loss: Below 3340 (beneath structural support)
🎯 Target 1: 3383
Why:
Local resistance zone from previous H4 rejection wick
Close to psychological level and good zone for first partial profit
Action:
Secure 25% profits
Move SL to breakeven or +10 pips for risk-free continuation
Wait for next retracement
✅ Phase 2: Wait for Pullback After 3383
Retracement Zone: Estimated dip to 3370–3375 (higher low area)
Entry Trigger:
Confirmation of strong bounce at this level with tight consolidation and breakout on smaller timeframes (M30/H1)
🎯 Target 2: 3430
Why:
Strong historical resistance from early July
Mid-level of long-term range (3330–3480)
Often serves as decision point between accumulation or breakout
Action:
Secure additional 40–50% profits
Trail SL below the most recent higher low (~3390)
✅ Phase 3: Final Position Hold Toward 3475
Retracement Zone: Likely dip to 3410–3420 after 3430 is reached
Final Entry (Optional): Only if momentum is strong and structure holds
Target 3: 3475
Why:
Multi-month resistance and projected upside target from recent breakout
Round number magnet + liquidity zone for larger institutional exits
Action:
Close remaining 25–30% of the position
Reassess for breakout or reversal at 3475
⚠️ Risk Management Plan
Max exposure: 1.5–2% of account
Stop losses fixed — no averaging down
Use position sizing to handle swing duration volatility
Scale-in only with structure confirmation
🔁 Summary Table
Phase Buy Level Target SL Action
Phase 1 3360 3383 3340 Partial TP, BE SL
Phase 2 3370–3375 3430 3355–3365 Add size, secure more
Phase 3 3410–3420 3475 3390 Final TP, full exit
📊 Indicators to Watch (H4)
RSI: Look for 40–60 zone bounce and push toward 70
MACD: Cross above signal line confirms momentum
Volume: Increased buy-side volume at 3360–3375 confirms entry strength
🧭 Fundamental Considerations
Watch DXY: Weakness in Dollar continues to support Gold’s uptrend
FOMC or Jobs Data Ahead?: Any surprise comments from Fed could introduce volatility
Global Headlines: Risk-off flows (e.g., China/US tensions, war news) are bullish for Gold

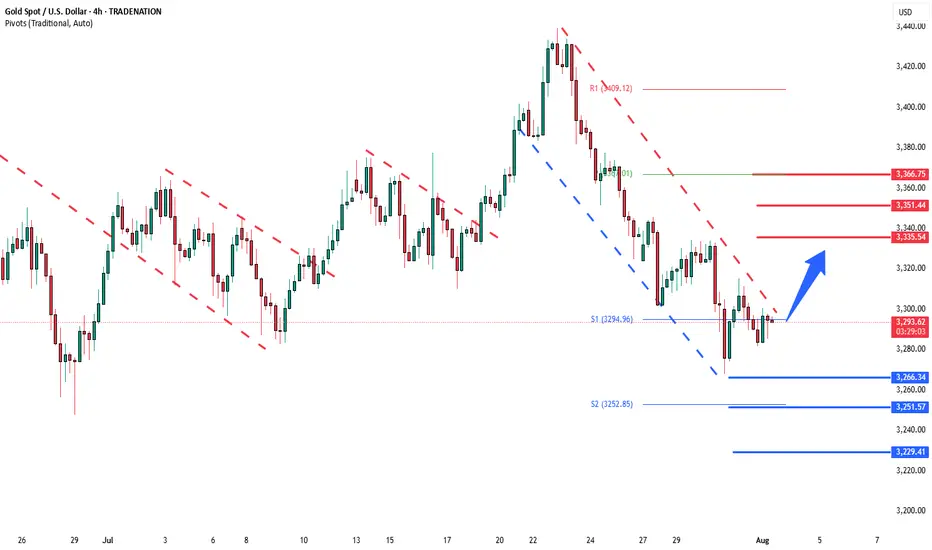
Gold deeper consolidation supported at 3266The Gold remains in a bullish trend, with recent price action showing signs of a continuation breakout within the broader uptrend.
Support Zone: 3266 – a key level from previous consolidation. Price is currently testing or approaching this level.
A bullish rebound from 3266 would confirm ongoing upside momentum, with potential targets at:
3335 – initial resistance
3351 – psychological and structural level
3366 – extended resistance on the longer-term chart
Bearish Scenario:
A confirmed break and daily close below 3308 would weaken the bullish outlook and suggest deeper downside risk toward:
3250 – minor support
3230 – stronger support and potential demand zone
Outlook:
Bullish bias remains intact while the Gold holds above 3266. A sustained break below this level could shift momentum to the downside in the short term.
This communication is for informational purposes only and should not be viewed as any form of recommendation as to a particular course of action or as investment advice. It is not intended as an offer or solicitation for the purchase or sale of any financial instrument or as an official confirmation of any transaction. Opinions, estimates and assumptions expressed herein are made as of the date of this communication and are subject to change without notice. This communication has been prepared based upon information, including market prices, data and other information, believed to be reliable; however, Trade Nation does not warrant its completeness or accuracy. All market prices and market data contained in or attached to this communication are indicative and subject to change without notice.
Gold (XAU/USD) on the 1‑hour timeframeGold (XAU/USD) on the 1‑hour timeframe
Chart Structure & Bias
* Price remains trapped in a **rising channel** (\~\$3,328–3,333), pressing against resistance near **\$3,340–3,345**.
* Short-term momentum is bearish: both EMA 7 and EMA 21 sit above current price, with declining volume signaling weakening buyer strength.
* Overall trend leans neutral‑to‑bearish until market clears key zones decisively.
Trade Scenarios
**Bearish Breakdown (Preferred)**
* **Trigger:** Break and close below channel support (\~\$3,326).
* **Targets:** Initial drop toward **\$3,320**, then **\$3,300**, and possibly lower if momentum intensifies.
* **Invalidation:** Price pushes back above **\$3,333–3,335**, negating bearish structure.
**Bullish Breakout (Conditional)**
* **Trigger:** Clean breakout and sustained close above **\$3,342–3,345**.
* **Targets:** Upward stretch toward **\$3,355–3,360**, and if strong, **\$3,367–3,375+**.
* **Invalidation:** Fails to hold structure—retesting from above back beneath **\~\$3,338**.
Macro Drivers & Market Conditions
* Caution prevails pre‑Fed decision and ADP / GDP releases—market awaits cues on interest rate direction.
* Safe‑haven demand has softened as global trade sentiment improves, while U.S. dollar strength continues to cap upside in gold.
* Analysts favor **sell‑on‑rise positioning**, bumping up potential for controlled pullbacks.
Verdict
Gold is consolidating in a tight upward channel, showing short-term bearish pressure. The **bearish breakdown scenario holds the edge** unless price convincingly clears above **\$3,345** on strong volume, which could flip bias. A confirmed break below **\$3,326** sets the stage for downward moves toward **\$3,300** or lower.

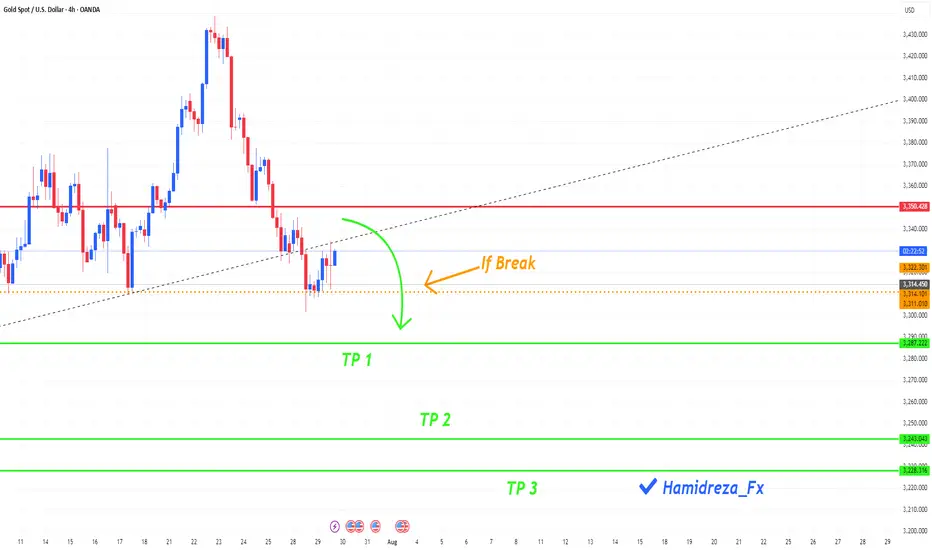
Do you think gold is on a correction?
Hi my dears
Gold looks set to hit lower targets if it breaks the orange dotted line
What do you think?
The weekly timeframe has confirmed the bearish trend.
If you liked my analysis, just like me by liking and commenting.
Gold Bearish OpportunityStrong bearish momentum
Close below 3300 could trigger further sell off
Possibility of liquidity & volatility is high due to monthly close - Stay Cautious

GOLD Bearish Breakout!
HI,Traders !
#GOLD is trading in a strong
Downtrend and the pair
Broke the key horizontal
Level around 3318.97 which
Reinforces our bearish
Bias and we will be
Expecting a further
Bearish move down !
Comment and subscribe to help us grow !

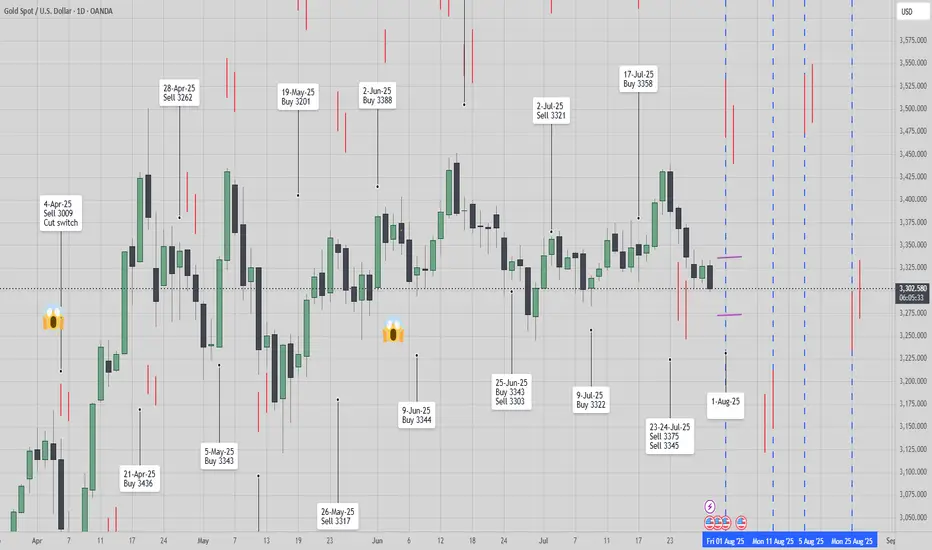
[ TimeLine ] Gold 31 July 2025📆 Today’s Date: Wednesday, July 30, 2025
📌 Upcoming Signal Dates:
• July 31, 2025 (Thursday) — Single-candle setup
• July 31–August 1, 2025 (Thursday–Friday) — Two-candle combined range
🧠 Trading Outlook & Notes
✅ Gold has recently dropped sharply from 3439 to 3298, and current conditions suggest this bearish momentum may continue.
✅ I’ll be actively trading both the July 31 and July 31–August 1 setups as part of my ongoing strategy testing and live analysis.
✅ This method and timing structure can also be applied to other assets like BTC, the US Index, and various commodities.
⚠️ For those taking a more cautious approach, it’s absolutely okay to skip the single-candle setup on July 31 and wait for the more confirmed 2-day range setup (July 31–August 1).
📋 Execution Guidelines
🔹 Range Identification:
• Let the Hi-Lo range of the chosen candle(s) form completely.
• Purple lines will mark these ranges on the chart.
• After the daily close, charts will be updated to include a 60-pip buffer, Fibonacci zones, and relevant indicators.
🔹 Entry Conditions:
• Trades are triggered only if price breaks above/below the full range, including the buffer zone.
🔹 Risk Management – Recovery Logic:
• If the Stop Loss is triggered, the trade is exited or switched, and the next valid breakout setup will use a doubled lot size to attempt recovery.
📉📈 Chart Snapshot
🔗 Paste this in TradingView: TV/x/fykxBG6w/
📌 Stick to the plan, follow the system, and let the chart lead the way.
🛡️ Capital protection comes first — always manage your risk.
XAUUSD - TAKE A LOOKHere are some guidelines of what could happen. This is purely technical analysis, which may be affected by any news, but it is currently aligning with the ongoing movement.

RIDE THE TREND OPPORTUNITYPrice seems to have a correction movement before continue flying to next supply area.

XAUUSD Technical Analysis – Bullish Continuation SetupXAUUSD Technical Analysis – Bullish Continuation Setup
📊 Market Structure Overview:
The chart shows a clear bullish structure shift, marked by multiple Break of Structure (BOS) events that validate strength from buyers. After forming equal lows and a liquidity sweep at the strong support zone, price has aggressively moved higher, breaking through minor resistance levels and showing clear bullish intent.
🧱 Key Technical Elements:
🔹 1. Strong Support Zone (Demand Rejection)
Price respected the strong demand zone between $3,260 – $3,280, where aggressive buying was seen after forming a bullish engulfing breakout. This zone aligns with previous demand and a major BOS, confirming institutional buying interest.
🔹 2. Bullish Order Flow & Break of Structure (BOS)
Multiple BOS levels across July and early August highlight a sequence of higher highs and higher lows, indicating trend continuation.
The most recent BOS after July 30 shows an impulsive break, confirming bullish dominance and clean order flow.
🔹 3. Fair Value Gaps (FVGs)
Bullish FVG (Mid-July): Price respected and bounced from this zone, showing previous imbalance was filled and used as a base for continuation.
New FVG (Above $3,420): The current upside target lies within this area, acting as a magnet for price due to unfilled orders.
🔹 4. Buy-Side Liquidity & Target Zone
The market is approaching a buy-side liquidity zone around $3,385, a key short-term target where previous highs and stop orders are likely pooled.
If liquidity above $3,385 is taken efficiently, price may expand into the FVG zone between $3,420 – $3,460.
🔹 5. Bullish Confirmation & Momentum
The candle structure shows a clean bullish impulsive move, followed by minor consolidation—likely a bullish flag/pennant indicating potential for further continuation.
Momentum is favoring buyers, and short-term consolidation above $3,340 is healthy for continuation.
🔐 Liquidity & Institutional Narrative
Equal Lows (EQL) and FVG fills suggest prior liquidity was swept and used to fuel institutional long positions.
The recent BOS confirmed that smart money has shifted bias toward longs, and price is now targeting remaining inefficiencies to the upside.
The clear alignment of BOS, liquidity sweep, and bullish FVGs reinforces a strong institutional footprint on this move.
🔍 Key Levels to Watch:
Level Type Price Zone (USD)
🔺 Resistance / FVG 3,420 – 3,460
🎯 Immediate Target 3,385
📉 Short-Term Support 3,340 – 3,320
🛡️ Major Demand Zone 3,260 – 3,280
📌 Conclusion & Outlook:
XAUUSD has initiated a strong bullish leg from the demand zone, confirming accumulation and structural reversal. Price is now moving toward the buy-side liquidity target of $3,385, with potential continuation toward the FVG resistance zone of $3,420–$3,460.
As long as price remains above the $3,320 structure support, the bullish bias remains intact. Any pullbacks should be seen as buying opportunities, especially on lower timeframe confirmations.

XAUUSD Technical Outlook – August 4, 2025Last week, prior to Powell’s speech, we expected a move down to the $3280 area.
While we anticipated a brief pullback to lighten liquidity around $3400 first,
price instead dropped straight down without a bounce.
✅ The reaction at our level was spot-on,
culminating in a weekly close above $3360 — very bullish.
With liquidity around $3370 already cleared,
we don’t expect strong resistance ahead.
📈 The preferred strategy for this week: Buy gold.
🎯 A solid entry zone lies between $3320–$3330.
⚠️ For those insisting on counter-trend trades,
we strongly advise keeping targets small.
Gold rebound is weak, short below 3315
Gold remains weak, with multiple intraday rebounds failing to maintain momentum. The upper moving average continues to suppress the market, and the short-term market remains dominated by bears. Today, we are following the trend and taking a bearish stance. The key upside level is around 3315. If it reaches this level before the US market opens or if it peaks in the short term, we will short sell. The non-farm payroll data will be released today, and we will consider reversing our direction based on the situation after the data.
Gold prices have once again encountered resistance to their upward trend, and the volatile pattern continues. The gold price trend is trending lower highs, and today's low is expected to be lower than yesterday's. Therefore, our intraday short target could be 3268 or even lower, so it's crucial to seize the right entry point.
If you're new to the market, come to me. I'll teach you how to trade while you learn. If you're already in the market and struggling, come to me. I'll help you avoid repeating the same mistakes. If you've already experienced this market and are battered, come to me. I'm confident I can help you regain confidence. If you're stuck in a position, I'll develop a strategy tailored to your entry point. Because everyone's trapped positions are different, the solutions will vary, some suitable for conservative traders and others for aggressive ones. However, I can't offer a perfect answer to every situation. I suggest you bring your order with you. Once you contact me, I'll use the most appropriate method to resolve your situation and help you exit the market.
Specific Strategy
Short gold at 3315, stop loss at 3325, target at 3280

XAUUSD
XAUUSD Updated in 15M :
The gold signal is marked on the chart based on the latest price changes and the supply and demand in the market. These points include the entry point, stop loss, and take profit

Gold Bulls Charging to 3305 But What’s Waiting There?Gold has recently taken support from the lower levels and has also shown a Break of Structure (BoS) to the downside. Currently, there is Imbalance and Internal Draw on Liquidity (IDM) resting around the 3305 level. The market appears to be moving upward to mitigate that imbalance. It's important to closely monitor this zone, as once the market reaches and fills this area, there is a high probability of a potential rejection or bearish move from that level

Scalping Sell Setup – Trendline Break & Pullback Confirmation📉 Scalping Sell Setup – Trendline Break & Pullback Confirmation
Posted earlier – trade progressing as planned.
As shared in the previous chart, a Sell scalp position was executed based on the trendline break followed by a pullback retest.
Three Take-Profit levels were marked and the price is moving in line with the forecast. ✅
🟢 TP1 Hit
🟢 TP2 Reached
🔵 TP3 in progress
📌 The setup remains valid, and as long as structure holds below the retested trendline, the bearish bias continues.
We will monitor price action near TP3 zone for final exit or trailing stop update.
> Analysis worked perfectly so far – let’s see if TP3 gets cleared soon. 🔍💥

Gold VS US 10- year yield Gold pared most of its gains on a strong US dollar. It hits an intraday low of $3307 and is currently trading around $3311.
Any breach below $3305 (365- 4H EMA) confirms trend weakness and a dip to $3245/$3200 is possible. The strong US dollar and surge in US 10-year yield after strong US jobless claims and GDP data.
It is good ot sell below $3305 with an SL around $3330 for a TP of $3245/$3200.

Gold in short term selling momentum 2.5 RR !After breaking HL with FVG, all we need to do is touch the OB, and we will see the drawdown immediately.
Entry 3370
SL 3390
Take profit1 3340
Take profit2 3330
Take profit3 3320
#Make your research.
#on your responsibility


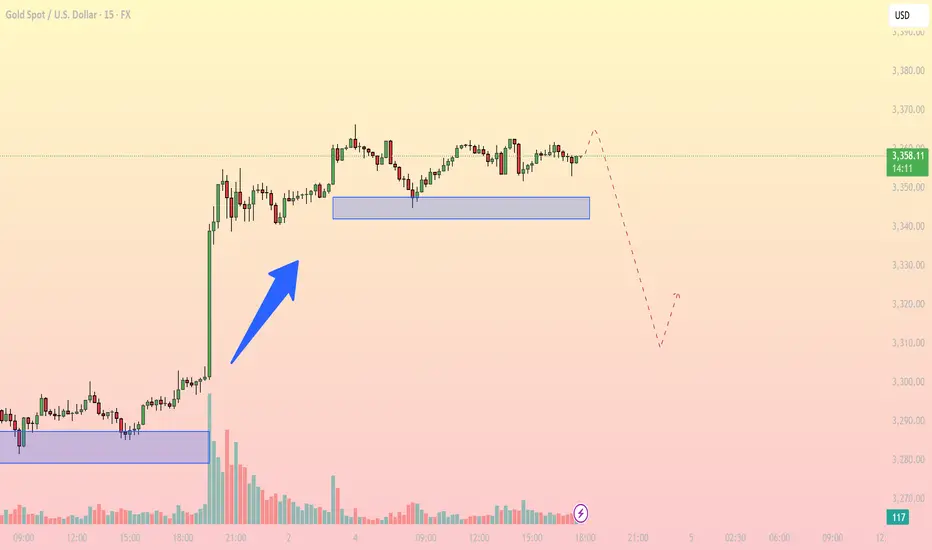
Distribution Phase at the Top, Key Support in FocusFollowing a sharp breakout from the demand zone around $3,310, gold has entered a sideways consolidation range between $3,355 – $3,367. The price has repeatedly tested the support at $3,352 – $3,354 but failed to form higher highs beyond $3,367. This signals buyer exhaustion and a potential distribution pattern at the top.
The inability to push higher suggests increased risk of a bearish breakdown.
Key Technical Levels
Immediate Resistance: $3,367.77
Short-Term Support: $3,352 – $3,354 (blue box zone)
Major Support Below: $3,310 – $3,315 (previous breakout base, near 0.5 Fibonacci retracement)
Suggested Trading Strategies
Primary Scenario: Sell on Breakdown
Trigger Condition: Price breaks below $3,352 with increasing volume
Entry: $3,350
Stop Loss: $3,360
Target: $3,320 – $3,310
This is a momentum-following setup, ideal if the current support fails.
Alternative Scenario: Buy from Major Support
Entry Zone: $3,310 – $3,315
Stop Loss: Below $3,300
Target: $3,345 – $3,355
Suitable for counter-trend traders looking to catch a rebound off strong demand.
Additional Technical Signals
EMA 20 (15m): Flattening out, indicating loss of bullish momentum
RSI: Hovering around 50, showing a balance between buyers and sellers
Volume: Gradually decreasing, suggesting a potential breakout setup is building
Gold is currently in a distribution phase after a sharp upward move. If the $3,352 support zone breaks, a retracement toward $3,310 – $3,315 is likely. However, bulls may step back in around that zone for a potential rebound.
Follow for more real-time gold strategies. Save this post if you find it useful for today’s session!
XAUUSD 15m XAUUSD Possible Pullback Buy SetupThis is what I'm looking at currently for gold. The breakout from the range and reclaim of previous resistance as support indicates buyers are in control, but market is approaching heavy resistance above, so I'm looking for “buy dips” rather than chasing late longs.

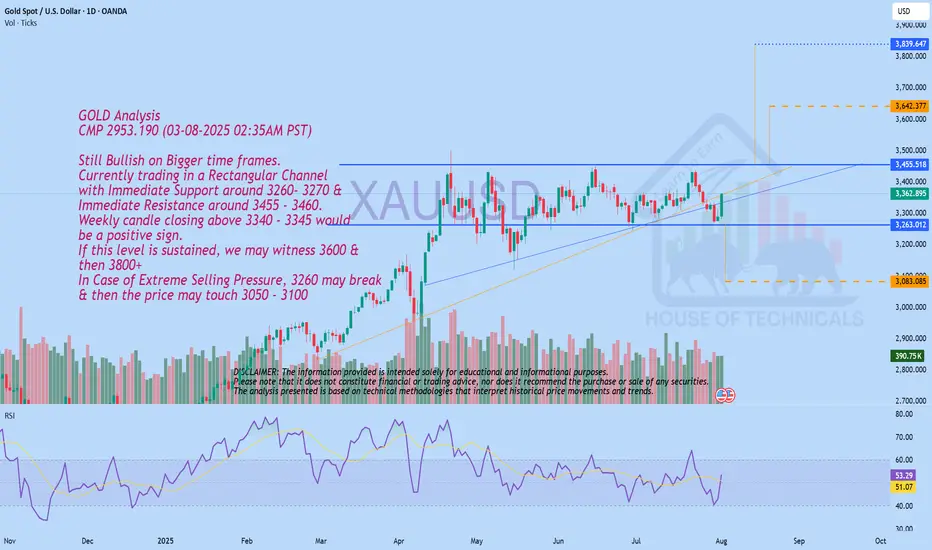
Currently trading in a Rectangular ChannelGOLD Analysis
CMP 2953.190 (03-08-2025 02:35AM PST)
Still Bullish on Bigger time frames.
Currently trading in a Rectangular Channel
with Immediate Support around 3260- 3270 &
Immediate Resistance around 3455 - 3460.
Weekly candle closing above 3340 - 3345 would
be a positive sign.
If this level is sustained, we may witness 3600 &
then 3800+
In Case of Extreme Selling Pressure, 3260 may break
& then the price may touch 3050 - 3100