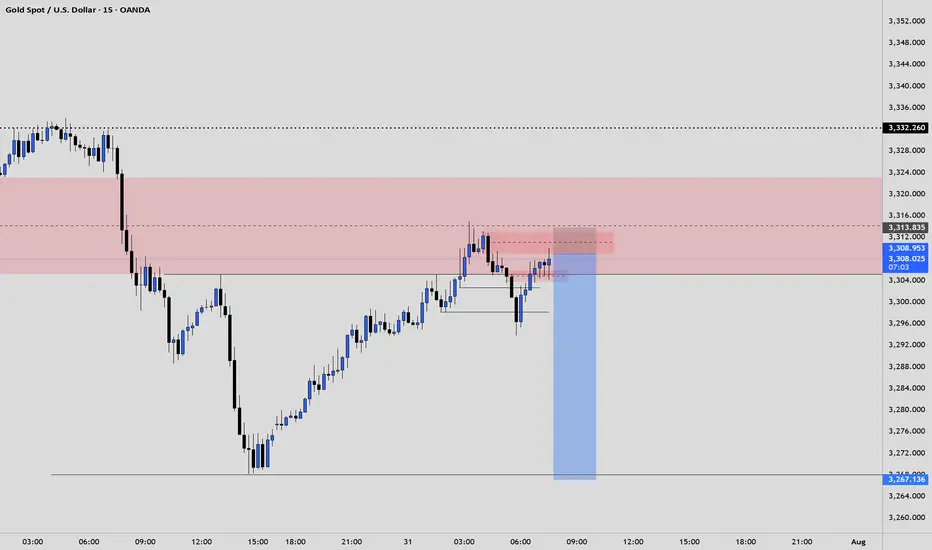
XAU/USD 08 August 2025 Intraday AnalysisH4 analysis:
-> Swing: Bullish.
-> Internal: Bullish.
You will note that price has targeted weak internal high on three separate occasions which has now formed a triple top, this is a bearish reversal pattern and proving this zone is a strong supply level. This is in-line with HTF bearish pullback phase.
Remainder of analysis and bias remains the same as analysis dated 23 April 2025.
Price has now printed a bearish CHoCH according to my analysis yesterday.
Price is now trading within an established internal range.
Intraday Expectation:
Price to trade down to either discount of internal 50% EQ, or H4 demand zone before targeting weak internal high priced at 3,500.200.
Note:
The Federal Reserve’s sustained dovish stance, coupled with ongoing geopolitical uncertainties, is likely to prolong heightened volatility in the gold market. Given this elevated risk environment, traders should exercise caution and recalibrate risk management strategies to navigate potential price fluctuations effectively.
Additionally, gold pricing remains sensitive to broader macroeconomic developments, including policy decisions under President Trump. Shifts in geopolitical strategy and economic directives could further amplify uncertainty, contributing to market repricing dynamics.
H4 Chart:
M15 Analysis:
-> Swing: Bullish.
-> Internal: Bullish.
H4 Timeframe - Price has failed to target weak internal high, therefore, it would not be unrealistic if price printed a bearish iBOS.
The remainder of my analysis shall remain the same as analysis dated 13 June 2025, apart from target price.
As per my analysis dated 22 May 2025 whereby I mentioned price can be seen to be reacting at discount of 50% EQ on H4 timeframe, therefore, it is a viable alternative that price could potentially print a bullish iBOS on M15 timeframe despite internal structure being bearish.
Price has printed a bullish iBOS followed by a bearish CHoCH, which indicates, but does not confirm, bearish pullback phase initiation. I will however continue to monitor, with respect to depth of pullback.
Intraday Expectation:
Price to continue bearish, react at either M15 supply zone, or discount of 50% internal EQ before targeting weak internal high priced at 3,451.375.
Note:
Gold remains highly volatile amid the Federal Reserve's continued dovish stance, persistent and escalating geopolitical uncertainties. Traders should implement robust risk management strategies and remain vigilant, as price swings may become more pronounced in this elevated volatility environment.
Additionally, President Trump’s recent tariff announcements are expected to further amplify market turbulence, potentially triggering sharp price fluctuations and whipsaws.
M15 Chart:
GOLD trade ideas

GOLD RISING AGAIN1. MA20 on weekly held the price again
2. Gold is making Higher Lows in a row
3. 100 days of sideway movement
Now its time for $4000 in my opinion

XAU/USD 01 August 2025 Intraday AnalysisH4 Analysis:
-> Swing: Bullish.
-> Internal: Bullish.
You will note that price has targeted weak internal high on three separate occasions which has now formed a triple top, this is a bearish reversal pattern and proving this zone is a strong supply level. This is in-line with HTF bearish pullback phase.
Remainder of analysis and bias remains the same as analysis dated 23 April 2025.
Price has now printed a bearish CHoCH according to my analysis yesterday.
Price is now trading within an established internal range.
Intraday Expectation:
Price to trade down to either discount of internal 50% EQ, or H4 demand zone before targeting weak internal high priced at 3,500.200.
Note:
The Federal Reserve’s sustained dovish stance, coupled with ongoing geopolitical uncertainties, is likely to prolong heightened volatility in the gold market. Given this elevated risk environment, traders should exercise caution and recalibrate risk management strategies to navigate potential price fluctuations effectively.
Additionally, gold pricing remains sensitive to broader macroeconomic developments, including policy decisions under President Trump. Shifts in geopolitical strategy and economic directives could further amplify uncertainty, contributing to market repricing dynamics.
H4 Chart:
M15 Analysis:
-> Swing: Bullish.
-> Internal: Bullish.
H4 Timeframe - Price has failed to target weak internal high, therefore, it would not be unrealistic if price printed a bearish iBOS.
The remainder of my analysis shall remain the same as analysis dated 13 June 2025, apart from target price.
As per my analysis dated 22 May 2025 whereby I mentioned price can be seen to be reacting at discount of 50% EQ on H4 timeframe, therefore, it is a viable alternative that price could potentially print a bullish iBOS on M15 timeframe despite internal structure being bearish.
Price has printed a bullish iBOS followed by a bearish CHoCH, which indicates, but does not confirm, bearish pullback phase initiation. I will however continue to monitor, with respect to depth of pullback.
Intraday Expectation:
Price to continue bearish, react at either M15 supply zone, or discount of 50% internal EQ before targeting weak internal high priced at 3,451.375.
Note:
Gold remains highly volatile amid the Federal Reserve's continued dovish stance, persistent and escalating geopolitical uncertainties. Traders should implement robust risk management strategies and remain vigilant, as price swings may become more pronounced in this elevated volatility environment.
Additionally, President Trump’s recent tariff announcements are expected to further amplify market turbulence, potentially triggering sharp price fluctuations and whipsaws.
M15 Chart:

DeGRAM | GOLD reached the $3300 level📊 Technical Analysis
● XAUUSD remains capped below a broken trendline retest near 3,355, while price forms a lower-high inside a descending channel.
● The repeated rejection of the 3,357.83 resistance level, coupled with failed bullish continuation, points to renewed downside toward 3,300 and 3,262.
💡 Fundamental Analysis
● A rebound in the DXY after strong US consumer sentiment and pending home sales adds pressure to gold, reaffirming real-yield strength.
● Traders are reducing long exposure ahead of upcoming NFP data and Powell’s next statement, shifting bias away from risk hedges.
✨ Summary
Short bias below 3,355. Break under 3,320 eyes 3,300 → 3,262. Key breakdown risk if lower trendline fails.
-------------------
Share your opinion in the comments and support the idea with a like. Thanks for your support!

I maintain my #3,277.80 and #3,252.80 TargetsI didn't engaged any re-Sell orders throughout yesterday's session and re-Sold Gold on #3,295.80 ahead of Asian session, with plan to keep orders over-night. However due NFP, Gold might be stationary / ranging until the news as I closed both of my orders on #3,291.80 / each #9.000 Eur Profit and my #3,300.80 pending Sell limit has been triggered over-night which is now running in Profits with Stop on breakeven. I do expect #3,277.80 and #3,252.80 Targets to be met within #1 - #3 sessions and if there aren't NFP numbers, I would keep all three orders / set of Selling orders maintaining my first #3,277.80 Target. Due the news, Gold might fluctuate within Neutral Rectangle until the news.
Technical analysis: My earlier Selling configuration / Technical expectations was confirmed on Hourly 4 chart under prolonged weakness and Price-action respecting the trend-line guarding the downtrend (very Bearish formation) as Hourly 1 chart is already an aggressive Descending Channel (width opened on Williams) that should reach it’s next local Low’s (currently Trading slightly below Double Bottom) and Oversold state near my take Profit of #3,252.80 benchmark. If the bands are widened Traders may witness #3,277.80 test, also if gets invalidated and #3,270.80 gives away, #3,252.80 mark extension test is inevitable. In any case I will update my Targets or levels of Profit taking if I decide to exit earlier than #3,252.80 benchmark to be in accordance with the Daily chart’s period / I already ride Selling wave since #,3,300's and my Profit will be already good to ignore.
My position: DX is soaring, Gold is under Bearish Technical developments and #3,252.80 benchmark is my final Target of current Selling leg. Only factor which can reverse this Intra-day but not postpone is NFP. I expect downside Jobs surprise which may reverse DX from local High's however hot upside surprise will make Gold test #3,252.80 Intra-day. NFP or not I do believe Gold is Bearish. Trade accordingly.
60MIN trade Fibonacci extension trade. Return to Objective Point(1,00) after reaching Expanded Objective Point (1,618)

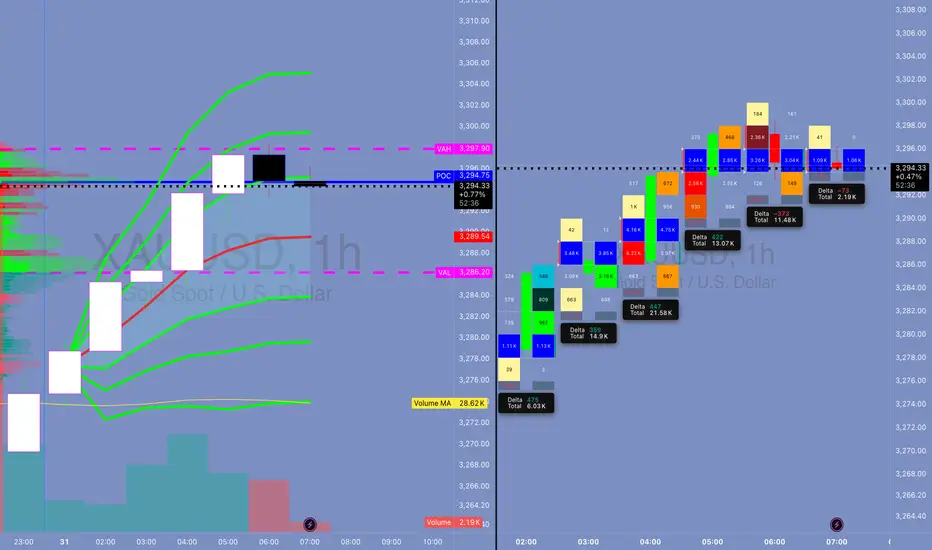
XAUMO XAUUSD (Gold Spot) ANALYSIS | AUG 01, 2025 | CAIRO TIME GMThis is a stealth bullish accumulation day. Market maker completed a fake drop and now prepping breakout. Play long bias from control zone with stop-hunt fade backup. Schabacker would call this a false breakdown spring + congestion base rally.
XAUUSD (Gold Spot) ANALYSIS | AUG 01, 2025 | CAIRO TIME GMT+3
🔍 Multi-Timeframe Technical Breakdown (Daily → 5m)
1️⃣ Price Action & Patterns
Daily: Bullish rejection tail forming (pin bar) off VAL (3,288). Strong buyer defense.
4H: Classic bullish engulfing off VAL support. High rejection wick to downside. Micro-structure shows market maker trap.
1H: V-shape recovery seen. Absorption bar confirmed via footprint delta spike.
15m: Buyers stepping in at POC (3,289.35), stealthy buying—confirmed by divergence between delta & price.
5m: Accumulation in box range between 3,289–3,292. High absorption on bid side, low offer lifting—sign of stealth long build.
2️⃣ Volume & Delta Footprint
POC Cluster across all TFs: 3,289.00–3,291.50 is the control zone.
Volume Node Rejection at 3,288 = confirmed buyer base.
Delta: Absorption → sellers hitting bids but no follow-through = market maker trap → bullish implication.
Volume Spike at 3,288 = fakeout move likely manipulated to hunt stops.
3️⃣ Support/Resistance
VAL: 3,288 🔥 Strong Demand Zone
POC: 3,289.35–3,291.75 🧠 Smart Money Zone
VAH: 3,292.80 🎯 Break above confirms momentum
Res. Extension: 3,296.20, 3,300
Fibonacci Confluence: 3,288 = 61.8% golden retracement from recent rally
5️⃣Volatility
Compression near VAH = Volatility Expansion imminent.
Expect Breakout in next 1–2 hours (likely post 09:00 Cairo Time – Kill Zone)
6️⃣ Market Maker Philosophy
Last 3 days show liquidity vacuum trap below 3,288.
MM has triggered stop hunts to shake weak longs.
Building long inventory stealthily under POC.
Expecting rally trap to suck in breakout buyers → then retrace → final breakout continuation.
🧨 JEWEL TRADE ENTRY (Highest Probability)
📈 Order: Buy Stop
🎯 Entry: 3,293.10
🛑 Stop Loss: 3,287.70
💰 Take Profit: 3,302.40
📊 Confidence: 87%
🧠 Justification: Breakout of VAH/Golden Zone + High Volume Node = Trend Shift Confirmed
This is for EDUCATIONAL PURPOSE ONLY, and not financial advise.
gold 4hour say: put sellstop in lowpersonaly i predict mini crash on gold and waiting for it , now we have powerfull 3angel pattern we must put sellstop in last low , buystop on last high
sellstop stoploss = last high
if sellstop open like new traders , dont close it soon , wait minimum 2 week ,understand?
ALERT= if gold can break last high , it can start new up trend, wave , so if you have old sells ,you must put SL or hedge buystop in last low
if sell
wishhhhhhhhhhhhhh youuuuuuuuuuuuuuuu win

August 1, 2025 - XAUUSD GOLD Analysis and Potential Opportunity🔍 Key Levels to Watch:
• 3323 – Resistance
• 3309 – Resistance
• 3300 – Psychological level
• 3295 – Resistance
• 3283 – Key support
• 3268 – Short-term support
• 3260 – Support
• 3245 – Major support
• 3233 – Support
📈 Intraday Strategy:
• SELL if price breaks below 3283 → target 3280, then 3275, 3268, 3260
• BUY if price holds above 3286 → target 3289, then 3295, 3300, 3305
👉 If you find this helpful or traded using this plan, a like would mean a lot and keep me motivated. Thanks for the support!
Disclaimer: This is my personal view, not financial advice. Always use proper risk control.
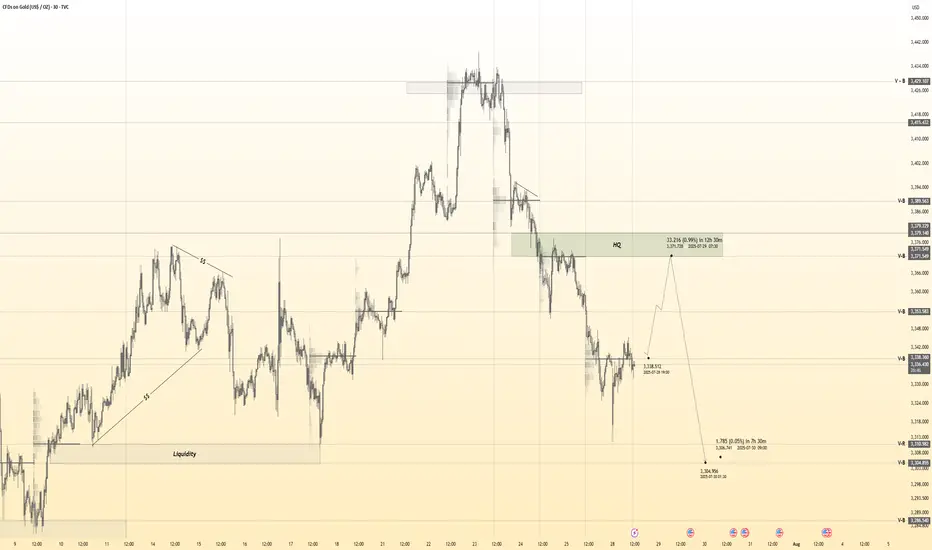
Full review of my NY basket and trading ideas for todayFull analysis and trading ideas for todays NY session for DXY, Silver, Gold, WTI, NAS, S&P, DJ30

XAU / USD 4 Hour ChartHello traders. Here is a lower time frame analysis pertaining to the weekly that I recently posted. Area to watch is marked. It is the end of the month, things get tricky. Trade carefully. Be well and trade the trend. Shout out to Big G. Happy Wednesday.

XAUUSD ShortElite analysis - NEWS TRADE
Executed of a 3m OB
Targeting lower LPs
Price is reacting at New Event of this OB.
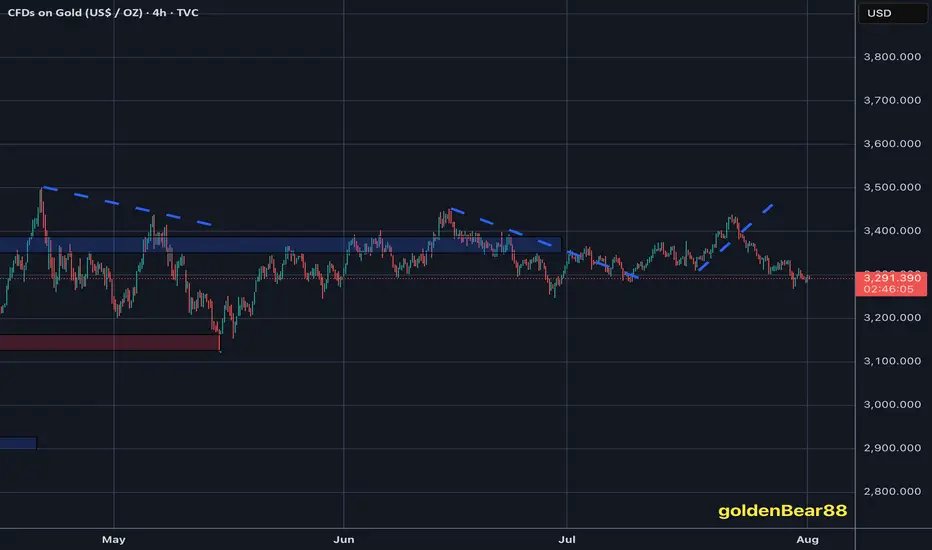
XAUUSD Does it need to test the 1D MA100 first?Gold (XAUUSD) is attempting to break below its Triangle formation just 4 days after marginally breaking above it. This has invalidated that pattern so after breaking also below its 1D MA50 (blue trend-line), it could technically go for a 1D MA100 (green trend-line) test for the first time since January 06 2025.
If it does, there will be more probabilities for a stronger than before rebound to make a new High. Our Targe is the 2.0 Fibonacci extension at $3620.
Keep also an eye on the 1D RSI Buy Zone, which has been giving the most optimal buy signals since April 07 2025.
-------------------------------------------------------------------------------
** Please LIKE 👍, FOLLOW ✅, SHARE 🙌 and COMMENT ✍ if you enjoy this idea! Also share your ideas and charts in the comments section below! This is best way to keep it relevant, support us, keep the content here free and allow the idea to reach as many people as possible. **
-------------------------------------------------------------------------------
Disclosure: I am part of Trade Nation's Influencer program and receive a monthly fee for using their TradingView charts in my analysis.
💸💸💸💸💸💸
👇 👇 👇 👇 👇 👇

Lingrid | GOLD Weekly Market Outlook: Resistance Zone RejectionOANDA:XAUUSD markets have encountered significant resistance at the $3,450 level, resulting in a notable rejection and subsequent pullback toward support zones. The precious metal is now testing critical technical levels that will determine whether the broader bullish momentum can be sustained or if deeper correction is imminent.
The 4H chart reveals a clear level rejection at the resistance zone, followed by an impulse leg lower that has broken the upward trendline. This development suggests a potential shift in short-term momentum, with gold now trading within the consolidation zone between $3,365 and $3,285. The break of the ascending trendline is particularly significant, indicating that bulls may be losing control of the immediate price action.
The second chart provides valuable context with the weekly and 16-hour timeframe analysis. The pinbar rejection candle on the weekly chart confirms strong selling pressure at these elevated levels. The 16-hour chart shows multiple tests of the upward trendline, with the recent break potentially signaling a bearish impulse leg. However, the overall structure remains within the broader ascending channel, suggesting this could be a healthy correction within the long-term uptrend.
Critical levels to monitor include the $3,285 support zone and the broken trendline at $3,365. A decisive break below $3,285 could trigger a deeper correction toward $3,200, while reclaiming the upward trendline would restore bullish momentum toward new highs.
If this idea resonates with you or you have your own opinion, traders, hit the comments. I’m excited to read your thoughts!

XAUUSD – Bearish Outlook Ahead of FOMCGold is currently under bearish pressure as markets await the highly anticipated FOMC meeting, scheduled to begin in less than an hour. Investors are closely watching the Fed's interest rate decision and the release of the meeting minutes, which could trigger sharp volatility across the forex and commodities markets.
Technical Outlook:
From a technical perspective, the price action suggests a potential continuation of the bearish trend. If the FOMC event leads to a stronger U.S. dollar or a hawkish tone from the Fed, gold prices may decline further.
Resistance Zone; 3315 / 3330
Support Levels: 3282 / 3260
You May find more details in the Chart.
Trade wisely Best Of Luck Buddies.
Ps: Support with like and comments for better insights Thanks for understand.

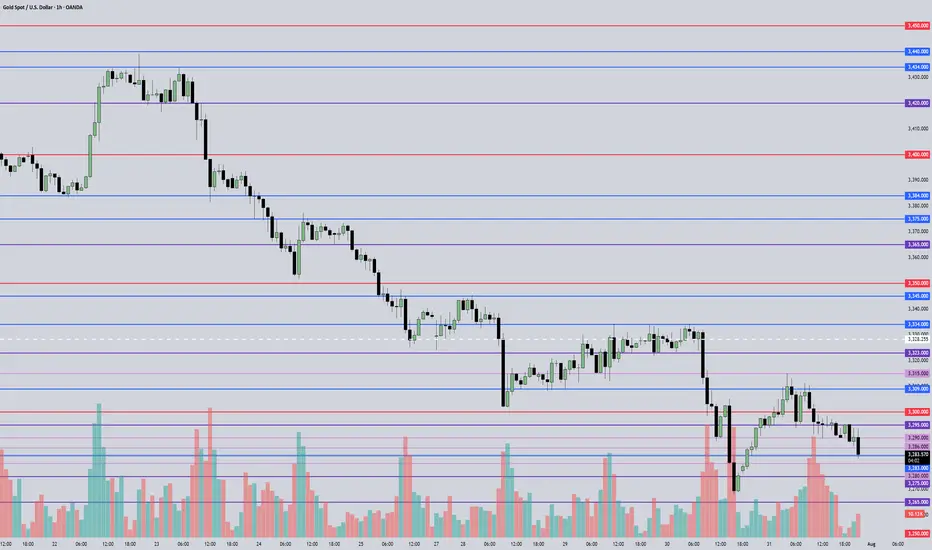
Report - 31 jully, 2025Summary
Initial optimism following the historic US–EU trade agreement has swiftly eroded as France and Germany openly criticized the deal, warning it undermines EU sovereignty and economic stability. The euro fell sharply, carmakers led equity declines, and political fractures within the bloc widened. While the deal averted a full-blown trade war, concerns over inflation, competitiveness, and regulatory submission have shifted sentiment. The perception of European capitulation under pressure from Trump has reignited transatlantic tensions and injected fresh volatility into global markets.
This retreat in EU support underscores the precarious nature of transatlantic cooperation under Trump’s economic nationalism. Meanwhile, signs of tech decoupling, tariff expansion beyond the EU, and deferred retaliation signal a fractured global trade order. European fiscal policy, particularly Germany’s defense-driven deficit expansion, is now under heightened scrutiny amid market volatility and FX pressure.
Market Reactions
Equity markets across the EU opened higher on tariff relief expectations but reversed course as Germany’s Chancellor Merz and France’s Prime Minister Bayrou denounced the deal. The DAX fell 1.1%, CAC 40 slipped 0.4%, and eurozone auto stocks plunged 1.8%. The euro lost over 1% against the dollar in its second-largest daily drop this year, reflecting concern over structural imbalance and political subordination.
In contrast, semiconductor stocks surged, with ASML and BE Semiconductor rising over 4% as the tech sector escaped tariffs. Wall Street remained relatively stable, buoyed by optimism around defense, energy, and tech sectors gaining from the deal. The dollar index (DXY) rose 0.9%, reflecting both euro weakness and expectations that inflationary tariffs could keep Fed rates elevated.
Fiscal and Political Implications
The backlash from Berlin and Paris lays bare deep fractures within the EU regarding its posture toward Washington. Chancellor Merz’s warning of "considerable damage" and Bayrou’s reference to EU “submission” cast doubt on Ursula von der Leyen’s negotiation strategy. The deal’s imposition of a 15% baseline tariff—triple the pre-deal weighted average—exposes Europe to substantial cost increases without achieving reciprocal liberalization.
Internally, the European Commission is accused of caving to U.S. pressure while undermining its own credibility. Documents and diplomatic leaks suggest that more aggressive retaliatory planning was watered down due to fears of a broader security rupture, particularly concerning NATO and U.S. arms support to Ukraine. This reinforces the EU’s strategic dependency, limiting its ability to resist U.S. economic coercion.
Germany’s effort to shield its auto industry via offset schemes largely failed, while Brussels’ “trade bazooka” was shelved in favor of “strategic patience.” This perceived capitulation may embolden further unilateral action from the U.S., especially as Trump eyes tariffs on pharmaceuticals and rest-of-world imports up to 20%.
Strategic Forecasts
Europe's short-term economic outlook has darkened. The tariff burden—especially on high-margin exporters like German autos—raises inflation risks while lowering competitiveness. Political backlash could destabilize Commission leadership and provoke calls for more aggressive economic sovereignty.
Expect further euro weakness, sectoral underperformance in autos and industrials, and possibly downgrades to GDP forecasts across the eurozone. On the U.S. side, Trump’s success with transatlantic leverage may embolden him to expand tariff threats to Asia and Latin America. The Fed will likely face a more inflationary policy environment, with fiscal and protectionist stimulus prolonging higher rate expectations.
Simultaneously, China's relief from U.S. tech export freezes—designed to secure a Xi-Trump summit—adds complexity to the strategic tech rivalry. The suspension of chip export controls could spur near-term capital inflows to Chinese AI firms while igniting concern in U.S. defense circles.
Risks and Opportunities
Risks
Breakdown in EU cohesion and trust in Commission leadership
Expansion of U.S. tariffs to rest of world (ROW), escalating global trade friction
Retaliation by China if U.S. chip diplomacy reverses
Drag on European industrial profits and inflation-driven ECB recalibration
Fed rate path upwardly skewed due to structural tariff-driven inflation
Opportunities
U.S. defense and energy sectors benefit from guaranteed EU purchases
Semiconductors remain shielded, with valuation support in ASML, TSMC, Nvidia
Dollar strength provides tactical trades in EURUSD, GBPUSD
Select EM exporters (e.g. Brazil) benefit from re-diversified trade flows
AI hardware and chip infrastructure (Samsung–Tesla deal) gains strategic momentum
Key Asset Impact – Outlook
XAUUSD (Gold):
Gold holding firm around $3,340. With fresh political discord and rising protectionist inflation, gold remains a hedge. If Fed signals rate hold, expect a push to $3,400.
Bias: Bullish
S&P 500:
Resilient, driven by defense, energy, and AI. But prolonged strong dollar and tariff-induced input cost pressures are risk factors.
Bias: Moderately Bullish
Dow Jones:
Benefiting from defense and dividend-heavy mix, but under pressure from industrial drag.
Bias: Neutral to Bullish
DXY (US Dollar Index):
Strengthening on euro weakness and policy divergence. However, long-term Fed autonomy concerns and political volatility could reverse trend.
Bias: Bullish short-term, Neutral longer-term
USDJPY:
Little movement today. BoJ still cautious, yen capped unless Fed shifts dovish or global risk-off resumes.
Bias: Range-bound
EURUSD:
Second-largest single-day drop YTD. Political backlash and export headwinds limit upside.
Bias: Bearish
Crude Oil (WTI):
Flat to slightly higher, supported by EU commitment to U.S. energy, but demand data remains soft.
Bias: Neutral
Stoxx Autos:
Heavy selloff (-1.8%) despite tariff reduction, reflecting margin pressure.
Bias: Bearish
ASML / BE Semiconductor:
Relief rally on tariff exclusion. Long-term tailwinds from open AI infrastructure and Samsung–Tesla chip deal.
Bias: Bullish
Following the signing of a landmark trade deal between the U.S. and the European Union, immediate relief in financial markets has quickly given way to political and economic backlash within the EU. France and Germany, two of the bloc’s largest economies, have openly criticized the agreement, warning it will damage their industrial competitiveness and economic sovereignty. German Chancellor Friedrich Merz labeled the 15% blanket tariff “damaging” for both Europe and the United States, while French Prime Minister François Bayrou called it a “dark day” for EU autonomy. Despite avoiding a full-blown transatlantic trade war, the nature of the deal — seen by critics as submission under U.S. pressure — has sharply divided European leaders and exposed internal fractures in Brussels' negotiation strategy.
Market reactions reflect this shift in sentiment. The euro recorded its second-largest single-day drop this year, falling 1.1% against the dollar as investor confidence in European political resolve weakened. Equity markets, particularly in Germany and France, reversed earlier gains. The DAX fell 1.1%, the CAC 40 dropped 0.4%, and the Stoxx Europe 600 Auto Index declined by 1.8%, led by steep losses in Volkswagen, BMW, and Mercedes-Benz. While semiconductor stocks bucked the trend — with ASML and BE Semiconductor rising over 4% after escaping tariffs — the overall message was one of fading optimism and growing policy disarray. On the U.S. side, the dollar strengthened, aided by expectations that tariff-driven inflation will keep Federal Reserve interest rates elevated.
President Trump, emboldened by what many perceive as a successful economic power play, has signaled that he may impose tariffs of up to 20% on countries outside the deal framework — effectively targeting much of the global economy. Sectors such as pharmaceuticals and biotechnology appear to be next in line, with chip exports already under scrutiny. This expands the sphere of tariff risk, placing emerging markets and global exporters on high alert. If implemented, these levies could spark renewed capital flows into U.S. assets and exert further downward pressure on global growth forecasts.
The European Union’s failure to mount a credible retaliatory response has amplified the perception of its weakened position. Brussels initially suspended its response to U.S. tariffs in April and internal discord among member states diluted the EU’s “trade bazooka.” While a €93 billion retaliatory package was drafted, the effective threat fell to only €9 billion of actionable tariffs after exemptions were carved out for politically sensitive sectors like Irish whiskey and Italian beef. Critics argue that this strategic retreat undermined the bloc’s negotiating leverage. Strategic dependence on U.S. security guarantees — particularly for eastern and northern EU states — contributed to Brussels' caution, as did fears that escalation could prompt Washington to cut off military aid to Ukraine or withdraw from NATO commitments.
Simultaneously, the U.S. has quietly frozen certain export restrictions on China to facilitate a potential trade accord with Beijing and secure a meeting between Presidents Trump and Xi Jinping. The move, which includes halting a ban on Nvidia’s H20 chip, has drawn criticism from over 20 U.S. national security officials who warn that the chip could enhance China's military and surveillance capabilities. Despite these concerns, the Commerce Department has been instructed to avoid further provocative actions for now. This provides a temporary tailwind for Chinese tech equities and hardware manufacturers, though the strategic rivalry between Washington and Beijing remains unresolved.
In the private markets, a notable structural shift is underway. Private equity investors are increasingly opting to cash out of continuation vehicles — special funds used to extend ownership of portfolio companies — rather than roll over their stakes. Liquidity has become paramount as traditional exits via IPOs and trade sales remain scarce. Data from Houlihan Lokey shows that over 85% of investors chose to exit such vehicles in 2025, up from 75% last year. This underscores broader risk aversion and signals a waning appetite for illiquidity and long-duration exposure in uncertain macro conditions.
Overall, the global strategic landscape is growing more fragmented. Europe is politically divided and economically exposed. The U.S. is leveraging its market dominance to enforce strategic compliance, while China is benefiting from a temporary softening in U.S. export policy. Capital is flowing toward liquidity, defensives, and tech infrastructure — and away from uncertainty and regulatory entanglement. Investors should remain attuned to central bank reactions, retaliatory threats, and sudden shifts in geopolitical posture over the coming weeks.

Gold 30Min Engaged ( Bullish After Break Out Entry Detected )———
Time Frame: 30-Minute Warfare
Entry Protocol: Only after volume-verified breakout
🩸Bullish Break - 3339
➗ Hanzo Protocol: Volume-Tiered Entry Authority
➕ Zone Activated: Dynamic market pressure detected.
The level isn’t just price — it’s a memory of where they moved size.
Volume is rising beneath the surface — not noise, but preparation.
🔥 Tactical Note:
We wait for the energy signature — when volume betrays intention.
The trap gets set. The weak follow. We execute.
XAUUSD eyes potential Gartley patternOn the daily chart, XAUUSD has retreated from its highs, and short-term bears have the upper hand. Currently, we can pay attention to the area below 3191, which is a potential buy level for a bullish Gartley pattern and is within the previous demand zone.

Roadmap to 3982: Key Long Entries and Profit ZonesThe initial long entry zone is between 3290 and 3275 .
From this range, an uptrend is expected to begin, targeting 3416 , which is our first exit point to close the initial long position.
After that, we wait for the next long entry , ideally around 3333 to 3319 . A new upward movement from this range is expected to reach 3455 . At this level, we continue to hold the position while placing the stop loss at the entry level to protect profits.
The next take profit target is 3650 , which may be reached by the end of 2025 or in 2026.
The final target is 3982 , which is likely to be hit in 2026, as the market may not have enough strength to reach it in 2025.

XAUUSD Update CONSOLIDATIONAfter bullish rejection, Gold make a new lower and break 3283 support level.
Now it seemslike bounce to make a correction and retest 3305 resistance.
If 3305 reject, price will continue moving downside and retest 3245 support.
If it break 3245...it will continue to find it support, near 3205 support zone.
Have a blessing day !

GOLD → False breakdown 3310. Consolidation ahead of news...FX:XAUUSD is forming a false breakdown of support at 3310, thereby confirming the boundaries of the trading range. The dollar is testing strong resistance within the global downtrend. And in the near future, we can expect more economic news...
Gold is trading below the key resistance level of $3345, remaining in a narrow range ahead of the Fed's decision and US GDP data for Q2. Weak data could reinforce expectations of a rate cut and support gold, while strong data would strengthen the dollar. The Fed is likely to keep rates at 4.25–4.5%, with markets pricing in a 64% chance of a 25 bps cut in September. Investors are waiting for signals from Jerome Powell, with a possible split within the Fed: some members may support calls for easing, which would be a driver for gold.
Technically, the situation on D1 is quite interesting. Gold is still below the previously broken trend resistance, but there is no continuation of the momentum. Buyers are reacting to support at 3310, but the market is stagnating due to uncertainty ahead of the news...
Resistance levels: 3345, 3375
Support levels: 3320, 3310, 3287
Thus, from a technical analysis perspective, I expect a retest of 3345, followed by a pullback to support at 3320, from which gold could move higher (if the bulls take the initiative), but if 3320 breaks and 3310 comes under pressure, gold could test 3287. Again, the emphasis is on trend support (the upward line) in the 3335-33450 zone. If the price can consolidate in this zone, we will have confirmation that the price has returned to the boundaries of the upward trend.
Best regards, R. Linda!

MACRO CONTEXT & NEWS FLOW IMPACT — "WHY THE HELL IT MOVED"🔥 I. MACRO CONTEXT & NEWS FLOW IMPACT — "WHY THE HELL IT MOVED"
Yesterday’s move was a classic institutional fakeout followed by controlled accumulation. Today is retest day. Watch VWAP and order flow like a hawk. Don’t chase, wait for reversion and load at value.
📅 Date: July 30, 2025
📰 Event:
US Employment Cost Index: Lower than expected
Core PCE: Cooled off
Market Implication: Fed easing is now on the table.
DXY Weakens → Real yields drop → Gold gets bought like crazy.
👊 Institutional Logic:
Rate-sensitive assets (Gold, Bonds) exploded after the release.
Algorithmic reaction to macro signal: DXY down → XAU bid hard → MegaBar explosion.
BUT institutions needed liquidity to enter big → they faked a breakdown first.
That’s institutional deception 101.
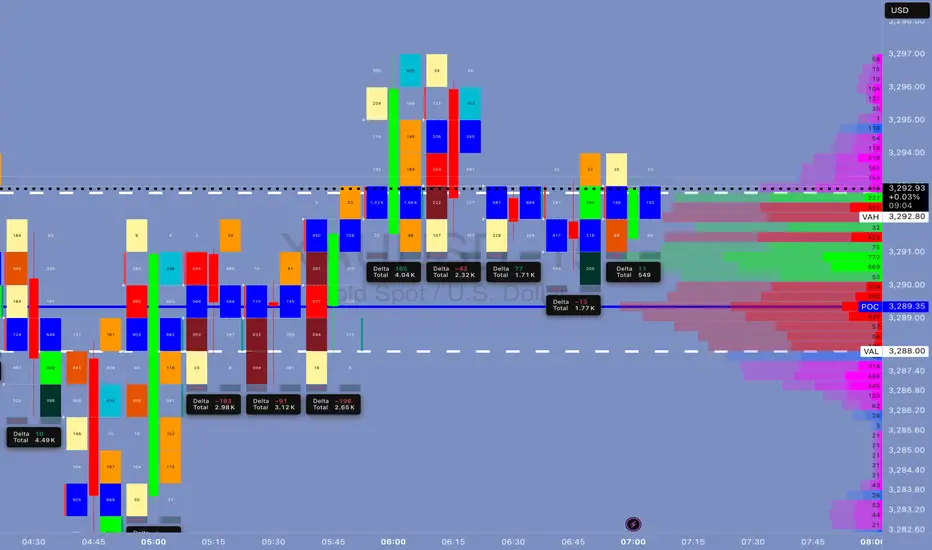
📉 II. DAILY CHART ANALYSIS — THE BIG BOYS' GAMEBOARD
🗺️ Structure:
Price dropped from 3,355 to 3,258 in 3 days — a high-velocity markdown.
On July 30, Price printed a Megabar reversal (Massive range, delta-flush, volume spike).
VAH = 3,294.90 capped upside.
POC = 3,288.91, and VAL = 3,282.90 held beautifully.
🔍 Institutional Pattern:
This is a classic “Flush > Absorb > Mark-up” sequence.
Textbook from “Technical Analysis and Stock Market Profits”:
“Volume confirms intention, range confirms commitment. A wide bar with climax volume at low implies the exhaustion of sellers and transfer of ownership.”
🔑 Key Daily Stats:
📉 Delta Flush: -584K
🔁 Reversal Delta: +70K
🔊 Volume spike: >450K (Well above 30-day volume MA)
💡 Inference:
This bar did not print because of retail buying. It’s smart money rebuying from panic sellers.
⏱️ III. 4H / 1H TIMEFRAME: ORDERFLOW & REACCUMULATION
📌 4H Chart:
📍 Megabar with -191K delta near 3,258 (Volume: 191.14K)
Immediate absorption by dark blue and green delta bars — this was not retail reversal.
VWAP reversion in play — price gravitates toward 3,294 (VWAP anchor zone)
🔁 1H Chart:
Rapid stair-stepping: Each hourly candle had higher lows and strong deltas.
Volume built from super-POC 3,289 to super-VWAP 3,295.25.
Final hour: exhaustion wick → distribution into resistance.
🧠 Institutional Tactic:
They used Volume by Price congestion to hold price between FVRP bounds:
Low Volume Nodes (LVNs) = acceleration zones
High Volume Nodes (HVNs) = consolidation + absorption zones
🔍 IV. 15M / MICROSTRUCTURE — WHERE THE GAME WAS REALLY PLAYED
🔬 VWAP Stack Analysis:
VWAP: 3,294.61
D-VWAP: 3,289.30
Super-VWAP Cluster held price in check — real institutional price magnet.
🔄 Delta Flow (15m):
Delta climbed from -3.15K → +3.21K in 1.5 hours.
Imbalance flipped bullish near POC.
🎯 FPVR Mapping (Volume Profile Right Side):
Thickest distribution volume occurred at 3,287 – 3,295
Value tightly packed = fair price.
Institutions are loading in value, not chasing.
⚙️ V. INDICATOR & MOMENTUM SIGNALS — INSTITUTIONAL CONFLUENCE ZONES
Tool Signal
VWAP Anchored VWAP tagged and respected — classic institution level
SMA50 Capped daily move (3,342) — still a long-term bearish lid
HMA5/9 Bullish crossover on 15m/1H – signals momentum alignment
Volume MA Volume climax confirms effort at lows, signaling phase change
🔩 VI. TECHNICAL SEQUENCING OF EVENTS (STEP BY STEP)
Asia Session: Tight range, price floats around VAL (3,282)
London Session: Fake breakdown to 3,258 – traps late shorts
NY Pre-News: Choppy price action within FRVP range
Macro News Drop: Megabar → -191K delta flush
Next Candle: Delta flips +21.2K → Absorption confirmed
Price Walks Up: Controlled bid to VWAP
End of Day: Distribution at VAH → price capped by VWAP band
💣 Final move = algorithmic mean reversion + VWAP auction completion
🧬 VII. ADVANCED ORDERFLOW INTERPRETATION
⚔️ MEGABAR (The Trap Setup):
Volume = 191K+
Delta = -191K (yep, full-on flush)
What happened?
→ Late shorts + stop runs + SL hunters got rekt.
→ Institutions absorbed, switched algo, and reversed.
🧱 FVRP (Fair Value Range Profile):
Defined by VAL (3,282.90) and VAH (3,294.90)
Institutions play inside this range for risk efficiency
They accumulate low and distribute high within it
🔄 Delta Rotation:
Delta Rotation = Shift from Negative Accumulation → Positive Distribution
Classic rotation confirms phase transition
🧠 VIII. INSTITUTIONAL OBJECTIVE (WHAT THEY WANTED)
Primary Goal: Create liquidity void below → Enter large long positions
Secondary Goal: Return to VWAP zone and unload
Tertiary Goal: Signal to market: "We're in control, stay out or get punished"
This is textbook Volume Profile Auction Theory in motion.
🎯 IX. HYPOTHETICAL TRADE SETUP (EDUCATIONAL PURPOSE ONLY)
🧾 Trade Plan: Institutional VWAP Reversion Play
Order Type: Buy Limit
Entry: 3,287.00
Stop Loss: 3,279.00 (below VAL & invalidation)
Take Profit: 3,300.00 (Super-VAH zone)
Confidence: 85%
R/R: 1:1.6
💡 Justification:
Entry at POC + SMA50 cluster
Stop below structural invalidation zone
Target near major supply
This is the exact playbooks funds run during reaccumulation rotations
🧠 X. EDUCATIONAL TAKEAWAY — WHAT YOU SHOULD LEARN
Volume is truth. If volume spikes at lows, it’s not weak hands — it’s smart money flipping.
VWAP is magnet. Everything mean-reverts back to VWAP in controlled auctions.
Delta tracks aggression. Sharp delta reversals = algorithm switch.
Megabar = signal. Huge candle + volume + delta = possible phase shift.
FRVP = roadmap. Price doesn’t move randomly — it moves to balance imbalances.
🔚 CONCLUSION — YESTERDAY’S LESSON
July 30, 2025 wasn’t just a bullish day — it was a textbook institutional deception-reversion cycle. If you understand:
How the news was used
How the megabar printed
How the volume clustered
How the VWAP held
… then you’re not trading blindly.
You’re trading with the damn architects of the market.