GOLD Analysis : SR Interchange , Reversal Zone + High Break🧠 Market Context & Structural Overview:
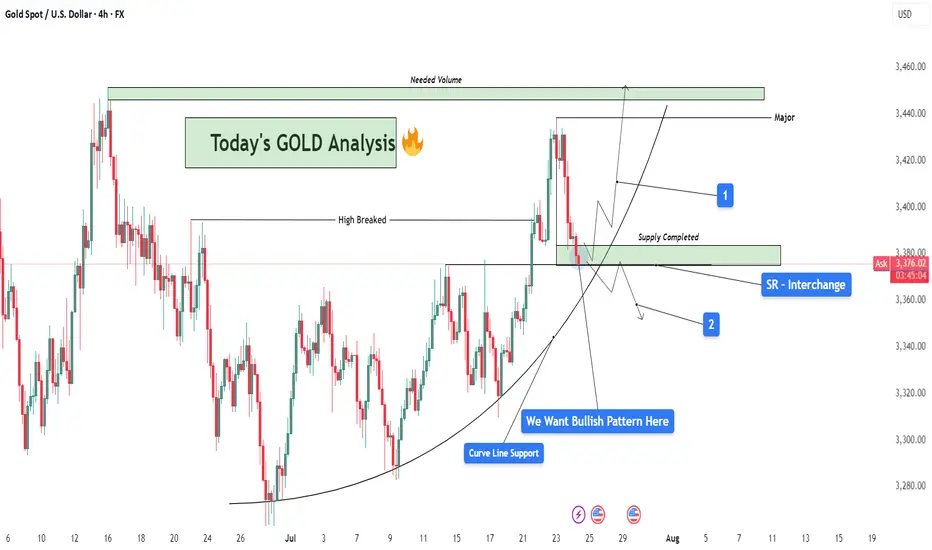
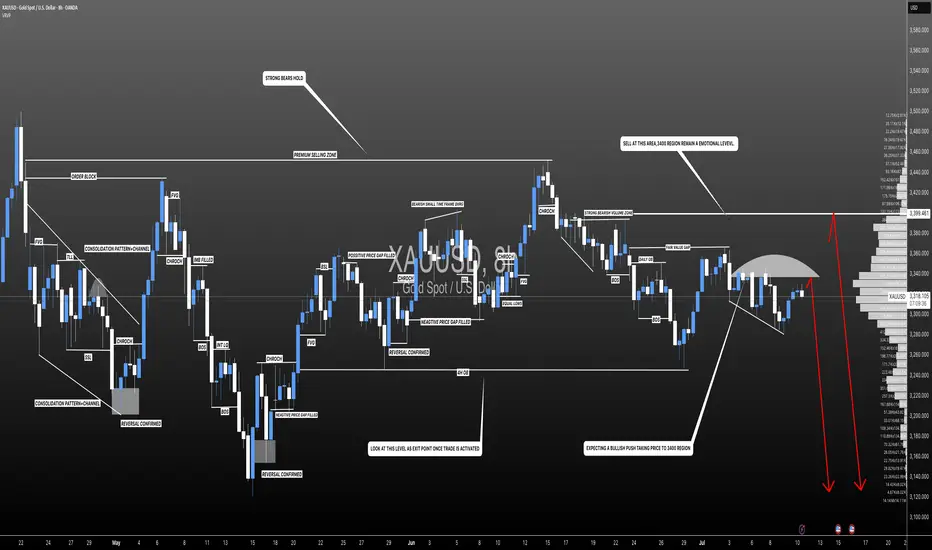
Gold has been trading within a clearly defined bullish structure after forming a rounded base pattern in early July, indicating accumulation by smart money. The market recently broke through a key horizontal resistance (previous swing high), marking a potential bullish continuation phase. However, we are now witnessing a pullback — a healthy corrective phase — that is currently testing multiple high-probability confluences.
🧱 Key Technical Zones Explained:
🔹 1. SR Interchange Zone – High Probability Reversal Area:
This area (roughly between $3,360 and $3,380) acted as previous resistance (supply) and has now flipped into support.
This is a textbook Support-Resistance Interchange (SR Flip) — a concept where prior resistance becomes new support.
Traders often look for entries here, especially when it aligns with other technical factors.
🔹 2. Curve Line Support – Dynamic Buyer Strength Indicator:
A curved trendline, often referred to as a parabolic support, has been respecting price structure for over two weeks.
Price is now sitting exactly on this support, signaling potential for another impulsive bullish leg if momentum builds.
🔹 3. Supply Zone Completed – Correction Phase Active:
The supply zone above (approx. $3,420–$3,440) has already been tapped and respected by the market.
This “completed” supply may now act as resistance unless broken with strong volume — we now watch how price reacts at the current pullback zone.
📊 What the Candles Are Telling Us:
The latest candles show some hesitation from sellers — wick rejections and smaller body candles hint at buyer interest at this level. However, confirmation is crucial. We want to see a bullish reversal pattern such as:
Bullish engulfing
Morning star
Pin bar (hammer)
Break and retest of minor resistance inside the SR zone
🔮 Scenarios to Watch:
✅ Scenario 1 – Bullish Continuation (Ideal Setup):
If a bullish reversal forms at this support zone:
Expect a potential rally back to the $3,420–$3,440 resistance area.
If this zone breaks with high volume, price could target the major supply zone near $3,465+, where we’ll need “Needed Volume” for a decisive break.
⚠️ Scenario 2 – Bearish Breakdown (Alternative View):
If the curve support and SR zone fail to hold:
Expect a drop towards $3,345 – $3,320 — where next structural support lies.
This would suggest a deeper retracement or range formation before bulls can regroup.
🧩 Strategy & Psychology:
“We want bullish pattern here.”
You’ve highlighted the importance of not entering impulsively. This is about trading with confirmation, not prediction. Waiting for a valid bullish pattern reduces risk and increases probability.
This is where smart traders win — waiting patiently for confirmation at a zone of confluence.
🧠 Learning Mindset – Why This Zone Matters:
Combines horizontal support, curved trendline, and broken structure retest.
This zone is the battleground between bulls and bears — whoever wins here will likely control short-term momentum.
Newer traders can study this as a classic example of multi-confluence trading, which combines price action, market structure, and dynamic trendlines.
GOLD trade ideas
GOLD - Strong Trendline & Golden Pocket ContinuationMarket Context
Gold is currently trading within a rising wedge structure on the 4-hour timeframe. This formation typically represents a tightening market, where buyers continue to push higher — but with decreasing momentum. The confluence of both trendlines and repeated Golden Pocket bounces makes this setup technically rich and worth watching closely.
Golden Pocket & Trendline Confluence
Throughout the recent move up, price has consistently reacted to the 0.618–0.65 Fibonacci retracement zone — often referred to as the Golden Pocket. Each major retracement has found support not only at this zone but also at a rising trendline, showing strong alignment between horizontal and diagonal demand. This dual-layer support has repeatedly led to sharp rebounds, reinforcing the bullish structure.
What Comes Next?
Price is currently sitting just below the upper resistance of the wedge. If history repeats, a retracement toward the lower trendline could be the next logical step. A reaction in the same region — where the Golden Pocket once again overlaps the trendline — could offer a high-probability long opportunity for continuation toward the top of the wedge or even a breakout.
Alternatively, if price breaks below the trendline with conviction, it could signal exhaustion in the current structure, potentially flipping the bias toward a broader correction.
Final Thoughts
This is a textbook example of how technical confluence can guide trade planning — especially in clean, trending environments like this. Remember: patience is key. Let the market come to your levels.
If you enjoyed this breakdown, a like would go a long way — and feel free to share your thoughts or ideas in the comments below!

XAUUSD--SHORT--second shoulder of "head and shoulder" pattern is about to form.
--next week, pullback to near to crossection point o two orange line, between levels 3369 and 3355
--then downward movement to the level 3283

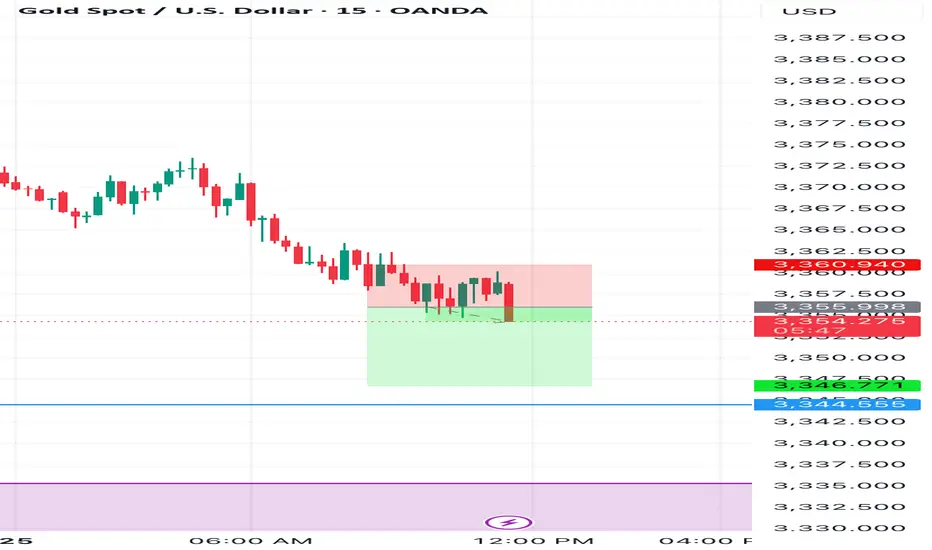
XAUUSD Analysis TodayHello traders, this is a complete multiple timeframe analysis of this pair. We see could find significant trading opportunities as per analysis upon price action confirmation we may take this trade. Smash the like button if you find value in this analysis and drop a comment if you have any questions or let me know which pair to cover in my next analysis

DeGRAM | GOLD will retest the channel boundary📊 Technical Analysis
● Fresh rejection at the blue resistance line (~3 435) pushed XAU back to the 3 355 mid-band, yet successive higher-lows (green arrows) keep price inside the May-origin rising channel.
● The pullback is probing 3 328-3 355 — confluence of the former flag roof and triangle top; holding this zone should launch another test of 3 400/3 435, with the channel crest targeting 3 500.
💡 Fundamental Analysis
● U-S S&P-Global PMIs softened, nudging 2-yr real yields to three-week lows, while cautious ECB rhetoric limits dollar gains — both supportive for gold.
✨ Summary
Long 3 328-3 355; above that aims 3 400 ➜ 3 435, stretch 3 500. Invalidate on an H4 close below 3 293.
-------------------
Share your opinion in the comments and support the idea with a like. Thanks for your support!

XAUUSD - Parabolic move ahead in GOLD.Gold currently at 3339 is retesting its trendline breakout, setting the stage for a potential move to $4,000 as momentum builds. I expect all metals, particularly precious ones, to perform strongly moving forward.
If you like this idea, do boost and share :)

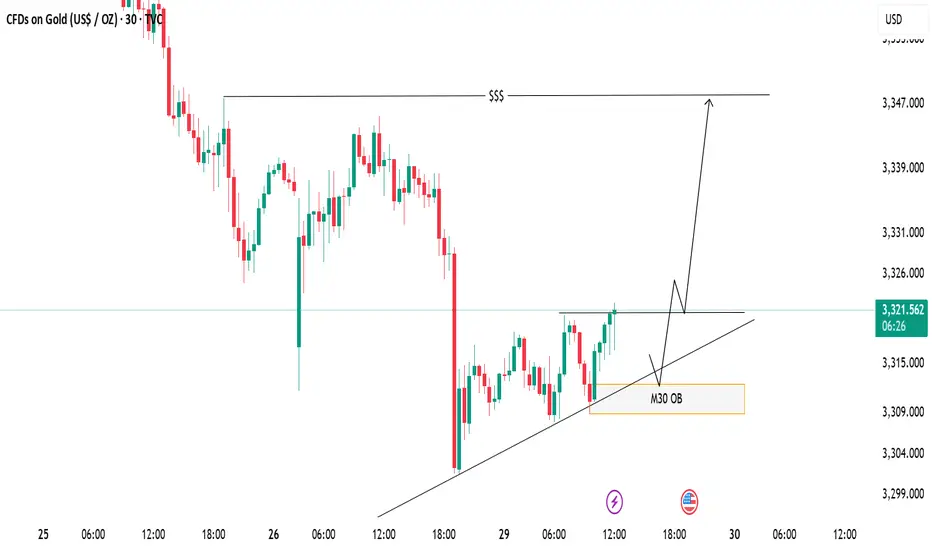
XAUUSD Eyeing Liquidity Grab – M30 OB Zone in PlayPrice is respecting the ascending trendline and consolidating near a key resistance level. A bullish breakout is expected, with a potential retest of the trendline and the M30 Order Block (OB) zone acting as a key demand area.
📈 Trade Plan:
Wait for a minor pullback into the OB and trendline confluence
Look for bullish confirmation to go long
Target the liquidity zone above (around 3347)
📌 A clean structure and bullish order flow hint at a continuation to the upside.
GOLD → Consolidation before the next jump to 3450?FX:XAUUSD continues to rally, with the price updating its local high to 3438 and moving into consolidation, possibly for another jump...
After hitting a five-week high of $3,438, traders are taking a break. Optimism is fuelled by Trump's statements about the largest deal with Japan and negotiations with Canada, but uncertainty about the details of the agreements and political instability in Japan are keeping caution in check. The market is waiting for further signals on trade and political issues, which remain key factors for gold.
Technically, the dollar continues to fall, which generally supports gold. But! Gold is approaching strong resistance at 3445-3450, where growth may be temporarily halted.
Resistance levels: 3433, 3446
Support levels: 3416, 3401, 3375
As part of a local correction, gold may test consolidation support or 0.5-0.7f before continuing to rise. There are quite a few orders in the 3433-3446 zone, and it will be difficult to break through this area to reach the target. Consolidation before this level may help the rise to continue.
Best regards, R. Linda!

Gold short-term bearish
From the Bollinger daily line, as shown in the figure below, the gold price should still test the lower track of $3,280 in the future. The short-term upward trend line has also been broken, and this yellow line has now become a pressure.
From the moving average system, the daily line is chaotic, and the gold price goes up and down without order and rules to cross the moving average, so the daily moving average system has no reference significance. From the weekly line, the gold price has the need to step back on the 20-week moving average of $3,277 to $3,280.
So, if I look at the bearish, I can only see $3,277 to $3,280. No deeper decline can be seen, and no more signals appear. Therefore, shorting is relatively short. Or it is short within the daily Bollinger track, not structural short or trend short. Everything has a law, just oscillation.
So, I think that even if there is a short in the future, it is the end of the short. It is the right way to stop when you see good results. Even though the current gold price has fallen due to the short-term positive tariff negotiations between Trump, Japan and the European Union, the tariff level is still much higher than before, which will undoubtedly bring more uncertainty to future economic growth. Many other factors are not conducive to a sharp drop in gold prices. The overall situation is that the basic trend of gold price increases is intact.
Therefore, the high point of $3345.30 has become the watershed between long and short positions. You can use this as the dividing line for long and short operations. There is nothing wrong with setting a loss above $3345.30 to short in batches. There is nothing wrong with placing a long position at 3346. The market trend is very uncertain, so it all depends on what order you want to make.

My plan for GoldShould we plan for a 600 pip profit on gold this week? I suggest you check the chart after withdrawing the liquidity shown.

GOLD BUY TRADE IDEA • Price Action Context:
• Recent bearish leg shows a clear shift from premium to discount territory.
• Market is approaching a higher timeframe demand zone around $3,277 – $3,299 (highlighted red zone).
• Notable inducement below recent lows suggests engineered liquidity to fuel a potential reversal.
• Current Market Structure:
• After a deep retracement, price is expected to tap into the discount zone, where institutional buy orders may be resting.
• Anticipated bullish reaction following a liquidity sweep of the lows and demand mitigation.
• Smart Money Flow:
• Inducement ➝ Liquidity Grab ➝ Demand Tap ➝ Bullish Reaction setup in play.
• Internal structure likely to shift bullish after a sweep, potentially forming a higher low and aiming for a BOS (Break of Structure) on the upside.
• Upside Target:
• Short-term target area: $3,360 – $3,380.
• Possible continuation toward premium if internal structure confirms strength.
🧠 Smart Money Narrative:
1. Induced sell-off below structure for liquidity collection.
2. Approaching major POI (Point of Interest) in discount.
3. Anticipated entry point for institutions to buy gold at value.
4. Reversal expected toward premium imbalance areas.

Daily gold analysisDaily gold analysis
Sell trade with target and stop loss as shown in the chart
The trend is down and we may see more drop in the coming period in the medium term
All the best, I hope for your participation in the analysis, and for any inquiries, please send in the comments.
He gave a signal from the strongest areas of entry, special recommendations, with a success rate of 95%, for any inquiry or request for analysis, contact me
GOLD Epic Trendline Breakout! Sell!
Hello,Traders!
GOLD was trading along
A long-term trend-line but
It is broken now and the
Breakout is confirmed so
We are bearish biased now
And we will be expecting a
Further bearish move down
Sell!
Comment and subscribe to help us grow!
Check out other forecasts below too!
Disclosure: I am part of Trade Nation's Influencer program and receive a monthly fee for using their TradingView charts in my analysis.

GOLD Melted , 2 Best Places To Sell Clear , Don`t Miss 200 Pips Here is My 30 Mins Gold Chart , and here is my opinion , we Again Below 3377.00 and we have a 30 Mins Candle closure below this strong res , so i`m waiting the price to go back and retest this res and new support and give me a good bearish price action to can enter a sell trade and we can targeting 200 pips , and we have a good res @ 3365.00 we can sell from it also if the price didn`t reach 3377.00 and targeting from 100:200 pips , and if we have a Daily Closure below This res this will increase the reasons for us , just wait the price to back a little to retest it and then we can sell it . if we have a daily closure aboveit this idea will not be valid anymore .

XAUUSD:Swing Sell Is Highly Likely! Get ReadyWe expect a smooth drop in gold prices, with prices potentially dropping around the 3250 area. Use Accurate Risk Management.
Please like and comment!
Team Setupsfx_
XAUUSD long day trade idea hello
day trading idea long up to 3372-3383 price zone
fibonaci levels , maybe 3390

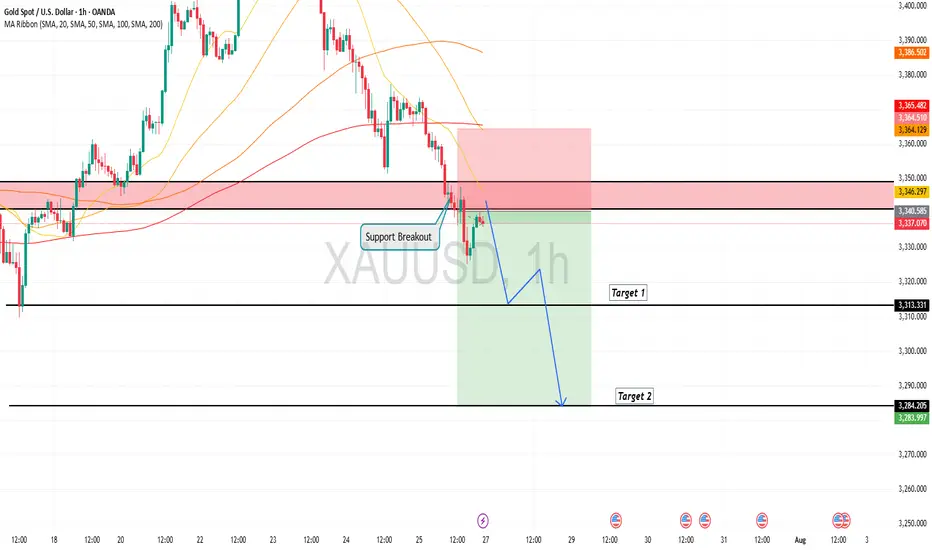
Gold is in the Bearish Direction after Breaking SupportHello Traders
In This Chart GOLD HOURLY Forex Forecast By FOREX PLANET
today Gold analysis 👆
🟢This Chart includes_ (GOLD market update)
🟢What is The Next Opportunity on GOLD Market
🟢how to Enter to the Valid Entry With Assurance Profit
This CHART is For Trader's that Want to Improve Their Technical Analysis Skills and Their Trading By Understanding How To Analyze The Market Using Multiple Timeframes and Understanding The Bigger Picture on the Charts

Gold 30Min Engaged ( Bearish Entry Detected )————-
➕ Objective: Precision Volume Execution
Time Frame: 30-Minute Warfare
Entry Protocol: Only after volume-verified breakout
🩸 Bearish From now Price : 3423
➗ Hanzo Protocol: Volume-Tiered Entry Authority
➕ Zone Activated: Dynamic market pressure detected.
The level isn’t just price — it’s a memory of where they moved size.
Volume is rising beneath the surface — not noise, but preparation.
🔥 Tactical Note:
We wait for the energy signature — when volume betrays intention.
The trap gets set. The weak follow. We execute.

Sell xauusdGold recently breaks it's buy trend and retested it
Now looking for sell on h4 chart
This current level not much good for buyers

Gold Analysis and Trading Strategy | July 28
✅ Fundamental Analysis:
🔹 The United States and the European Union have reached a significant trade agreement, setting a unified tariff rate at 15% (previously threatened at 30%). The EU has also pledged to invest an additional $600 billion in the U.S. and to purchase $750 billion worth of American energy and military equipment.
🔹 This agreement has significantly eased trade tensions between the U.S. and EU, boosting market risk appetite and sending U.S. stock markets to new record highs. As a result, capital has shifted away from safe-haven assets like gold, causing gold prices to drop to the $3320 level during the Asian session.
✅ Technical Analysis:
🔸 4-Hour Chart:
Since retreating from the 3438.77 high, gold has formed a clear descending channel. While the current candlestick shows some signs of stabilization near the lower Bollinger Band, the rebound has been weak and has yet to touch the middle band, suggesting the downtrend remains intact.
Moving averages are in a bearish alignment, with the MA5 crossing below the MA10, and price continues to trade below both—indicating ongoing bearish control.
If the price fails to reclaim the MA10 level around 3347, the structure will likely remain bearish, with further downside potential targeting the 3316 and 3309 support levels.
On the upside, the 3365–3380 zone represents key resistance. For the bulls to gain meaningful control, the price must break and hold above this area.
🔸 1-Hour Chart:
The overall trend remains bearish within a weak consolidation phase, with price hovering near the lower Bollinger Band.
Despite several attempts to rebound, gold has repeatedly failed to break above the 3350 level, which now acts as a key resistance line.
The Bollinger Bands have begun to flatten slightly, and if the price cannot hold above the 3345–3350 area, the risk of a renewed drop remains. Focus on the 3320–3317 support zone in the near term.
Overall, recent rebounds appear to be corrective in nature, and the 1-hour bearish structure remains unchanged.
🔴 Resistance Levels: 3345–3350 / 3365–3370
🟢 Support Levels: 3330–3325 / 3316–3309
✅ Trading Strategy Reference:
🔻 Short Position Strategy:
🔰Consider entering short positions in batches if gold rebounds to the 3350-3355 area. Target: 3330-3310;If support breaks, the move may extend to 3280.
🔺 Long Position Strategy:
🔰Consider entering long positions in batches if gold pulls back to the 3333-3338 area. Target: 3345-3355;If resistance breaks, the move may extend to 3365.
🔥Trading Reminder: Trading strategies are time-sensitive, and market conditions can change rapidly. Please adjust your trading plan based on real-time market conditions. If you have any questions or need one-on-one guidance, feel free to contact me🤝

Gold Market Outlook – 1H ChartGold (XAU/USD) continues to show bearish momentum with lower highs and consistent structural breakdowns. Price is currently consolidating just above a key support zone (~3315), forming a descending triangle pattern — often a bearish continuation signal.
If the support breaks, the next liquidity zones lie around 3270–3250, with a deeper target near 3225, as highlighted by the green demand areas. Fundamental catalysts ahead (as shown by US economic events) could act as triggers.

It still looks like a Triangle on goldHi traders,
Last week gold made an impulsive wave up but after that it dropped very hard.
If gold is still in a Triangle we could see a correction up and one more move down for wave E. But if price closes below (orange) wave C then the pattern is changed.
Let's see what price does and react.
Trade idea: Wait for the pattern to finish. Then wait for an impulsive move up and a small correction down on a lower timeframe and a change in orderflow to bullish to trade longs.
NOTE: The next three weeks I'm on holiday so I will not post any outlooks publicly.
If you want to learn more about trading FVG's & liquidity sweeps with wave analysis, please make sure to follow me.
This shared post is only my point of view on what could be the next move in this pair based on my technical analysis.
Don't be emotional, just trade your plan!
Eduwave

Gold is in the Bearish Direction after Breaking SupportHello Traders
In This Chart GOLD HOURLY Forex Forecast By FOREX PLANET
today Gold analysis 👆
🟢This Chart includes_ (GOLD market update)
🟢What is The Next Opportunity on GOLD Market
🟢how to Enter to the Valid Entry With Assurance Profit
This CHART is For Trader's that Want to Improve Their Technical Analysis Skills and Their Trading By Understanding How To Analyze The Market Using Multiple Timeframes and Understanding The Bigger Picture on the Charts