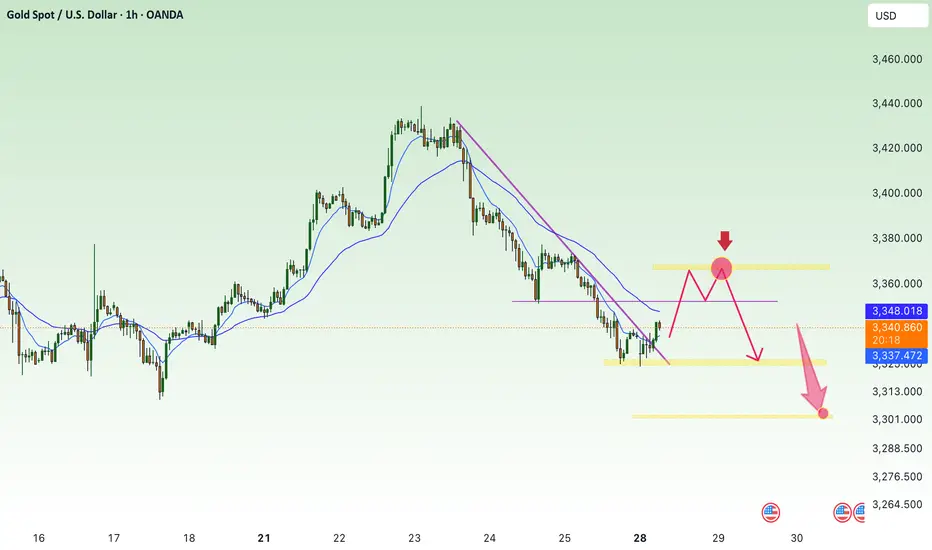
Get liquidity at the beginning of the week, continue to decrease⭐️GOLDEN INFORMATION:
Gold (XAU/USD) continues to lose ground, slipping to around $3,335 in early Asian trading on Monday. The metal is on its fourth straight day of declines as easing geopolitical tensions and trade progress weaken safe-haven demand. Investors are now turning their focus to the upcoming FOMC policy decision on Wednesday.
Market sentiment has improved following a breakthrough in US–EU trade talks, with both sides agreeing to a uniform 15% tariff on traded goods, effectively ending months of stalemate. The new tariffs will come into effect on August 1. Meanwhile, the US and China are reportedly planning to extend their tariff truce for another three months, according to the South China Morning Post. The renewed risk appetite continues to pressure gold, traditionally favored in times of uncertainty.
⭐️Personal comments NOVA:
Short-term recovery in Asian session, gold price takes liquidity and continues to accumulate below 3369
⭐️SET UP GOLD PRICE:
🔥SELL GOLD zone: 3369- 3371 SL 3376
TP1: $3360
TP2: $3350
TP3: $3340
🔥BUY GOLD zone: $3305-$3303 SL $3298
TP1: $3314
TP2: $3330
TP3: $3342
⭐️Technical analysis:
Based on technical indicators EMA 34, EMA89 and support resistance areas to set up a reasonable SELL order.
⭐️NOTE:
Note: Nova wishes traders to manage their capital well
- take the number of lots that match your capital
- Takeprofit equal to 4-6% of capital account
- Stoplose equal to 2-3% of capital account
GOLD trade ideas
GOLD ROUTE MAP UPDATEHey Everyone,
Another PIPTASTIC day on the charts with our analysis once again hitting gold!!!
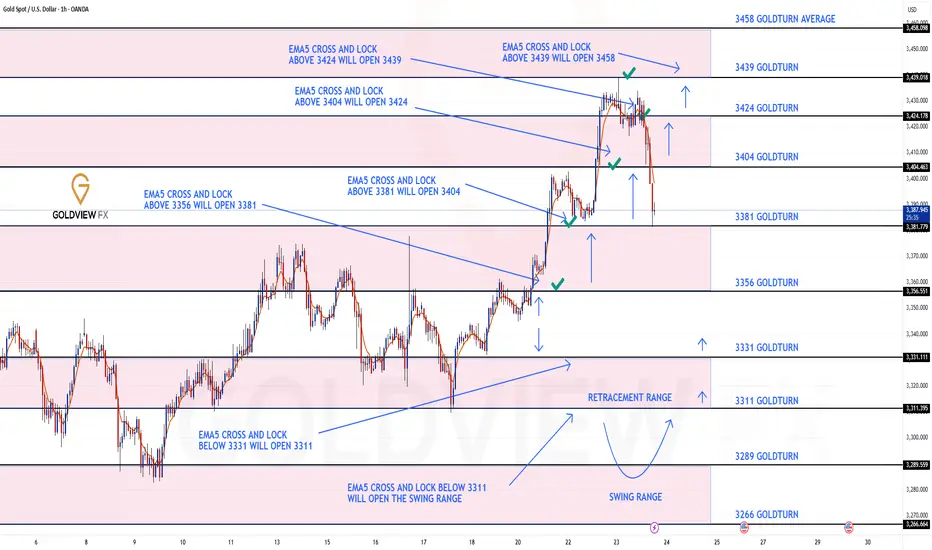
After completing all our bullish targets yesterday we stated that we will now look for EMA5 lock above 3424 to open the next bullish level at 3439.
- This played out perfectly completing 3439 to perfection!!
We are now seeing no further lock above 3439 confirming the rejection, which we are seeing now. We will now look for lower Goldturns to be tested for support and bounce inline with our plans to buy dips.
We will keep the above in mind when taking buys from dips. Our updated levels and weighted levels will allow us to track the movement down and then catch bounces up.
We will continue to buy dips using our support levels, taking 20 to 40 pips. As stated before, each of our level structures gives 20 to 40 pip bounces, which is enough for a nice entry and exit. If you backtest the levels we’ve shared every week for the past 24 months, you’ll see how effectively they were used to trade with or against short/mid-term swings and trends.
The swing ranges give bigger bounces than our weighted levels, that’s the difference between the two.
BULLISH TARGET
3356 - DONE
EMA5 CROSS AND LOCK ABOVE 3356 WILL OPEN THE FOLLOWING BULLISH TARGETS
3381 - DONE
EMA5 CROSS AND LOCK ABOVE 3381 WILL OPEN THE FOLLOWING BULLISH TARGET
3404 - DONE
EMA5 CROSS AND LOCK ABOVE 3404 WILL OPEN THE FOLLOWING BULLISH TARGET
3424 - DONE
EMA5 CROSS AND LOCK ABOVE 3424 WILL OPEN THE FOLLOWING BULLISH TARGET
3439 - DONE
EMA5 CROSS AND LOCK ABOVE 3439 WILL OPEN THE FOLLOWING BULLISH TARGET
3458
BEARISH TARGETS
3331
EMA5 CROSS AND LOCK BELOW 3331 WILL OPEN THE FOLLOWING BEARISH TARGET
3311
EMA5 CROSS AND LOCK BELOW 3311 WILL OPEN THE SWING RANGE
3289
3266
As always, we will keep you all updated with regular updates throughout the week and how we manage the active ideas and setups. Thank you all for your likes, comments and follows, we really appreciate it!
Mr Gold
GoldViewFX
GOLD Epic Trendline Breakout! Sell!
Hello,Traders!
GOLD was trading along
A long-term trend-line but
It is broken now and the
Breakout is confirmed so
We are bearish biased now
And we will be expecting a
Further bearish move down
Sell!
Comment and subscribe to help us grow!
Check out other forecasts below too!
Disclosure: I am part of Trade Nation's Influencer program and receive a monthly fee for using their TradingView charts in my analysis.

GOLD Weekly Idea💡Why Gold Pulled Back
- Gold pulled back today after hitting $3439.04, just below resistance at $3451.53. Traders took profits ahead of key Fed and trade headlines. Right now, it’s trading around $3414.48, down 0.50%.
- The dip came after the U.S.-Japan trade deal eased geopolitical tension, cutting safe-haven demand. Plus, U.S. bond yields are climbing (10-year at 4.384%), which adds pressure on gold.
Support is building at $3374.42, with stronger buying interest expected around $3347.97 and the 50-day moving average at $3336.40 — a key level bulls want to defend.
Short-term looks a bit weak, but as long as gold holds above the 50-day MA, the bullish trend remains intact. Longer-term, weakness in the dollar, central bank gold buying, and concerns about Fed independence could push prices higher.
🔍Watching the Fed’s July 29–30 meeting next
Gold is in the Bearish Direction after Breaking SupportHello Traders
In This Chart GOLD HOURLY Forex Forecast By FOREX PLANET
today Gold analysis 👆
🟢This Chart includes_ (GOLD market update)
🟢What is The Next Opportunity on GOLD Market
🟢how to Enter to the Valid Entry With Assurance Profit
This CHART is For Trader's that Want to Improve Their Technical Analysis Skills and Their Trading By Understanding How To Analyze The Market Using Multiple Timeframes and Understanding The Bigger Picture on the Charts

Gold recently experienced a typical "suppression and release"Capital dynamics and sentiment modeling, found that the gold market has recently experienced a typical "suppression and release" type of reaction. After a period of sustained pressure on the emotional background, the dominant force of the short side began to weaken, and both long and short sentiment tends to be balanced, and the logic of gold as a safe-haven asset has been re-explored and recognized.
This type of trend is often non-explosive, but through the emotional layers of repair and structural slow reversal of the gradual unfolding. The current signal strength has reached the bearish threshold set by the system, with a certain operational feasibility.
It is recommended that traders try to follow up with a low percentage of positions, but still need to retain enough position space to cope with the possible continuation of fluctuations. The whole layout is mainly defensive and offensive, and it is appropriate to seek progress in a stable manner.

Gold intraday downside
Gold intraday: down trend, short position below 3335 with target 3296 and 3278. Long position 3274-3280.

XAUUSD ShortI am a beginner trader! This is just an analysis for educational purposes. I don't provide signals for trading.

Gold Analysis and Trading Strategy | July 28
✅ Fundamental Analysis:
🔹 The United States and the European Union have reached a significant trade agreement, setting a unified tariff rate at 15% (previously threatened at 30%). The EU has also pledged to invest an additional $600 billion in the U.S. and to purchase $750 billion worth of American energy and military equipment.
🔹 This agreement has significantly eased trade tensions between the U.S. and EU, boosting market risk appetite and sending U.S. stock markets to new record highs. As a result, capital has shifted away from safe-haven assets like gold, causing gold prices to drop to the $3320 level during the Asian session.
✅ Technical Analysis:
🔸 4-Hour Chart:
Since retreating from the 3438.77 high, gold has formed a clear descending channel. While the current candlestick shows some signs of stabilization near the lower Bollinger Band, the rebound has been weak and has yet to touch the middle band, suggesting the downtrend remains intact.
Moving averages are in a bearish alignment, with the MA5 crossing below the MA10, and price continues to trade below both—indicating ongoing bearish control.
If the price fails to reclaim the MA10 level around 3347, the structure will likely remain bearish, with further downside potential targeting the 3316 and 3309 support levels.
On the upside, the 3365–3380 zone represents key resistance. For the bulls to gain meaningful control, the price must break and hold above this area.
🔸 1-Hour Chart:
The overall trend remains bearish within a weak consolidation phase, with price hovering near the lower Bollinger Band.
Despite several attempts to rebound, gold has repeatedly failed to break above the 3350 level, which now acts as a key resistance line.
The Bollinger Bands have begun to flatten slightly, and if the price cannot hold above the 3345–3350 area, the risk of a renewed drop remains. Focus on the 3320–3317 support zone in the near term.
Overall, recent rebounds appear to be corrective in nature, and the 1-hour bearish structure remains unchanged.
🔴 Resistance Levels: 3345–3350 / 3365–3370
🟢 Support Levels: 3330–3325 / 3316–3309
✅ Trading Strategy Reference:
🔻 Short Position Strategy:
🔰Consider entering short positions in batches if gold rebounds to the 3350-3355 area. Target: 3330-3310;If support breaks, the move may extend to 3280.
🔺 Long Position Strategy:
🔰Consider entering long positions in batches if gold pulls back to the 3333-3338 area. Target: 3345-3355;If resistance breaks, the move may extend to 3365.
🔥Trading Reminder: Trading strategies are time-sensitive, and market conditions can change rapidly. Please adjust your trading plan based on real-time market conditions. If you have any questions or need one-on-one guidance, feel free to contact me🤝

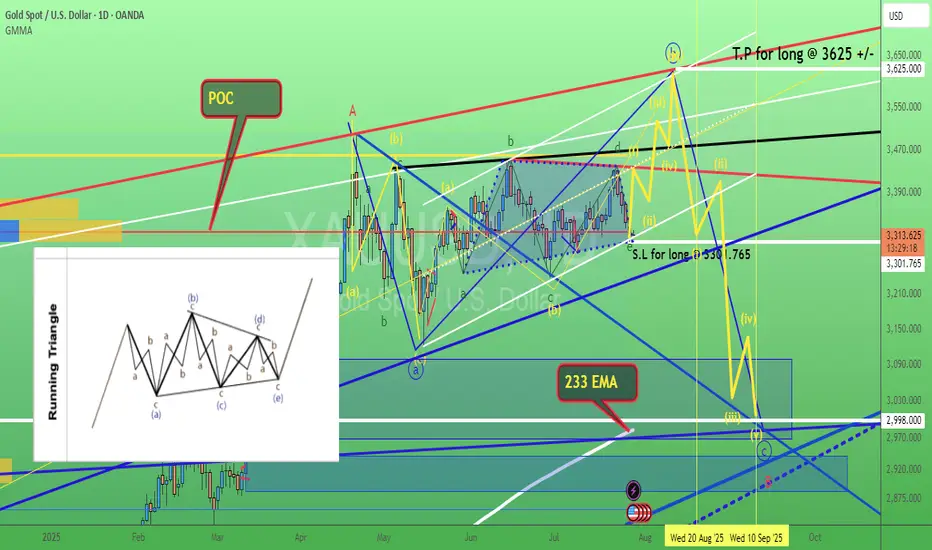
It still looks like a Triangle on goldHi traders,
Last week gold made an impulsive wave up but after that it dropped very hard.
If gold is still in a Triangle we could see a correction up and one more move down for wave E. But if price closes below (orange) wave C then the pattern is changed.
Let's see what price does and react.
Trade idea: Wait for the pattern to finish. Then wait for an impulsive move up and a small correction down on a lower timeframe and a change in orderflow to bullish to trade longs.
NOTE: The next three weeks I'm on holiday so I will not post any outlooks publicly.
If you want to learn more about trading FVG's & liquidity sweeps with wave analysis, please make sure to follow me.
This shared post is only my point of view on what could be the next move in this pair based on my technical analysis.
Don't be emotional, just trade your plan!
Eduwave

Gold – Bear-to-Bull Transition in Motion?🧠 MJTrading:
TVC:GOLD – 8H Chart: Bulls, It’s Your Move.
📸 Viewing Tip:
🛠️ Some layout elements may shift depending on your screen size.
🔗 View the fixed high-resolution chart here:
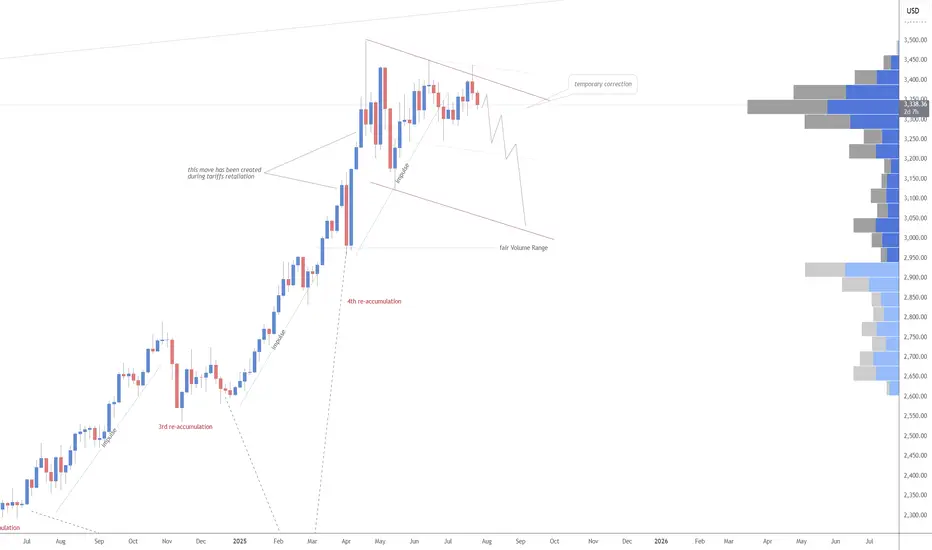
The impulsive move from 3000 to 3500 wasn’t just a trend — it was a statement of strength.
That rally carved the ATH, then left behind weeks of digestion and structural compression.
Now, the market may be setting up for its next decision.
Notice how each bearish leg has been shrinking — a classic behavioral signal that sellers are losing momentum — possibly a shift in control underway.
We’re also pressing above the downtrend line from the ATH (3500), while the uptrend from 3000 remains clean and respected.
We’re now testing the 3400 zone — a key battleground.
📍 If bulls want to reclaim the momentum and show dominance, this is the moment to act.
🔹 1st Support: 3363–3377
🔹 2nd Support: Rising trendline
🎯 Target Zone: 3455–3500+ (Liquidity Pool & ATH proximity)
⚠️ Break back inside the triangle could delay the breakout narrative.
⚠️ If momentum fails to increase from here, and bulls can’t break out with conviction, the market is likely to remain range-bound for longer — extending the sideways phase between 3250–3500.
💭 If you’re watching for a new ATH… stay sharp, stay structured — the market rewards patience and readiness.
“If the structure speaks to you, let it echo, boost it.”
📐 MJTrading 🚀
What do you think?
#GoldAnalysis #XAUUSD #MarketStructure #LiquiditySweep #AnythingCanHappen
#MJTrading
#ChartDesigner
Psychology Always Matters:
Click on them for the caption...

GOLD: Short Trade with Entry/SL/TP
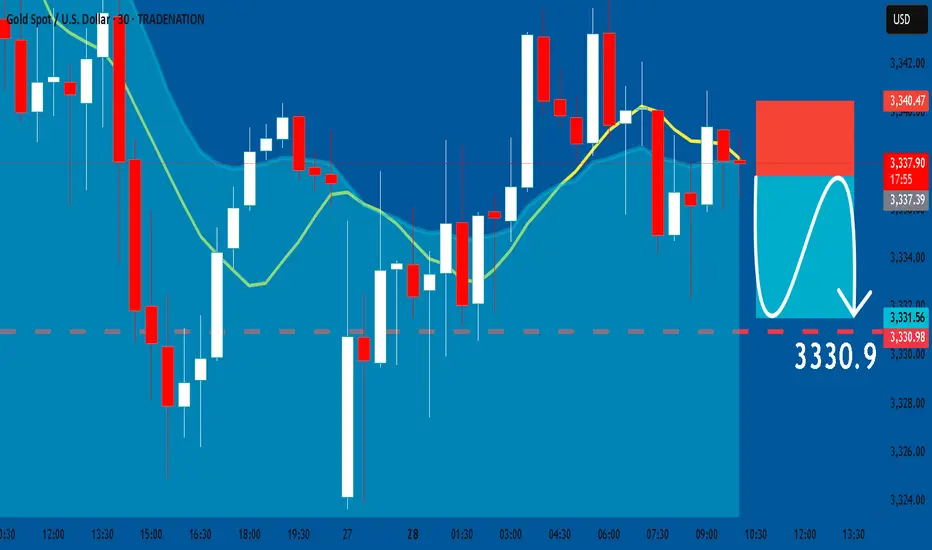
GOLD
- Classic bearish setup
- Our team expects bearish continuation
SUGGESTED TRADE:
Swing Trade
Short GOLD
Entry Point - 3337.3
Stop Loss - 3340.4
Take Profit - 3330.9
Our Risk - 1%
Start protection of your profits from lower levels
Disclosure: I am part of Trade Nation's Influencer program and receive a monthly fee for using their TradingView charts in my analysis.
❤️ Please, support our work with like & comment! ❤️
XauusdThe price enters the supply zone and the possibility of the gold price falling to the specified range


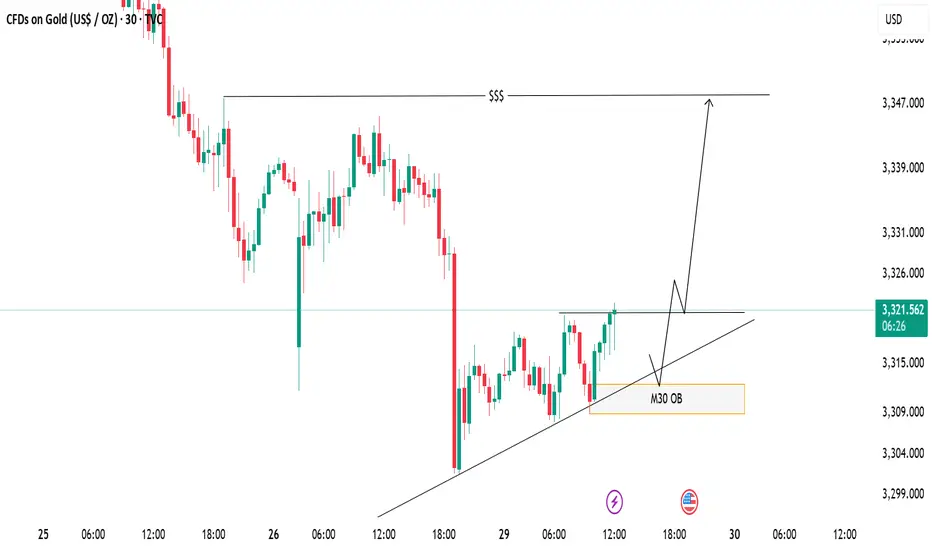
XAUUSD Eyeing Liquidity Grab – M30 OB Zone in PlayPrice is respecting the ascending trendline and consolidating near a key resistance level. A bullish breakout is expected, with a potential retest of the trendline and the M30 Order Block (OB) zone acting as a key demand area.
📈 Trade Plan:
Wait for a minor pullback into the OB and trendline confluence
Look for bullish confirmation to go long
Target the liquidity zone above (around 3347)
📌 A clean structure and bullish order flow hint at a continuation to the upside.
Is Smart Money Selling Gold? A VSA LookHey Traders,
Let's take a look at the Gold (XAU/USD) 1-hour chart using Volume Spread Analysis (VSA). The price made a strong run-up to a new high around $3,438, but the volume is telling us a story of potential weakness.
Here’s a simple breakdown of what I'm seeing.
The Trap at the Top (Signs of Weakness)
Think of the market as being moved by "smart money" (professionals) and "herd money" (the crowd).
Climax Volume: See that huge volume spike right at the peak on July 23rd? While it looks like strong buying, this is often a classic sign of a Buying Climax. This is where smart money starts selling their positions to the excited crowd who are buying at the top, fearing they'll miss out.
No Real Buyers Left: After the peak, notice how the price tried to push higher a few times but on much lower volume? This is a "No Demand" signal. It’s like a car trying to rev its engine, but it's out of gas. It shows there isn't enough buying power to push the price any higher.
Sellers Take Control: As the price started to fall from the top, look at the volume on the down bars. It got bigger. This tells us that supply (selling pressure) is now in control, and they are pushing the price down with force.
Where Are We Now?
The price has dropped and is now hovering around the $3,330 area. The volume has dried up for now, which means the market is taking a pause and deciding where to go next.
What to Watch For Next
Based on the VSA story, here are two possible scenarios:
Scenario 1 (Bearish 📉): The weakness continues. If we see the price try to rally from here but the volume is very low, it would be another major red flag. It would suggest sellers are still in control, and we could see a break below the recent low of $3,320 for another leg down.
Scenario 2 (Bullish 📈): This is a bear trap. For this to happen, we would need to see a strong sign of buying returning. For example, a sharp drop on massive volume that is quickly bought back up. This would signal that the sellers have been absorbed and smart money is starting to buy again.
Conclusion:
For now, the evidence points more towards weakness. The action at the top suggests that smart money was distributing (selling) their gold.
Key Takeaway: Be cautious of any weak-looking bounces. The sellers appear to have the upper hand until we see a clear sign of strength with high buying volume.
This is not financial advice. This is just my interpretation of the chart using VSA. Always do your own research and manage your risk. Good luck trading!

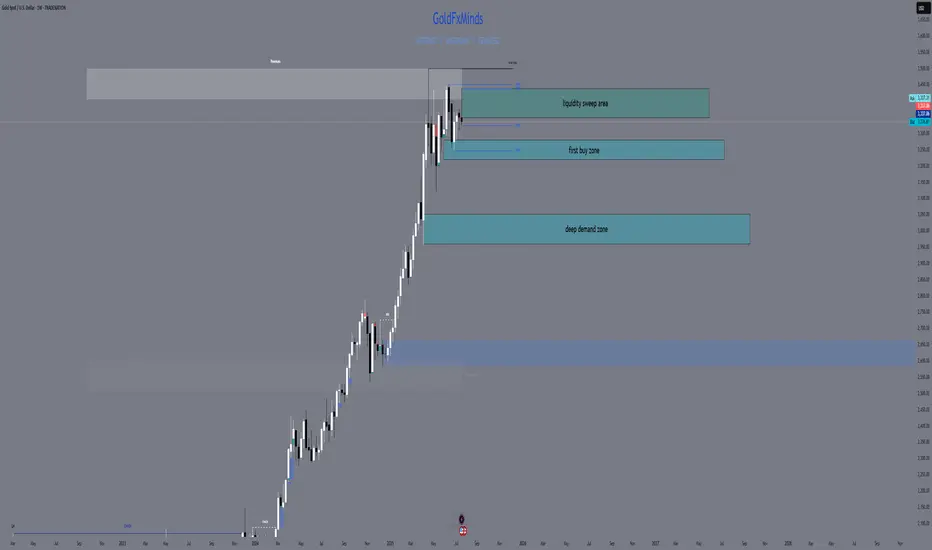
XAUUSD FULL WEEKLY STRUCTURE MAPHello traders! 🌟
We’re stepping into a pivotal week for gold (XAUUSD), and the weekly chart tells a story of tension, liquidity hunts, and potential big moves. Let’s dive into the three truly critical zones, backed by SMC/ICT logic, Fibonacci, EMAs, RSI, and fair‑value gaps — all in one elegant map. 🎨✨
🔹 HTF Overview & Macro Pulse
Current Price: 3336
Weekly Trend: Bullish overall, but momentum is fading as price coils under premium highs.
EMAs (5/21/50/200):
EMA5 & EMA21 are flattening beneath price, hinting at stall.
EMA50 sitting near 3120 as a deep support magnet.
RSI (Weekly): Cooling from ~75 down to ~66, showing bearish divergence vs those upper wicks.
Fair‑Value Gaps:
Unfilled 3365–3405 zone above — institutional imbalance still waiting.
Partially filled 3280–3320 below — common reaction pocket.
Fibonacci Extensions (1984 → 3365 high): 127.2% at 3405, 161.8% at 3439 — the exact top of our supply wick.
Macro Catalysts This Week
Wed (Jul 30): FOMC + Fed Statement
Thu (Jul 31): Core PCE + Unemployment Claims
Fri (Aug 1): NFP + ISM Manufacturing
Prepare for violent spikes into one of our zones — then trade the reaction.
🔸 The Three TRUE Weekly Zones
W1 Supply (Ultimate Wick Zone)
🔥 3350 – 3439
This entire wick from May–July is YOUR one and only supply zone on weekly.
Pure liquidity sweep area
Confluence: unfilled fair‑value gap, 127–161.8% Fib, RSI divergence
Every touch here is a short‑trap until we see a full weekly close above 3439.
W1 Demand (Primary Buy Zone)
🌊 3220 – 3285
The last robust order block & BOS base before gold ran vertical.
Confluence: filled FVG, weekly OB body, EMA21 target, RSI back at 50
Ideal sniper entry after a news‑driven sell‑off into this range.
Deep Discount Block
🛡️ 2960 – 3050
The origin of the full 2024–2025 bull trend — true institutional accumulation.
Confluence: March 2024 CHoCH base, EMA50/200 proximity, 78.6–88.6% Fib retrace
Only for a major quarterly reset; not on the immediate radar unless USD spikes dramatically.
🧭 Strategy & Execution
Short Bias: Wait for a liquidity spike into 3350–3439 (likely around FOMC/NFP), then watch for a clean rejection candle.
Long Bias: After a thrust down into 3220–3285, look for wick‑based rejection plus EMA21 hold and a bullish engulf on weekly.
Avoid the mid‑zone between 3285–3350 — that’s noise, not structure.
Patience is everything. Let price sweep, then let us strike. The real power trades this week will be born from clear structure — not guesswork.
💬 What’s your favorite zone to watch? Drop a comment below!
👍 Smash that like🚀🚀🚀 if you found this map helpful, and hit follow for more GoldFxMinds sniper blueprints.
Disclosure: Analysis based on Trade Nation’s TradingView feed. I’m part of their Influencer Program.
GoldFxMinds 💛
Gold. wave e (green) of triangle possible reached. 29/July/25XAUUSD based on speed of chart + confluence zone 1) Channel Support 2) POC of volume profile 3) Trendline support. Gold probably completed its wave e (green) of triangle.
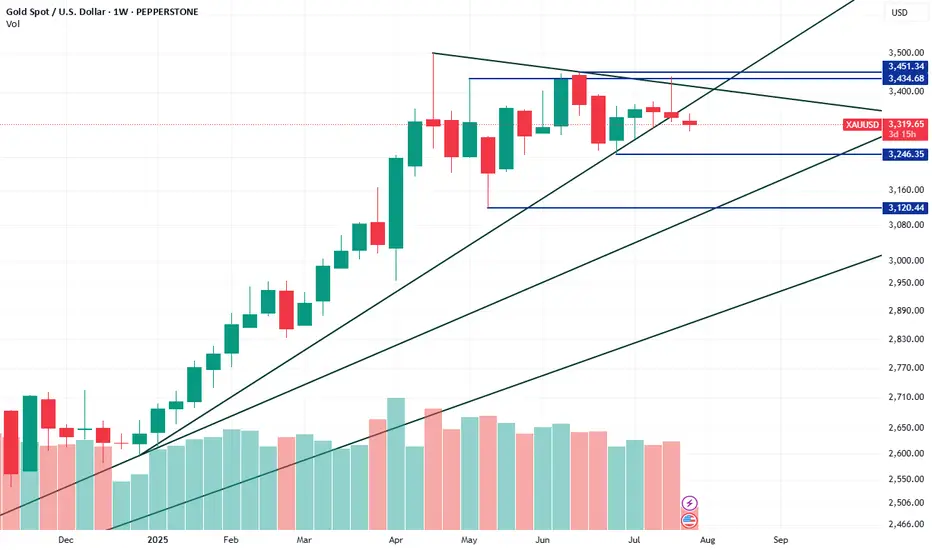
XAUUSD could potentially drop down to 3120XAUUSD has broken its most recent descending trendline on the Weekly chart, signaling a possible short-term reversal. It’s now approaching a higher-timeframe descending trendline, which could act as resistance. The next key demand zone is around 3246; if that fails, the more significant demand lies at 3120. Despite this pullback, the macro trend remains bullish. Notably, institutional traders increased their net long positions by over 40,000 contracts last week, bringing the total to more than 253,000, reflecting a potential shift in sentiment.
$XAUUSD: Macro InterconnectionsResearch Notes
Linking historic surface area and coordinates of consistent geometric expressions to document and learn more about the "texture" of self-organizing processes. The topology assumes that current price is a result of all history together that took to make the price end up where it is.
The fastest shortcut to figure out fractal hierarchy of waves and general direction is through Fractal wave marker .
Since angle of highs cycle is broken and price stayed above it for long time. That means it would be better to strip the chart starting from the lower levels, in order to get better coordinates for structural basis.
FWM helps to spot that distinctive part of broken waves that enables visual orientation in the rhythm. They manifest in its closest formative across cycles.
The angle that links the pattern through the time can have deterministic property, therefore we can use that direction for fibonacci channels to fill the gaps.
The fact that on log scale the bits from bullish phase of cycles contracted on price scale, I'd orientate with thin fibonacci channels (that is based on angle of lows of macro-cycle applied to previous ATH.
There are some other interconnection that are being tested.

Bullish or Bear trapHello Traders 👋
What are your thoughts on XAUUSD
Looking at the daily timeframe I anticipate manipulation by market players on gold.
Is likely that market players will stop Hunt Traders who have their stop losses at the different lows which is indicated with a red circle.
For every buyer there must be a seller and for every seller there must be a buyer.Where they are no sellers in the market the institutions will want to trigger stop losses in order to buy,which is known as stop hunting.That is to takeout previous buyers in the market and generate liquidity to buy.
And this stop hunting usually happens in a ranging market.
Looking at the structure of gold we can see that gold is ranging,
We can see a low or support of the range which was previously resistance and turned support for the ranging market.
I see the market using sell liquidity to liquidate buyers and react at the support or low of the range and move up to the range of the resistance

XAUSD We expecting this week the gold will be bearish becouse of the braking trend line and I wish you guys will took advantage of this and thank me latter

Gold Intraday Trading Plan 7/28/2025As explained in my weekly post, I am bearish on gold in short and medium term right now. Moreover, in smaller timeframe, the trendline has been broken. I am looking for selling opportunity from the retesting of the trendline, which is around 3352. My target for today is 3300, ultimate target for this week is 3252.
