XAUSD We expecting this week the gold will be bearish becouse of the braking trend line and I wish you guys will took advantage of this and thank me latter
GOLD trade ideas

Gold Intraday Trading Plan 7/28/2025As explained in my weekly post, I am bearish on gold in short and medium term right now. Moreover, in smaller timeframe, the trendline has been broken. I am looking for selling opportunity from the retesting of the trendline, which is around 3352. My target for today is 3300, ultimate target for this week is 3252.

XAUUSD | Bullish - Deep Liquidity Grab + OB MitigationPair: XAUUSD
Bias: Bullish
HTF Overview (4H):
Structure remains bullish, with continuation expected toward prior 4H highs. Last week’s strong bullish intent signaled Smart Money’s directional commitment. Price reached deeper to seek liquidity beneath major sell-side lows, setting the stage.
LTF Confirmation (30M):
Price cleanly mitigated a 30M order block resting just under the swept liquidity. This reinforces the bias, and I’ll now be watching for LTF confirmations once the market opens.
Entry Zone: Within or just above the 30M OB
Targets: 5M and 30M internal highs. Trailing targets will depend on how price delivers.
Mindset Note: Patience is key here. I’m waiting for clean confirmation before executing — no rush. The story is written. I just need the trigger.

$XAUUSD: Macro InterconnectionsResearch Notes
Linking historic surface area and coordinates of consistent geometric expressions to document and learn more about the "texture" of self-organizing processes. The topology assumes that current price is a result of all history together that took to make the price end up where it is.
The fastest shortcut to figure out fractal hierarchy of waves and general direction is through Fractal wave marker .
Since angle of highs cycle is broken and price stayed above it for long time. That means it would be better to strip the chart starting from the lower levels, in order to get better coordinates for structural basis.
FWM helps to spot that distinctive part of broken waves that enables visual orientation in the rhythm. They manifest in its closest formative across cycles.
The angle that links the pattern through the time can have deterministic property, therefore we can use that direction for fibonacci channels to fill the gaps.
The fact that on log scale the bits from bullish phase of cycles contracted on price scale, I'd orientate with thin fibonacci channels (that is based on angle of lows of macro-cycle applied to previous ATH.
There are some other interconnection that are being tested.

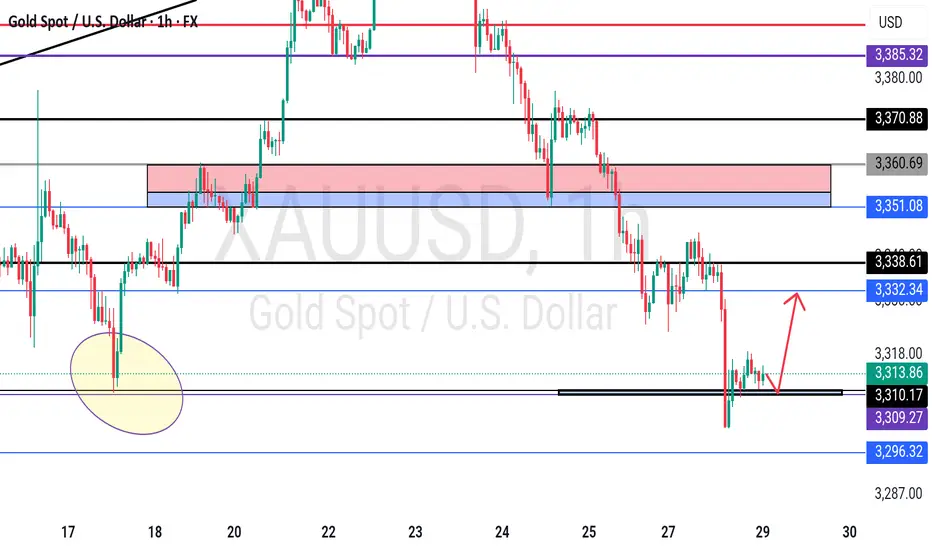
Gold (XAUUSD) Buy Setup – 30m Gold (XAUUSD) Buy Setup – 30m Chart
I am in a buy from 3307. Price is holding the support zone 3326–3334.
Looking for a bounce towards 3338 and 3375.
Stop loss below 3290.


"XAU/USD Gold Heist Plan | Pullback Entry for Big Bullish Move"🔐💰“GOLD HEIST PLAN UNLOCKED: Thief Trader’s XAU/USD Breakout Blueprint”💰🔐
by The Market Robber a.k.a. Thief Trader – Stealing Pips, One Candle at a Time!
🌍 Hey Money Makers, Market Hustlers, Robbers, & Chart Crackers! 🌍
Bonjour! Hola! Marhaba! Hallo! Ola! What's poppin'?
Welcome to another exclusive robbery plan crafted in pure Thief Trading style—built off technicals, fundamentals, market psychology, and a bit of outlaw intuition. 💸⚔️
This one’s for the GOLD DIGGERS – literally. We’re targeting XAU/USD for a high-voltage bullish heist 🎯💥. Stick to the plan, follow the chart, and you might just make it out with a sack full of pips 💰🔥.
🔓 THE SETUP: GET READY TO ROB THE GOLD MARKET
We're eyeing a LONG ENTRY, with clear intent to break past the consolidation zone and avoid the trap laid by the "market police" at the ATR barricade zone 🚨. This level is where overbought drama and bear claws are strongest – we slip in, grab the profits, and bounce before they know what hit ‘em.
🧠 Use caution: This level is filled with liquidity traps, reversals, fakeouts and retail bait zones. Classic Thief style means we know where the guards are sleeping and where the cameras don't reach. 🎥🔕
💸 ENTRY PLAN:
🟢 Entry Zone: Watch for a pullback to 3320.00 or above. Don’t jump early.
💡 Tactics:
Use Buy Limit Orders (DCA / Layered Entry Style)
Drop them in on 15min/30min swing levels – catch price slipping into liquidity
Confirm with minor structure breaks / order block retests
🔔 Set those alerts – the real move happens when the breakout candle hits.
🛑 STOP LOSS STRATEGY:
🧠 Pro Rule: No stop-loss before breakout.
Once breakout confirms:
🔴 SL Zone: Recent swing low (approx. 3280.00) on the 4H chart
🎯 Adjust SL based on:
Lot size
Order count
Risk appetite
You know the game: manage your risk like a pro thief—quiet, calculated, and fast on the getaway. 💨
🎯 TARGET ZONE:
🏁 TP Zone: 3490.00
⚠️ Escape earlier if the pressure gets heavy – smart thieves never overstay the job.
🧲 SCALP MODE:
Only scalp LONG SIDE – don’t get caught chasing shorts unless you're rich enough to burn your drawdown 🔥
🔐 Use trailing SL to secure bags while climbing the ladder.
🧠 FUNDAMENTALS & MACRO EDGE:
The Gold market is currently in a BEAR structure with hints of bullish reversal potential. This heist isn’t just technical – it’s backed by:
🌍 Global Macro Flows
💼 COT Reports
📰 Sentiment & News Risk
💣 Geo-political Heat
📊 Intermarket Analysis (Dollar, Yields, Risk-On/Off correlations)
Dig deep for the full macro breakdown. Knowledge is leverage.
(Find full reports on reputable sources — you know where to look 👀)
🚨 RISK ALERT:
Before, During & After News Releases:
Avoid fresh entries 🔕
Use Trailing SLs to protect live trades
Watch spread spikes & low-liquidity traps
👉 Don't trade when the market's drunk.
💖 SHOW LOVE – BOOST THE PLAN:
💥Smash that Boost Button💥 if you want more precision heist strategies like this. Support the Thief Trading Style, and we’ll keep robbing the markets clean and teaching the crew how to get in & get out profit-heavy. 🏴☠️📈💰
🎭 I’ll be back with another chart crime scene soon. Until then, stay sneaky, stay profitable, and always move like the market’s watching (because it is). 😎
🔐 Thief Trader Out. Rob. Exit. Repeat. 🔁💸

GOLD WILL BOUNCEHappy new week Families, Gold is expected to bounce back to the up side from my indicated buy zone. All the best of the week.

Gold Next Move Possible Hello Traders, Today I’m back with another idea.
As you know gold has changed the trend from bullish to the bearish.
The gold has fallen from the area 3438 to 3351. Now the current price is 3358.
I’m looking for the sell zone, In my view gold will drop till 3310.
I’m monitoring the sell zone 3364-3371, when the market touches the zone, I will add sell and my target will be 3310. Keep in bear my first target is 3351, second target is 3337 and the last target is 3310.
In the case if price breaks the 3377 area then we will have to wait until confirmation for another setup.
Stay Tune for every update.
Kindly share your ideas and leave positive comments. Thanks Everybody.

Gold Fails at Resistance, Elliott Wave Signals Deeper CorrectionGold ( OANDA:XAUUSD ) started to rise after the Richmond Manufacturing Index(Actual:-20/Forecast:-2/Previous-7) index was announced, but failed to break the upper line of the ascending channel and the Resistance zone($3,451-$3,406) .
Gold has now broken through the Support lines and is attempting to break through the next Support lines and Support zone($3,394-$3,366) .
In terms of Elliott Wave theory , it appears that the main wave Y has completed above the ascending channel.
I expect that given the momentum of gold's decline , gold will be able to break the Support zone($3,394-$3,366) and Support lines and fall to at least $3,356 . The next target could be the lower line of the ascending channel .
Note: Stop Loss (SL) = $3,423
Gold Analyze (XAUUSD), 1-hour time frame.
Be sure to follow the updated ideas.
Do not forget to put a Stop loss for your positions (For every position you want to open).
Please follow your strategy; this is just my idea, and I will gladly see your ideas in this post.
Please do not forget the ✅ ' like ' ✅ button 🙏😊 & Share it with your friends; thanks, and Trade safe.

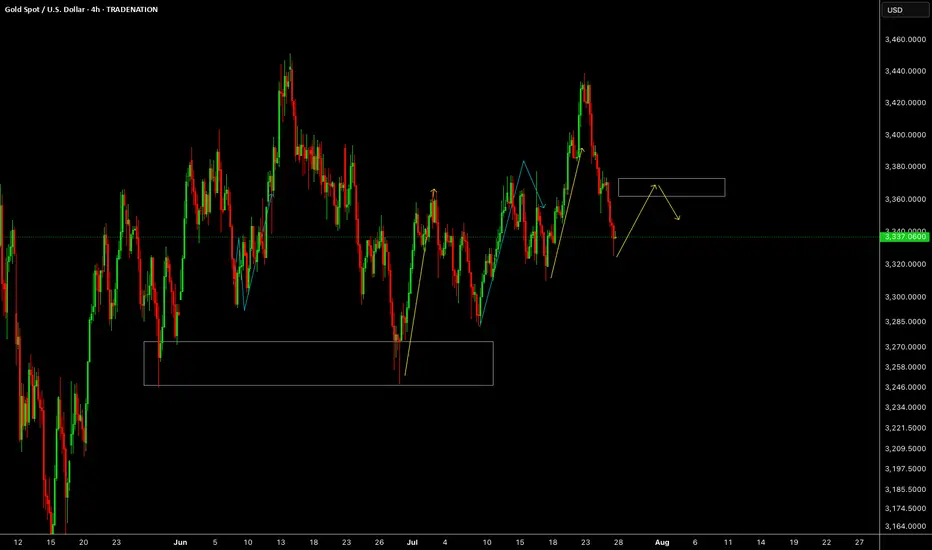
GOLDGOLD looks like it will be giving us correction or impulse up early part of this week. Reaction will be above 3360.
Disclosure: We are part of Trade Nation's Influencer program and receive a monthly fee for using their TradingView charts in our analysis.
Gold – Bear-to-Bull Transition in Motion?🧠 MJTrading:
TVC:GOLD – 8H Chart: Bulls, It’s Your Move.
📸 Viewing Tip:
🛠️ Some layout elements may shift depending on your screen size.
🔗 View the fixed high-resolution chart here:
The impulsive move from 3000 to 3500 wasn’t just a trend — it was a statement of strength.
That rally carved the ATH, then left behind weeks of digestion and structural compression.
Now, the market may be setting up for its next decision.
Notice how each bearish leg has been shrinking — a classic behavioral signal that sellers are losing momentum — possibly a shift in control underway.
We’re also pressing above the downtrend line from the ATH (3500), while the uptrend from 3000 remains clean and respected.
We’re now testing the 3400 zone — a key battleground.
📍 If bulls want to reclaim the momentum and show dominance, this is the moment to act.
🔹 1st Support: 3363–3377
🔹 2nd Support: Rising trendline
🎯 Target Zone: 3455–3500+ (Liquidity Pool & ATH proximity)
⚠️ Break back inside the triangle could delay the breakout narrative.
⚠️ If momentum fails to increase from here, and bulls can’t break out with conviction, the market is likely to remain range-bound for longer — extending the sideways phase between 3250–3500.
💭 If you’re watching for a new ATH… stay sharp, stay structured — the market rewards patience and readiness.
“If the structure speaks to you, let it echo, boost it.”
📐 MJTrading 🚀
What do you think?
#GoldAnalysis #XAUUSD #MarketStructure #LiquiditySweep #AnythingCanHappen
#MJTrading
#ChartDesigner
Psychology Always Matters:
Click on them for the caption...

GOLD - SHORT TO $2,880 (UPDATE)Beautiful melt overnight, with Gold down close to 400 PIPS so far. Zoom in to the left & you'll see I've also added in a trendline which sellers have now start taking out. Another strong confluence of sellers taking control.
I warned you all last night not to sleep on Gold. My Gold Fund investors are in deep profits😉

Gold Potential UpsidesHey Traders, in tomorrow's trading session we are monitoring XAUUSD for a buying opportunity around 3,320 zone, Gold is trading in an uptrend and currently is in a correction phase in which it is approaching the trend at 3,320 support and resistance area.
Trade safe, Joe.

GOLD SENDS CLEAR BEARISH SIGNALS|SHORT
GOLD SIGNAL
Trade Direction: short
Entry Level: 3,336.48
Target Level: 3,254.95
Stop Loss: 3,390.83
RISK PROFILE
Risk level: medium
Suggested risk: 1%
Timeframe: 1D
Disclosure: I am part of Trade Nation's Influencer program and receive a monthly fee for using their TradingView charts in my analysis.
✅LIKE AND COMMENT MY IDEAS✅

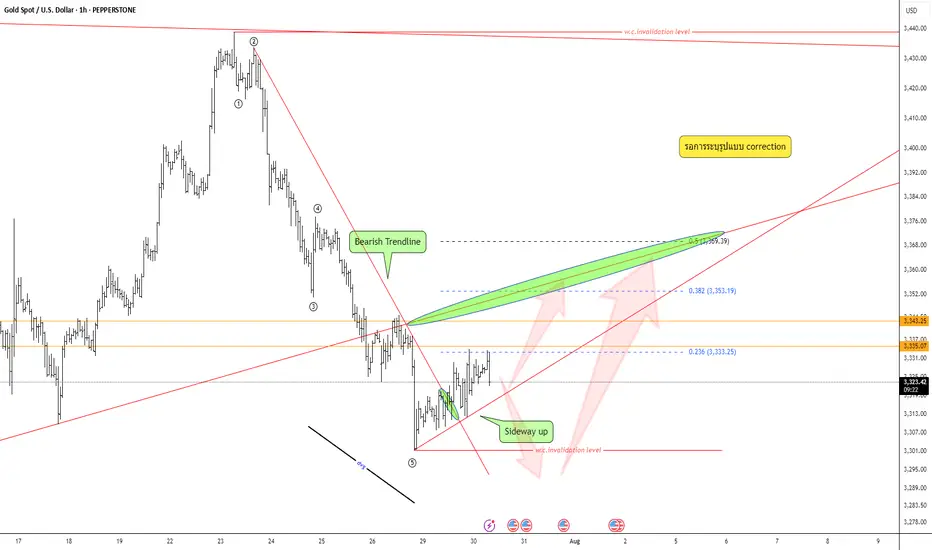
Keep an eye on the correction pattern —Quick Take:
- Strong bearish move, but wave structure still unclear — not a confirmed impulse.
- Bear trendline has broken; market now leaning toward sideways-up.
- Divergence is visible.
Plan:
Wait for correction pattern → confirm with your system → execute only with full data and strict risk management.
Simplified trading on gold. Buy low sell high.
Trend is your friend.. until it isn't.
Support is support until it is broken.
Resistance is resistance until it is broken.
Long from support, short at resistance.
Stop position and switch direction if S/R is broken.
Keep it simple, keep it together.

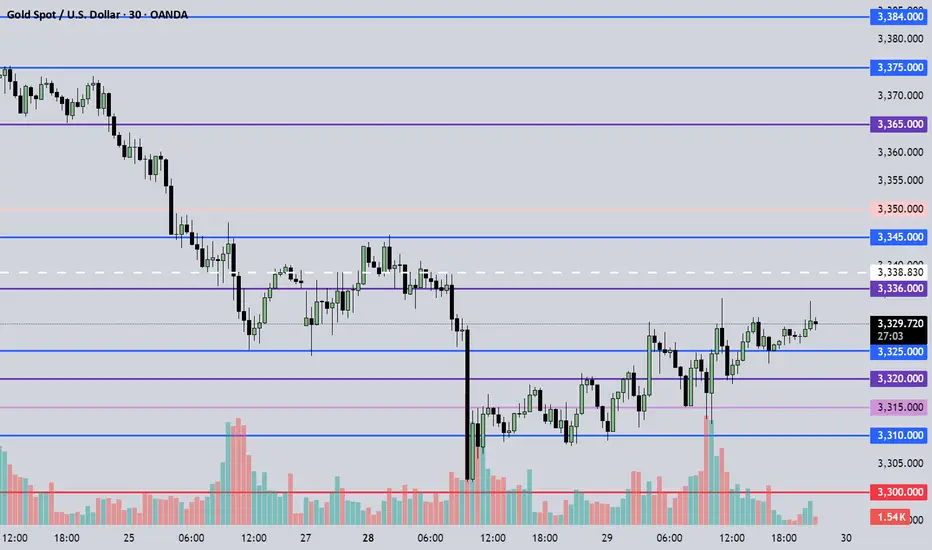
July 30, 2025 - XAUUSD GOLD Analysis and Potential Opportunity🔍 Key Levels to Watch:
• 3384 – Resistance
• 3375 – Key resistance
• 3365 – Resistance
• 3345 – Resistance
• 3336 – Resistance
• 3325 – Key support
• 3310 – Support
• 3300 – Psychological level
• 3283 – Major support
• 3275 – Support
• 3265 – Support
📈 Intraday Strategy:
• SELL if price breaks below 3325 → target 3320, then 3315, 3310, 3300
• BUY if price holds above 3330 → target 3336, then 3345, 3350, 3356
👉 If you find this helpful or traded using this plan, a like would mean a lot and keep me motivated. Thanks for the support!
Disclaimer: This is my personal view, not financial advice. Always use proper risk control.
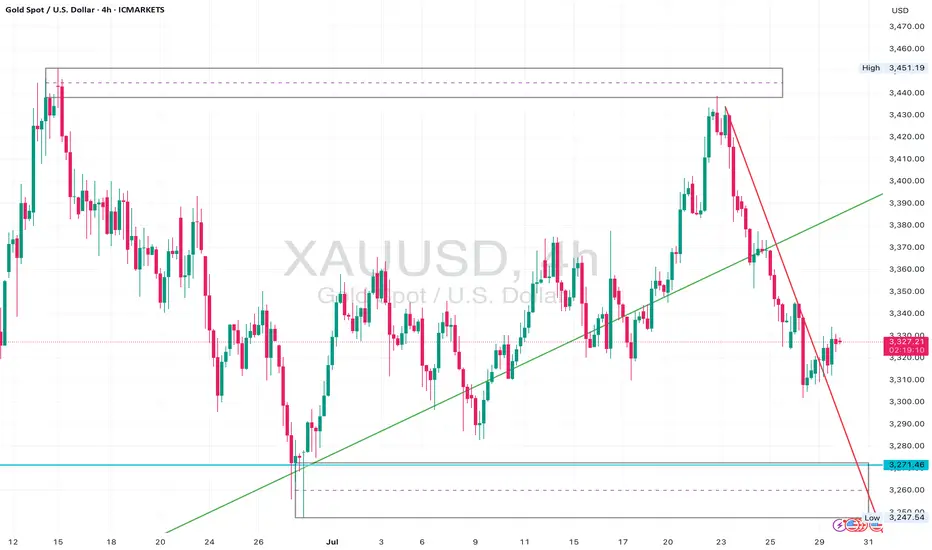
Gold Bear Flag Forming After Trendline Break – Short Setup BelowGold (XAUUSD) recently broke a major ascending trendline that had held since late June, leading to an aggressive sell-off from the $3,440s down to the $3,270 zone.
Following that, price is now consolidating just beneath the previous support trendline, forming what appears to be a bear flag or rising channel inside a corrective structure.
The $3,330–$3,340 zone is now acting as resistance, and price is struggling to close above this level.
The current structure suggests continuation to the downside, with clean space to revisit the $3,271 liquidity pool and potentially even sweep that low.
Watch for bearish confirmation below the current flag – especially if price prints a rejection wick or engulfing candle at the upper edge of the box.
⸻
Key Levels:
• Resistance: $3,330 – $3,340 (flag top + previous support turned resistance)
• Support: $3,271 zone, followed by $3,248 sweep potential
⸻
Trigger Criteria:
• Bearish rejection inside the flag (e.g. pin bar or engulfing)
• Break and retest of the flag bottom or horizontal support
⸻
Risk Note:
A clean break back above $3,350 and reclaim of the previous trendline would invalidate this idea short term and shift bias back to neutral/bullish.
XAUUSD Technical Analysis – Strong Bullish Move Expected XAUUSD Technical Analysis – Strong Bullish Move Expected from Support Zone
Date: July 29, 2025
Chart Type: Price Action | Smart Money Concept (SMC) | Volume Profile
🧠 Educational Breakdown:
1. Strong Support Zone (Demand Area):
Price has entered a clearly marked strong support zone around $3,270 - $3,292.
This zone has previously acted as a major demand level, where buyers stepped in to reverse bearish pressure.
High volume node from the Volume Profile on the left confirms significant historical interest in this price region.
2. BOS – Break of Structure:
Multiple Break of Structures (BOS) throughout the uptrend confirm bullish market intent.
The recent decline appears corrective, not impulsive, suggesting a potential bullish continuation.
3. Bullish Fair Value Gap (FVG):
A Bullish FVG is visible just above current price, acting as a magnet for price action.
This imbalance is often targeted before further market movement, supporting the idea of an upcoming bullish move.
4. Liquidity Grab Setup:
Price dipped into the support area likely to sweep liquidity (stop losses) before a reversal.
This is a common Smart Money trap, where institutional players grab liquidity before moving the market in the intended direction.
5. Target Zone:
A clear target is set around $3,418, aligning with previous highs and potential Buy-Side Liquidity.
The projected move represents a clean higher high, following the higher low formed at the support zone.
Confirmation: Wait for bullish engulfing or displacement candle on lower timeframe (M15-H1).
Volume Support: Look for rising volume during the reversal to confirm smart money participation.
📘 Conclusion:
Gold (XAUUSD) is showing a textbook bullish reversal setup from a high-demand zone. With strong structural support, fair value gap targeting, and buy-side liquidity above, the setup favors bullish continuation toward $3,418.

Smart Money Concepts (SMC)Positive aspects of the analysis:
1. Clear structural change (BOS and CHoCH):
A breakout of the previous bearish structure (Break of Structure) and a change in character (CHoCH) are evident, indicating an intention to change the trend.
2. Fake Out Identified:
The "fake out" toward the resistance zone is typical of liquidity traps designed to catch buyers before the actual decline. This provides institutional confluence for the short.
3. 15M block order + resistance zone:
Entry from a 15-minute OB, within a broader resistance zone. This strengthens the entry points, as there is a high probability of a bearish reaction there.
4. Mitigation of the previous 1H FVG:
The market has already mitigated the 1H Fair Value Gap, which generally indicates that the price no longer needs to rise further to balance this inefficiency.
5. Target in a logical zone (3,317):
Take profit placed just before a lower support zone. This is prudent, as many traders seek to close partial positions or exits before major support.

GOLD - One n Single Area, what's next??#GOLD... market just reached at his ultimate area as we discussed in our last week analysis and in Friday analysis as well.
The area is 3309-10
Keep close and don't be lazy here.
NOTE: we will go for cut n reverse below 3309 in confirmation.
Good luck
Trade wisley
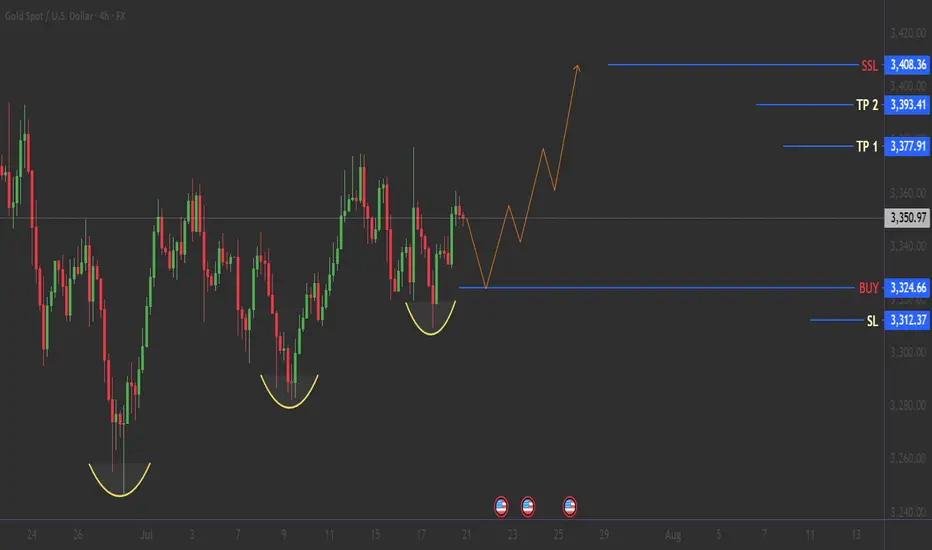
GOLD: Bullish Reversal Pattern Activated! 21/07/2025THE GOLDEN SETUP: Triple Bottom Masterpiece :
🟢 BULLISH BREAKOUT SETUP
🎯 BUY ZONE: $3,324 (Neckline Break)
🚀 TP1: $3,377
🚀 TP2: $3,393
🚀 LAST TP : $3,408
Stop Loss: $3,312 (Below recent low) 🚨
🌟 Before You Trade:
✅Wait for neckline break ($3,325+)🔥
✅Confirm with volume surge
✅Set stop loss below pattern ($3,312)
✅Calculate position size (max 2% risk)
--------------- N O T E ----------------
🚨 RISK MANAGEMENT 💡DYOR
Follow for more high-probability setups! 📊✨