Gold will drop like rain till 3250.Hello IGT FOLLOWER'S
Here is my gold overview, According to me Gold is currently facing resistance around the 3290–3310 zone. This setup anticipates a rejection from this area, with bearish momentum expected to push price downward. A break above 3310 would invalidate the setup, so risk management is key.
Key points:
Entry point: 3290
1st target : 3275
2nd target: 3250
Follow me for more latest updates and signals
GOLD trade ideas

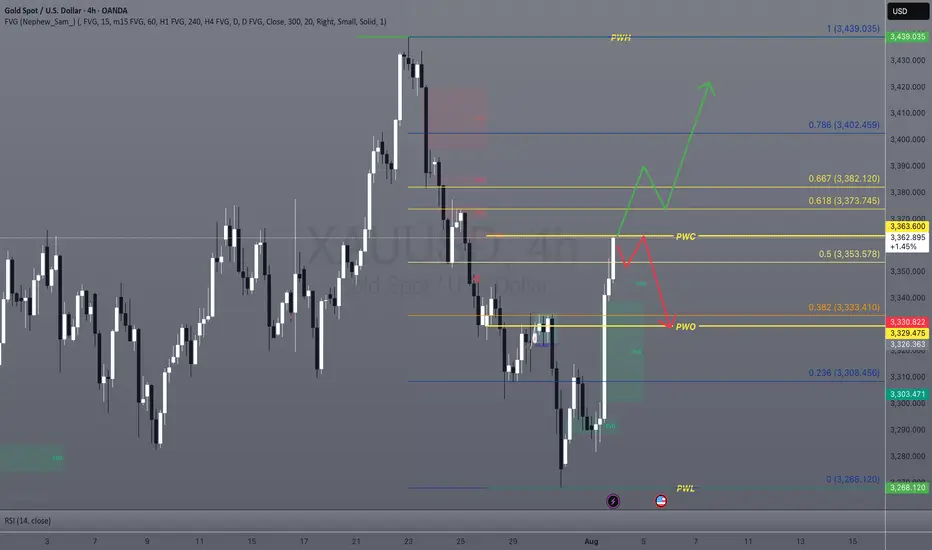
Gold is locked and loaded! A 4H breakout this week could unleashGold Analysis & Trading Plan – First Week of August
Overall Outlook:
Gold is currently consolidating between key levels. A breakout above resistance or a breakdown below support will determine the next move.
⸻
Bullish Scenario (LONG Setup)
• Condition: 4H candle closes above 3364
• Targets:
• First target: 3373
• Second target: 3382
• If 4H closes above 3382, extended targets will be:
• 3392
• 3400
• 3422
⸻
Bearish Scenario (SHORT Setup)
• Condition: 4H candle closes below 3353
• Targets:
• 3333
• 3329
• If 4H closes below 3329, extended targets will be:
• 3319
• 3313
• 3308
⸻
Key Notes
• Focus on intraday trading between these weekly levels as long as price remains within the range.
• Always apply strict risk management.
GOLD (XAUUSD): Very Bullish SetupGold experienced strong bullish momentum on Friday, breaking above a minor daily resistance with a confirmed Change of Character (CHoCH), suggesting a potential continuation of bullish trend.
Retesting the broken structure, the price formed a rising triangle on an hourly timeframe, with a breakout of its neckline serving as a strong intraday bullish signal.
I anticipate that the bullish trend will persist, targeting 3400.

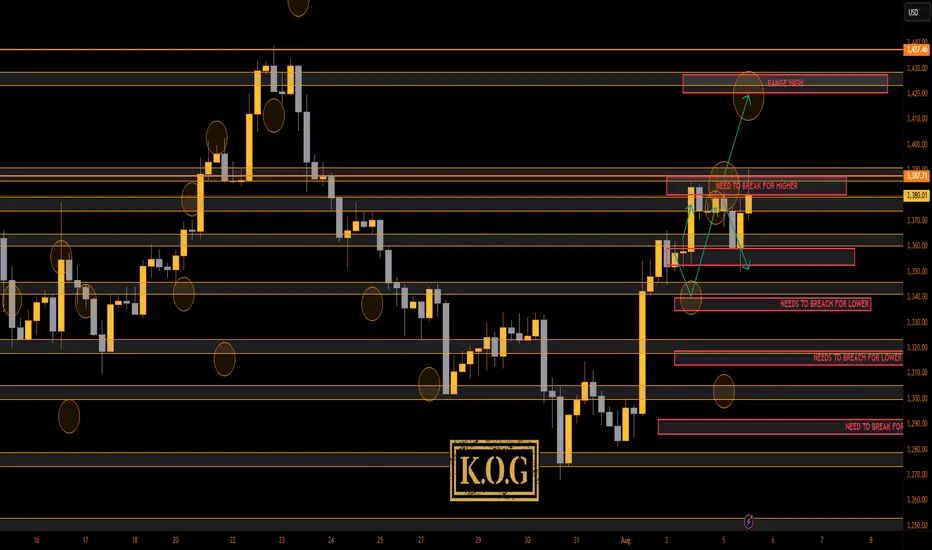
THE KOG REPORT - UpdateEnd of day update from us here at KOG:
What a mission with gold, swings one way, swing the other, taking liquidity within the range and yet sticking with the illustration posted. We managed to get the move upside, pin point short into the level we wanted and then a bounce from the 3350 level again! We had a target lower, but suggested we wait for the 3370-5 level which we weren't happy with and ultimately broke, only then to give us the long into the LiTE and Excalibur targets and to complete most of the red box targets.
We now have support here at the 3375 level with extension in 3368 which are the levels that need to hold us up, then break the red box and we can attempt the higher levels.
KOG’s bias for the week:
Bullish above 3340 with targets above 3370✅, 3373✅, 3379✅ and above that 3384✅
Bearish on break of 3340 with targets below 3330, 3320 and below that 3310
RED BOXES:
Break above 3365 for 3372✅, 3375✅, 3379✅, 3384✅ and 3390✅ in extension of the move
Break below 3350 for 3346, 3340, 3335 and 3330 in extension of the move
As always, trade safe.
KOG
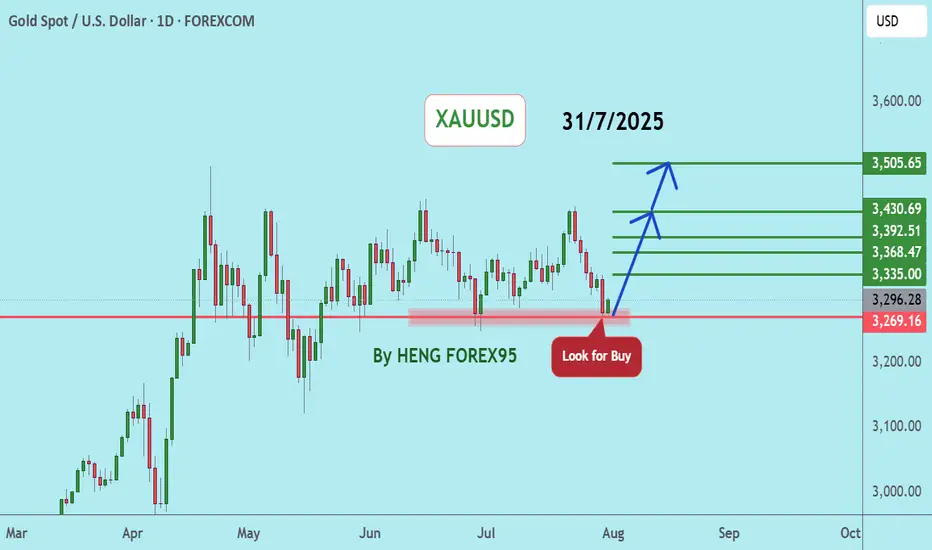
XAUUSDUpdate:
Gold Price Trend: As per our previous analysis on July 28, 2025, the price has now tested the support at 3,269. We expect that if the gold price can hold above 3,249, the gold price trend will remain bullish. We recommend considering buying in the red zone.
🔥Trading futures, forex, CFDs and stocks carries a risk of loss.
Please consider carefully whether such trading is suitable for you.
>>GooD Luck 😊
❤️ Like and subscribe to never miss a new idea!
Gold on the edge: Will 3,270 break as Fed pressure builds?Hello traders, what’s your view on XAUUSD?
Yesterday, gold remained under pressure as a series of fresh U.S. economic data reinforced expectations that the Federal Reserve will keep interest rates higher for longer. As a result, U.S. Treasury yields surged, the dollar strengthened, and gold came under renewed selling pressure. Currently, XAUUSD is trading around 3,288 USD, down 0.04% on the day.
From a technical standpoint, gold is clearly trading within a well-defined downward-sloping channel, confirming the dominance of bearish momentum. Moreover, both the EMA34 and EMA89 are acting as dynamic resistance levels, repeatedly rejecting any short-term recovery attempts—highlighting the strength of the current downtrend.
If a pullback occurs before the next leg lower, the confluence of resistance and the EMA zone will be crucial to watch. It could offer ideal conditions for potential short setups in line with the trend.
Looking ahead, the next key support lies at 3,270 USD. A break below this level could open the door for a deeper move toward the 32XX area.
What do you think? Will gold continue to drop further?
Good luck and trade safe!

Hellena | GOLD (4H): LONG to resistance area of 3448 (Wave 3).Dear colleagues, it seems that wave “2” has been formed and now we are seeing the development of wave ‘3’ of the higher order and wave “3” of the middle order.
I think we will see an update of the maximum of wave “1” at 3448.90. A slight correction to the support area of 3341.74 is possible, but there is also a possibility of a continuation of the upward movement without correction.
The target is the resistance area of 3448.
Manage your capital correctly and competently! Only enter trades based on reliable patterns!

IM EXPECTING GOLD TO COLLAPSEHere on the post, i shared my SAXO:XAUUSD sell analysis, for further details, see the content of the post. All the best.

GOLD (XAUUSD): Detailed Support & Resistance Analysis
Here is my fresh support & resistance analysis for Gold.
Vertical Structures
Vertical Resistance 1: Rising trend line
Horizontal Structures
Support 1: 3327 - 3344 area
Support 2: 3246 - 3275 area
Resistance 1: 3431 - 3451 area
The price is currently coiling on a trend line.
Your next bullish confirmation will be its breakout.
❤️Please, support my work with like, thank you!❤️
I am part of Trade Nation's Influencer program and receive a monthly fee for using their TradingView charts in my analysis.

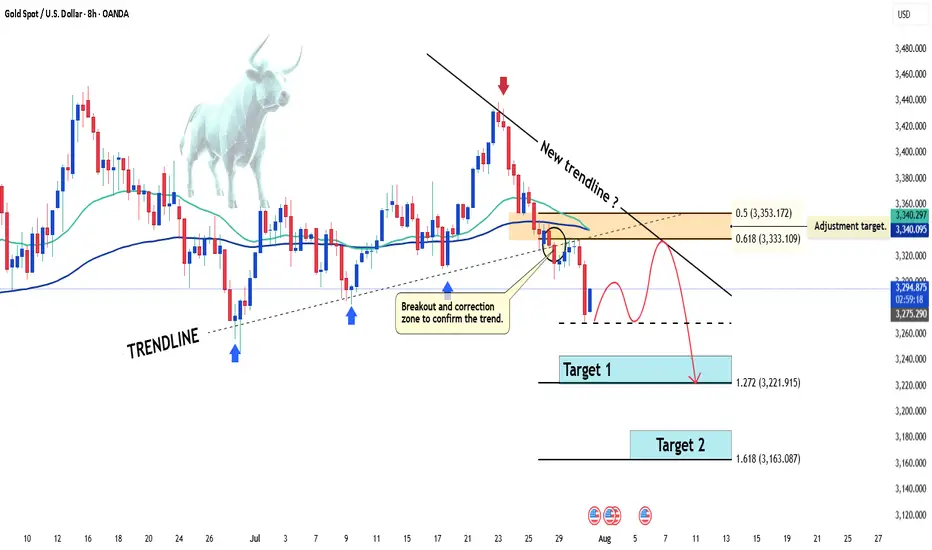
Gold price continues sharp declineHello everyone! Do you think gold will rise or fall? Let’s dive into the latest movements of this precious metal.
Just as we anticipated in yesterday’s strategy , gold has extended its downward move, with the bears firmly in control. The precious metal is currently trading around 3,290 USD, clearly signaling a short-term downtrend after breaking the ascending trendline that started in early July. Although there was a slight bounce, price remains capped below the key resistance zone of 3,333 – 3,350 USD, which coincides with the confluence of the 0.618 – 0.5 Fibonacci retracement and the EMA 34/89 — adding even more downside pressure.
The main reason behind this recent drop lies in the easing of trade tensions following the US-EU tariff agreement, which has significantly weakened gold’s safe-haven appeal. At the same time, the FOMC meeting yesterday failed to provide any bullish catalyst for gold. Even though the Fed is expected to keep rates unchanged, a single hawkish remark from Chair Powell was enough to intensify short-term selling pressure.
From a technical perspective, gold attempted to retest the broken trendline but failed, confirming the bearish structure. A new wave of correction could emerge soon, but the overall outlook remains tilted toward further downside.
My personal view:
Target 1 is at the 1.272 Fibonacci extension.
Target 2 lies at the 1.618 Fibonacci level — which could be the next destination.
And you — what do you think about this trendline break? Let’s discuss in the comments!
Gold Price Rebound Towards 3325 Target After Support TestGold (30-min chart) shows a recovery from the support zone (3288–3298) with potential bullish movement. Key resistance levels are 3305 and 3316, with a target zone around 3325.510. Price is expected to follow a corrective structure before possibly reaching the target.

Gold Alert: Key Levels for Potential Sell Setup!Good morning, my friends 🌞
Here’s today’s gold analysis. I'm expecting a decline in gold prices, specifically from the 3,383–3,420 level.
Once a correction starts around that zone, my target will be 3,310. Gold has been riding a strong uptrend, and if we reach those levels, I’ll be expecting a pullback and opening a sell position accordingly.
Please set your stop loss based on your personal margin preferences.
Your likes and support are my biggest motivation for continuing to share these analyses. Thank you to everyone showing appreciation 🙏

DeGRAM | GOLD broke the rising channel📊 Technical Analysis
● XAU printed a false break above the 3 400 wedge roof, then sliced back through the rising mid-channel, closing under the wedge base at 3 309 - a classic bull-trap that flips that band into resistance.
● Momentum has rolled over, and the break of July’s micro up-trend opens room to the broad triangle floor/May trend-pivot near 3 246; successive lower-highs since 24 Jul confirm bearish control.
💡 Fundamental Analysis
● Hot US Q2-GDP and sticky core-PCE lifted 2-yr yields to one-month highs, reviving the dollar bid, while cautious ECB guidance tempers euro gold demand.
✨ Summary
Sell 3 309-3 335; hold below 3 309 targets 3 246 ▶ 3 200. Invalidate on an H4 close above 3 366.
-------------------
Share your opinion in the comments and support the idea with a like. Thanks for your support!

XAUUSD breaks out – bullish bias returnsGold has bounced from the bottom of the descending channel, initiating a clear upward move with a series of strong bullish candles. On the H2 chart, price has broken above the upper boundary of the medium-term downtrend channel and filled the nearest fair value gap, signaling a resurgence in buying pressure.
Current price action is approaching a previous resistance zone, aligned with recent swing highs. The chart suggests a potential consolidation before further upside, provided that the current bullish structure remains intact.
From a macro perspective, while the stronger-than-expected U.S. PMI data supports the USD in the short term, weak labor market figures and ongoing global geopolitical tensions continue to fuel demand for gold as a safe-haven asset. This environment is helping sustain XAUUSD’s current recovery structure.

Bullish Sentiment Returns to Gold?Hello everyone, what are your thoughts on XAUUSD?
From a technical perspective, XAUUSD has just retested its long-term ascending trendline and formed a bullish reaction candle, suggesting that buying pressure may be returning.
Recently, a survey of 206 investors revealed that market sentiment remains optimistic, with 66% expecting gold prices to continue rising, 19% predicting a decline, and 15% anticipating a sideways market.
What do you think? Share your opinion in the comments!

XAUUSD (GOLD): Bullish Impulsive Move Up Friday! Wait For Buys!In this Weekly Market Forecast, we will analyze the Gold (XAUUSD) for the week of Aug 4 - 8th.
Gold is bullish on the Monthly, Neutral on the Weekly, Bullish on the Daily.
The aggressive move higher after bad job numbers caused a shift in the market from bearish to bullish on the D1 time frame.
Be wary of the pullback, as that move is likely to be corrected, but that would set up a great long opportunity!
Enjoy!
May profits be upon you.
Leave any questions or comments in the comment section.
I appreciate any feedback from my viewers!
Like and/or subscribe if you want more accurate analysis.
Thank you so much!
Disclaimer:
I do not provide personal investment advice and I am not a qualified licensed investment advisor.
All information found here, including any ideas, opinions, views, predictions, forecasts, commentaries, suggestions, expressed or implied herein, are for informational, entertainment or educational purposes only and should not be construed as personal investment advice. While the information provided is believed to be accurate, it may include errors or inaccuracies.
I will not and cannot be held liable for any actions you take as a result of anything you read here.
Conduct your own due diligence, or consult a licensed financial advisor or broker before making any and all investment decisions. Any investments, trades, speculations, or decisions made on the basis of any information found on this channel, expressed or implied herein, are committed at your own risk, financial or otherwise.

XUA/USD) Bearish Trend Read The captionSMC Trading point update
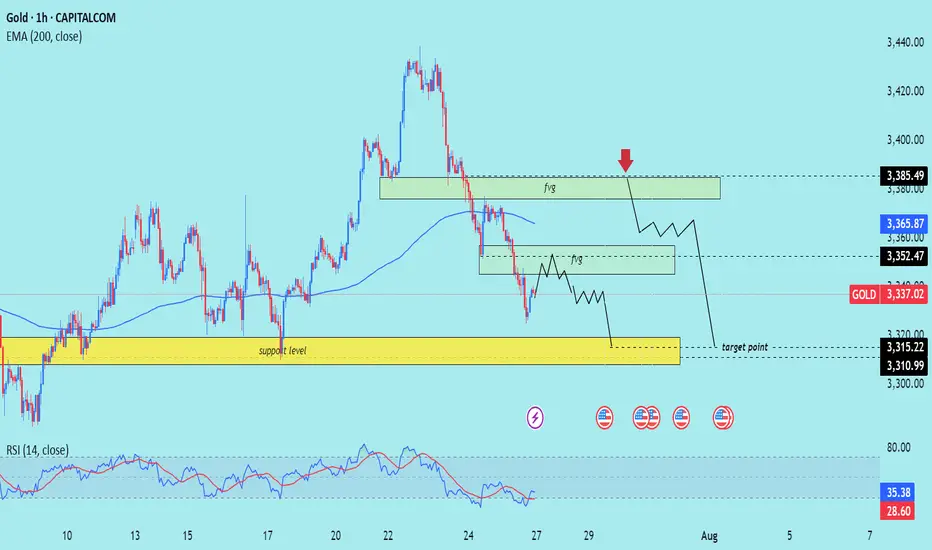
Technical analysis of (XAU/USD) on the 1-hour timeframe, targeting a move toward the $3,310–$3,315 support zone. Here's the full breakdown:
---
Technical Analysis – Gold (1H)
1. Fair Value Gap (FVG) Supply Zones
Two FVG supply zones are marked where price previously dropped sharply:
Upper FVG zone near $3,385.49 (with red arrow: expected rejection point)
Lower FVG zone near $3,352.47
Price is expected to reject from either zone, resuming the bearish move.
2. Market Structure: Lower Highs, Lower Lows
The chart shows a clear bearish structure, with consistent lower highs and lower lows.
The current price action suggests a potential pullback into FVG, followed by another leg down.
3. Key Support Zone (Target Area)
The yellow box between $3,315.22–$3,310.99 represents a strong demand/support zone and is marked as the target point.
This level has acted as a prior accumulation zone and is likely to attract buying interest again.
4. EMA 200 Resistance
Price is trading below the 200 EMA (currently at $3,365.87) — indicating a bearish bias.
EMA also aligns near the lower FVG zone, reinforcing the area as a potential reversal point.
5. RSI Indicator
RSI at 35.38 is nearing oversold territory but still shows downward pressure.
No divergence or reversal signal yet — supports the continuation view.
Mr SMC Trading point
---
Summary
Bias: Bearish
Current Price: $3,337.02
Supply Zones (FVG):
$3,385.49 (stronger supply)
$3,352.47 (minor supply)
Support Target: $3,315.22–$3,310.99
Structure: Bearish (LL-LH formation)
EMA: 200 EMA acting as dynamic resistance
RSI: 35.38 – still bearish momentum
---
Please support boost 🚀 this analysis)
XAUUSD Continuation fallowing PullbackGold is currently retesting the support zone and showing signs of potential upside movement. The market is reacting to expectations of Fed policy easing, which is supporting gold prices. Upcoming ISM PMI data is a key catalyst — stronger-than-expected figures could cause volatility.
Gold declined from the 3374 level, showing a false breakout to the downside.
Key support is forming around 3360 — if broken, a bearish trend may resume at 3342nIf the 1H candle closes above 3370, this could indicate renewed bullish momentum.
Resistance to watch: 3400 and 3420.
You May find more details in the chart.
Ps; Support with like and comments for better analysis.

Wait for a pullback and then test the previous high#XAUUSD
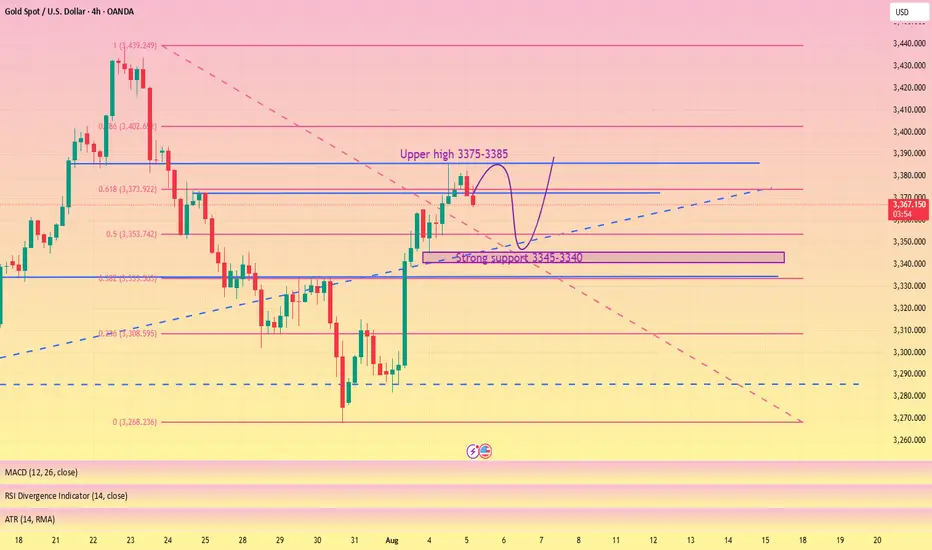
The gold market closed positively on the daily chart, with strong support near 3345-3340 below. The market trend is still dominated by bulls,🐂 but the daily moving average support is too far from the high point. It is not ruled out that it may retreat to the moving average support near 3345-3340,📊 and then rise again.🚀
From the monthly chart, 🌙although the monthly chart closed positive, the market is generally converging at a high level. Upper resistance remains, and a breakout is unlikely without breaking through this resistance level (no further discussion will be given).📉
Judging from the weekly chart, the Bollinger Bands have shrunk, and the MACD indicator has formed a death cross with large volume, indicating weak fluctuations at the weekly level.😩
Judging from the daily chart, 📊the current technical indicators are tending to the zero axis, and the rapid upward correction of the smart indicator indicates that the price fluctuation tends to rebound. The current focus is on yesterday's high around 3385. It is expected to break through 3430. The lower support Bollinger band middle track and moving average tend to stick together around 3346-3340.🌈
Judging from the hourly chart and 4H chart, 📊the overall rhythm tends to fluctuate and fall. The short-term pressure from above is around 3375-3385, and a break above will definitely lead to an increase.📈
On the whole, pay attention to yesterday's NY starting point near 3365-3360, and the strong support below is 3346-3340. The hourly and 4H charts tend to fluctuate and fall, so for short-term trading we need to short on rallies. 📉
Intraday trading suggestions are as follows:
1. Consider going long currently around 3365-3360📈, targeting 3374-3380🎯. If it breaks through, look for 3400.
2. Go long if it retraces below 3355-3340, targeting 3375-3385. Wait for further adjustments.🐂
3. If the price first reaches the resistance level of 3375-3385 and holds, consider going short with a small position and anticipate a pullback towards 3365-3355.🐻
GOLD is simply targeting 3600$ in next month In next few weeks the gold can see more rise and pump and we are looking for at least +10% here and targets like 3600$ are not anymore long-term targets and with this tension of war and ... soon that rise and even more will surprise us on the chart.
DISCLAIMER: ((trade based on your own decision))
<<press like👍 if you enjoy💚

XAUUSD-3336.40 — a key level bulls want to defend.Why Gold Pulled Back
- Gold pulled back today after hitting $3439.04, just below resistance at $3451.53. Traders took profits ahead of key Fed and trade headlines. Right now, it’s trading around $3414.48, down 0.50%.
- The dip came after the U.S.-Japan trade deal eased geopolitical tension, cutting safe-haven demand. Plus, U.S. bond yields are climbing (10-year at 4.384%), which adds pressure on gold.
Support is building at $3374.42, with stronger buying interest expected around $3347.97 and the 50-day moving average at $3336.40 — a key level bulls want to defend.
Short-term looks a bit weak, but as long as gold holds above the 50-day MA, the bullish trend remains intact. Longer-term, weakness in the dollar, central bank gold buying, and concerns about Fed independence could push prices higher.
Watching the Fed’s July 29–30 meeting next

Hellena | GOLD (4H): LONG to resistance area of 3440 (Wave V).As you can see, everything turned out to be more complicated than I had previously thought. We are dealing with a complex correction and a diagonal. I believe that the “ABCDE” waves, which make up the corrective wave “4”, are completing their levels, and I continue to expect the upward movement to continue.
The first area I expect is the resistance area of 3440. This will be the beginning of the large upward wave “V.”
Manage your capital correctly and competently! Only enter trades based on reliable patterns!

Is the market panicking over FOMC today?⭐️GOLDEN INFORMATION:
Gold (XAU/USD) fluctuates within a narrow range during the Asian session on Wednesday, showing only modest gains and losses as traders tread carefully ahead of the Federal Reserve’s policy announcement. The metal’s recent rebound from the $3,300 area faces hesitation, with investors awaiting clearer signals on the Fed’s rate-cut trajectory before committing to new positions. As such, attention remains firmly on the outcome of the two-day FOMC meeting, set to be released later today.
In the meantime, pre-Fed uncertainty is lending some support to the safe-haven appeal of gold. Additionally, a slight pullback in the U.S. Dollar—after hitting its highest level since June 23 on Tuesday—is providing a mild lift to the metal. However, expectations that the Fed will maintain elevated interest rates for an extended period are limiting the dollar’s decline and capping upside potential for the non-yielding yellow metal. Adding to the cautious mood, recent optimism on global trade also tempers bullish momentum in XAU/USD.
⭐️Personal comments NOVA:
slight recovery, not big before FOMC news. Gold price will still be under selling pressure when interest rate stays at 3300
⭐️SET UP GOLD PRICE:
🔥SELL GOLD zone: 3373- 3375 SL 3380
TP1: $3360
TP2: $3344
TP3: $3330
🔥BUY GOLD zone: $3283-$3281 SL $3276
TP1: $3295
TP2: $3307
TP3: $3320
⭐️Technical analysis:
Based on technical indicators EMA 34, EMA89 and support resistance areas to set up a reasonable SELL order.
⭐️NOTE:
Note: Nova wishes traders to manage their capital well
- take the number of lots that match your capital
- Takeprofit equal to 4-6% of capital account
- Stoplose equal to 2-3% of capital account
