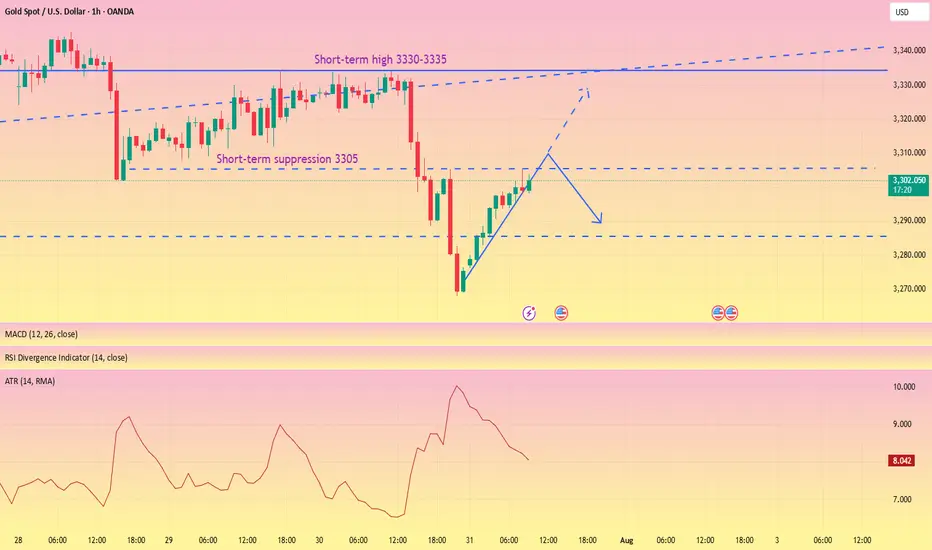
The rebound is weak, short orders intervene#XAUUSD
After two consecutive trading days of volatility, gold finally began to fall under pressure near 3335. After breaking through the 3300 mark, the price of gold accelerated its decline, reaching a low of around 3268, and yesterday's daily line closed with a large negative line. 📊
Today's rebound is more likely to be based on the buffering performance of the impact of news. The ATR data also shows that the bullish momentum is slowly weakening in the short term. 🐻After digesting the impact of yesterday's news through rebound during the day, it may fall again in the future.📉
📎The primary focus today is 3305 above, which was also the high point of yesterday's pullback correction. If the gold price rebounds to 3305-3320 and encounters resistance and pressure,📉 you can consider shorting and look towards 3290-3270.🎯
If the short-term gold rebound momentum is strong and breaks through the 3305-3320 resistance area, it will be necessary to stop loss in time. Gold may be expected to touch yesterday's high resistance of 3330-3335, which is the second point to consider shorting during the day.💡
🚀 SELL 3305-3320
🚀 TP 3290-3270
GOLD trade ideas
XAUUSD Expecting Selling Movement After retesting the zone, sellers stepped in again confirming Rejection Selling
Price is now breaking out of the pattern to the downside, signaling potential continuation
Targets
First Target: 3300
Second Target 3275
As long as price stays below the rejection zone, bearish momentum remains valid. Watch for volume confirmation and follow price structure closely

Risk Capacity: The Real Reason Traders Blow Accounts | Ep. 4In this pre-recorded video, I unpack one of the most overlooked reasons why traders blow their accounts over and over again, and it’s not about your system, strategy, or signal.
It’s about risk capacity, the internal threshold your nervous system can handle before fear, greed, or shutdown kicks in.
This is part of my ongoing series on YouTube “Rebuilding the Trader Within”, where I reflect on the emotional and psychological dimensions of trading that no indicator can fix.
If you've ever found yourself repeating the same mistakes, feeling stuck at the same equity level, or losing composure in high-stakes trades... this might be the pattern underneath it all.
I'm still learning too, and I’d love to hear your thoughts. Drop a comment — let’s grow together.
#RiskCapacity #TradingPsychology #TraderMindset #RebuildingTheTraderWithin #ForexMentorship #TraderGrowth #InnerWork #ForexPsychology

GOLD TRADING PLAN – Triangle Squeeze, All Eyes on NFP【XAU/USD】GOLD TRADING PLAN – Triangle Squeeze, All Eyes on NFP
Gold continues to trade within a large symmetrical triangle, tightening toward the end of its range. However, current candle structure shows clear bullish momentum, indicating the potential for a strong upside breakout.
🔍 Today’s Key Focus: Non-Farm Payrolls (NFP)
Market expectations are pointing to weaker-than-expected US economic data, which could trigger strong FOMO-buying for gold if confirmed. A poor NFP report would likely weaken the USD, supporting bullish continuation.
🔑 Strategy and Key Technical Levels:
Watch for a confirmed breakout above the descending trendline to trigger Wave 3 of the bullish structure.
CP ZONE + OBS BUY ZONE triggered yesterday already yielded 160+ pips profit.
Strategy: Prefer buy-the-dip entries. SELL setups only valid on strong resistance rejection. Avoid counter-trend trades near breakout zones.
🟩 BUY ZONE:
Entry: 3276 – 3274
Stop Loss: 3270
Take Profits:
3280, 3284, 3290, 3294, 3300, 3305, 3310, 3320, 3330, 3340, 3350
🟥 SELL ZONE:
Entry: 3339 – 3341
Stop Loss: 3345
Take Profits:
3335, 3330, 3325, 3320, 3315, 3310, 3305

GOLD Breakdown Setup | Clean Sell Targets Ahead!XAU/USD (Gold) Analysis – 2H Timeframe
After a clear rejection from higher levels, Gold has pulled back to retest the broken support zone around 3340–3350, which now acts as a resistance.
If the price sustains below this zone, we can expect a smooth move down toward clean liquidity areas below.
This is a textbook bearish continuation setup. 💥
🔻 Trade Idea – Short Setup:
• Sell Below: 3,340
• Target 1: 3,300
• Target 2: 3,280
• Stop Loss: 3,355 (above resistance zone)
🧠 Confluences:
• Bearish market structure
• Support zone retest
• Trend continuation
• High-impact USD news ahead (watch for volatility)
📅 Key Dates: July 30 – Aug 1
⚡ NY session could trigger the move!

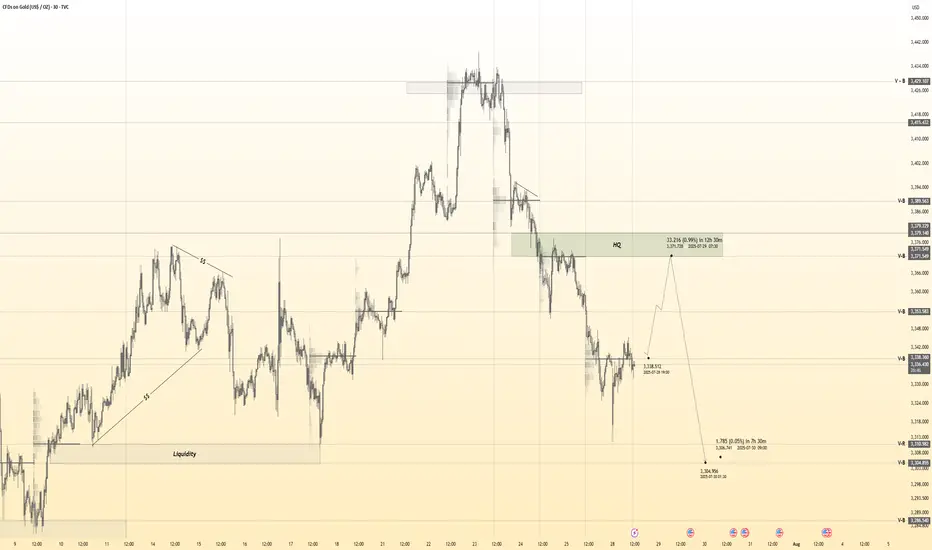
Gold 30Min Engaged ( Bullish After Break Out Entry Detected )———
Time Frame: 30-Minute Warfare
Entry Protocol: Only after volume-verified breakout
🩸Bullish Break - 3339
➗ Hanzo Protocol: Volume-Tiered Entry Authority
➕ Zone Activated: Dynamic market pressure detected.
The level isn’t just price — it’s a memory of where they moved size.
Volume is rising beneath the surface — not noise, but preparation.
🔥 Tactical Note:
We wait for the energy signature — when volume betrays intention.
The trap gets set. The weak follow. We execute.
GOLD falls on USD and trade talks, big data weekSpot OANDA:XAUUSD ended its rally this week on Friday (July 25) and closed down nearly 1%, mainly affected by the recovery of the US Dollar TVC:DXY and progress in trade negotiations that weakened safe-haven demand.
DXY recovered 0.27% on Friday to close at 97.642, ending a two-week low, making gold less attractive than its direct correlation.
Earlier, news of a US-Japan trade deal and a breakthrough in US-EU talks weakened the market's demand for safe-haven assets.
For the content of the US-Japan trade deal, readers can review it in the daily publications during the past trading week.
Data and Fed Expectations
The latest US jobless claims fell to a three-month low, suggesting the job market remains solid. This gives the Federal Reserve reason to maintain interest rates at 4.25%-4.50%, despite President Trump once again pressuring Powell to cut rates.
However, in the short term, the fundamental direction of gold may need to wait for the Federal Reserve to announce more policy signals at its meeting next week.
Speculative Longs Hit High Near April Peak
Data from the U.S. Commodity Futures Trading Commission (CFTC) showed that as of the week of July 22, the speculative net long position in COMEX gold rose by 27,211 lots to 170,868 lots, the highest level since April. This shows that as gold prices fall again, buyers are still actively deploying, waiting for more guidance from policy and data.
Last Week Review and This Week’s Fundamental Outlook
Last week, gold prices initially rose and then fell. Due to risk aversion and volatility in the US dollar, gold prices surpassed the $3,400/ounce mark at the start of the week, but as trade optimism increased and profit-taking emerged, gold prices fell back, trying to stay above $3,300/ounce.
Investors will face several major events this week:
Federal Reserve policy meeting (Wednesday): Markets expect interest rates to remain unchanged, but Powell’s speech could influence market expectations for a rate cut this year.
Macro data will be released in batches: including ADP employment data on Wednesday, PCE price index on Thursday and non-farm payrolls report on Friday. These data will determine the next move of gold.
Global central bank trends: The Bank of Canada and the Bank of Japan also hold policy meetings next week. Investors will be watching to see if their policy signals cause volatility in the US dollar and gold prices.
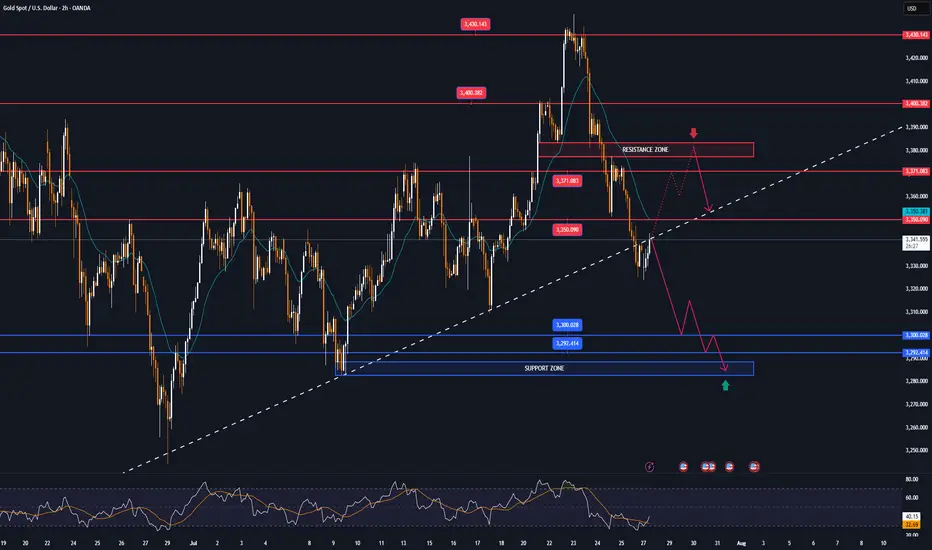
Technical Outlook Analysis OANDA:XAUUSD
On the daily chart, gold is in a rather important position after 3 consecutive corrective declines. However, the bearish momentum still keeps gold above the base price, which is an important psychological point for the bullish expectation of 3,300 USD.
In terms of position and indicators, gold has not completely lost the ability for a bullish outlook. Specifically, gold is still in a short-term rising channel and supported by the EMA21. On the other hand, it is still supported by the horizontal support level of 3,310 USD, followed by the psychological level of 3,300 USD and the 0.382% Fibonacci retracement.
Gold will only qualify for a bearish cycle if it sells below the 0.382% Fibonacci retracement level, then the target will be around 3,246 USD in the short term, more than the 0.50% Fibonacci level.
RSI is sloping down, but has not yet crossed the 50 level, and in the current case, the 50 level acts as a momentum support for the RSI. It shows that there is still room for an increase in price, and if RSI sloping up from 50, it will provide a bullish signal with relatively wide room.
If gold rises above the 0.236% Fibonacci retracement level (3,371 USD), it will be eligible for a new bullish cycle with a target of around 3,400 USD in the short term, more than 3,430 – 3,450 USD then the all-time high.
In the coming time, in terms of position and indicators, gold still has a technical outlook leaning more towards the upside and the notable points will be listed as follows.
Support: 3,310 – 3,300 – 3,292 USD
Resistance: 3,350 – 3,371 – 3,400 – 3,430 USD
SELL XAUUSD PRICE 3371 - 3369⚡️
↠↠ Stop Loss 3375
→Take Profit 1 3363
↨
→Take Profit 2 3357
BUY XAUUSD PRICE 3303 - 3305⚡️
↠↠ Stop Loss 3299
→Take Profit 1 3311
↨
→Take Profit 2 3317
Only look for BUY signal points in the current trend of Gold✏️The D1 candle closed with strong bullish force at the end of the day. The gold trend is still increasing wave 3 and there is no sign of correction. The reaction around 3385 in the Asian session this morning is being awaited to see if it is a recovery of Gold or not. The BUY strategy at important support zones is still maintained and pay attention to the price reaction of the candle.
📉 Key Levels
Support 3363-3346-3332
Resistance 3385 - 3407
Buy trigger: Confirmation of buying candle at support zones 3363-3346-3333
Target: 3400.00

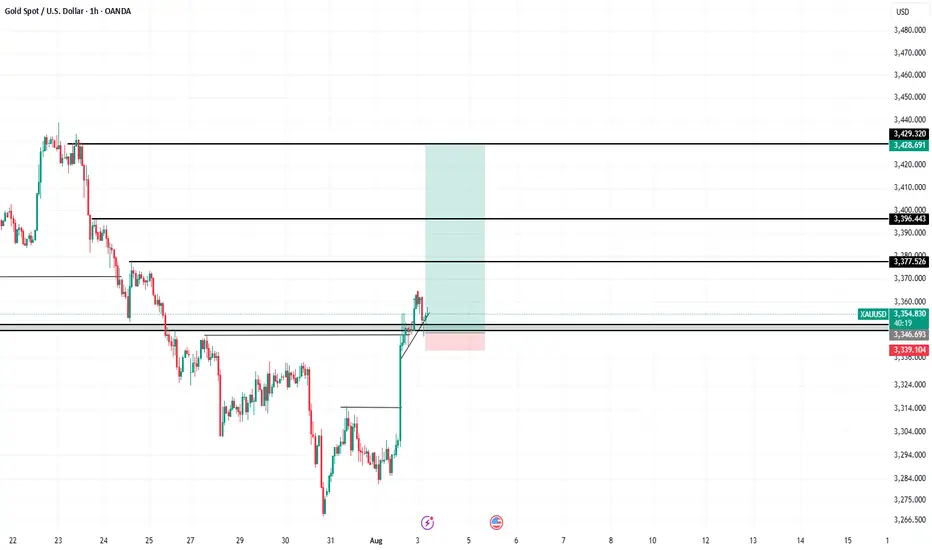
XAUUSD Breakout and Retest – Targeting 3428 Supply ZoneGold (XAUUSD) has broken above key resistance at 3346 and successfully retested it as support, forming a bullish structure with higher lows. This aligns with a classic breakout–retest continuation setup.
The entry is taken after confirmation of support holding, with the following levels in focus:
Entry: Around 3355
Stop Loss: Below retest zone at 3339
Targets:
TP1: 3377 (minor resistance)
TP2: 3396
Final TP: 3428–3430 supply zone
Market structure is bullish on the 1H timeframe, and momentum supports upside continuation. Trade aligned with trend and key demand zone reaction.
📌 Always manage risk. Not financial advice.
XAUUSDXAUUSD trend If the price can still stand above 3249, it is expected that there is a chance that the price will rebound. Consider buying the red zone.
🔥Trading futures, forex, CFDs and stocks carries a risk of loss.
Please consider carefully whether such trading is suitable for you.
>>GooD Luck 😊
❤️ Like and subscribe to never miss a new idea!

Gold looks like bearish move as the price hitting it resistance Gold is showing signs of a bearish move as the price tests its resistance zone. Sellers may take control if it fails to break above. Watch for confirmations before entering! 💹
#GoldAnalysis #XAUUSD #ForexTrading #BearishMove #ResistanceLevel"
Gold is in very nice bearish opportunity ahead.Gold is in very nice bearish opportunity ahead. The level of 3000$ should be good for testing as a strong support for a next bull run. My tp now after confirmation is in betwwen a zone 3000-3050$.

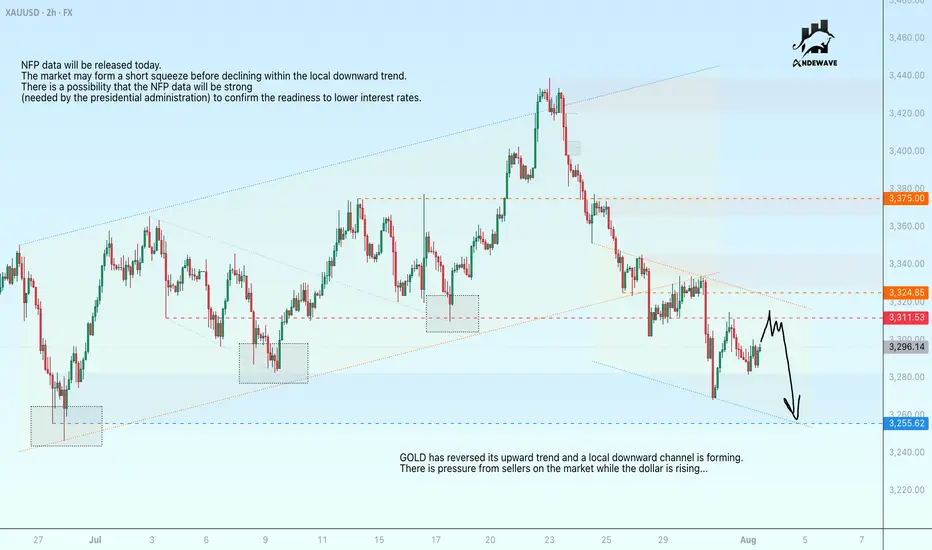
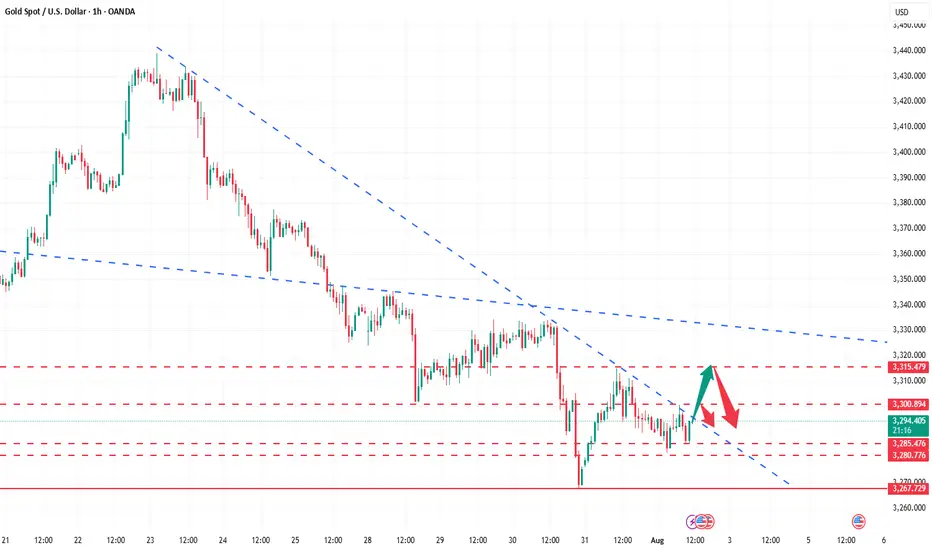
GOLD may be subject to manipulation ahead of the NFPGOLD has reversed its upward trend and a local downward channel is forming. There is pressure from sellers on the market while the dollar is rising...
NFP data will be released today. The market may form a short squeeze before declining within the local downward trend.
There is a possibility that NFP data will be strong (needed by the presidential administration) to confirm the readiness to lower interest rates.
Scenario: ahead lies a strong resistance zone at 3311.5 - 3324.85. The formation of a false breakout could intensify bearish pressure, leading to a decline in prices to 3255
Gold Maintains Bullish Momentum – Eyes $3,400📊 Market Summary:
Gold surged past the $3,385 resistance to reach a new high at $3,390, driven by weaker-than-expected ISM Services PMI data. The U.S. dollar softened and Treasury yields dipped, fueling the rally. However, after hitting the peak, some profit-taking emerged, causing gold to pull back slightly and currently trade around $3,383.
________________________________________
📉 Technical Analysis:
• Key Resistance:
$3,390–$3,395 – short-term local high. If this zone breaks, the next target is $3,400+.
• Nearest Support:
$3,380, followed by the previous breakout level at $3,365, both likely to act as support during any pullback.
• EMA 09 (Daily):
Price remains above the 9-day EMA, confirming the continuation of the short-term uptrend.
• Momentum / Volume / Candlestick:
RSI is holding above 60 – bullish. However, a long upper wick near $3,390 suggests short-term selling pressure or hesitation.
________________________________________
📌 Outlook:
Gold is showing bullish momentum, with the uptrend confirmed after breaking above $3,385. If price holds above $3,380, there's a strong possibility of testing the $3,400 level. However, a failure to sustain above this zone could lead to a retest of $3,365.
________________________________________
💡 Suggested Trade Strategy:
🔺 BUY XAU/USD : $3,380–$3,383
🎯 TP: 40/80/200 pips
❌ SL: $3,377

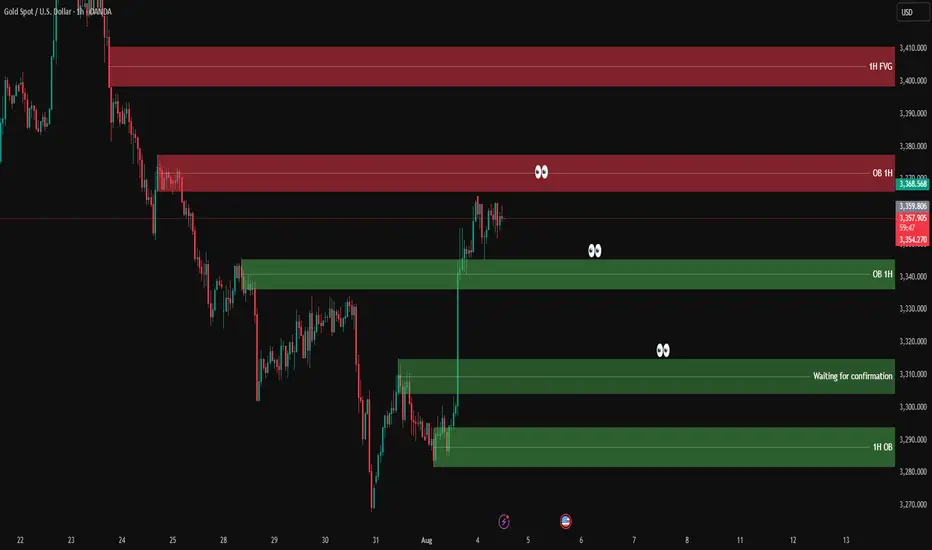
XAUUSD analysis - 1H FVG and OB setupsOn the 1H chart, price has made a sharp bullish move from the lower 1H OB zone (3,275 – 3,285) and is now hovering just below the 1H supply zone.
🔴 1H Supply Zone (OB):
3,354 – 3,368 → Price is consolidating here with no strong rejection yet.
🟢 1H Demand Zone (OB):
3,337 – 3,344 → First area to watch for potential bullish reaction.
👁 Mid-level support zone (waiting for confirmation):
3,310 – 3,320 → If price pulls back here and gives confirmation on lower timeframe, we’ll look for long setups.
📌 Trade scenarios:
1️⃣ Bullish: Wait for a retracement into 3,310 – 3,320, and if confirmed on LTF (3M–5M), go long.
2️⃣ If price drops deeper into the lower OB zone 3,275 – 3,285 and gives strong bullish reaction → potential long setup again.
3️⃣ Bearish: If price rejects the current OB zone (3,354 – 3,368) with confirmation → short entry targeting the green zones below (~3,320 or 3,310).
✅ Entry only after confirmation on lower timeframe
❌ No confirmation = no trade
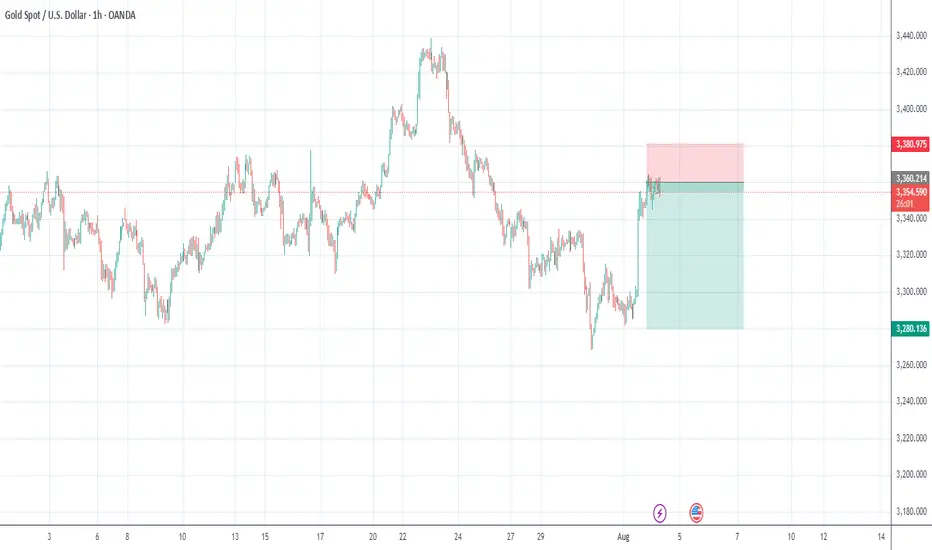
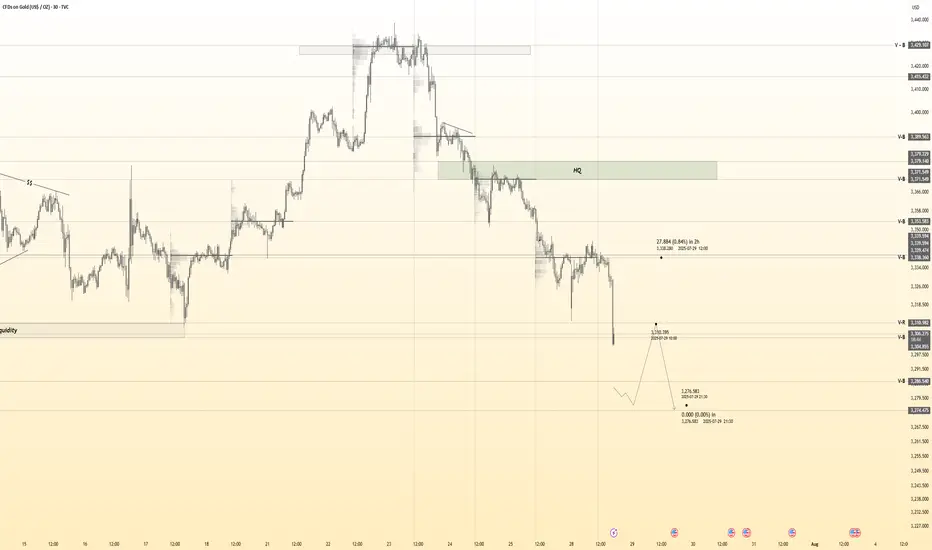
XAUUSD: Bearish Continuation in Play Toward 3,250Gold closed last week with a strong bearish weekly candle, rejecting from the 3,440 supply zone and closing below the key Fair Value Gap at 3,360. This confirms downside pressure, especially in the context of a strengthening dollar.
For this week, we may see a bullish opening early in the week toward 3,370, followed by a deeper bearish move targeting the major low and liquidity pool at 3,250.
Bias: Bearish
Key Zones:
• Resistance / Retest: 3,370
• Target: 3,250
• Supply Rejection: 3,440
Momentum favors further downside unless bulls reclaim key levels.

GOLD (XAUUSD): Important BreakoutsI've identified two significant breakouts on 📉GOLD.
The price violated a crucial intraday horizontal support and a major rising trend line.
These broken levels now form a contracting supply zone, suggesting that the price could continue to decline.
Target levels are 3314 and 3289.

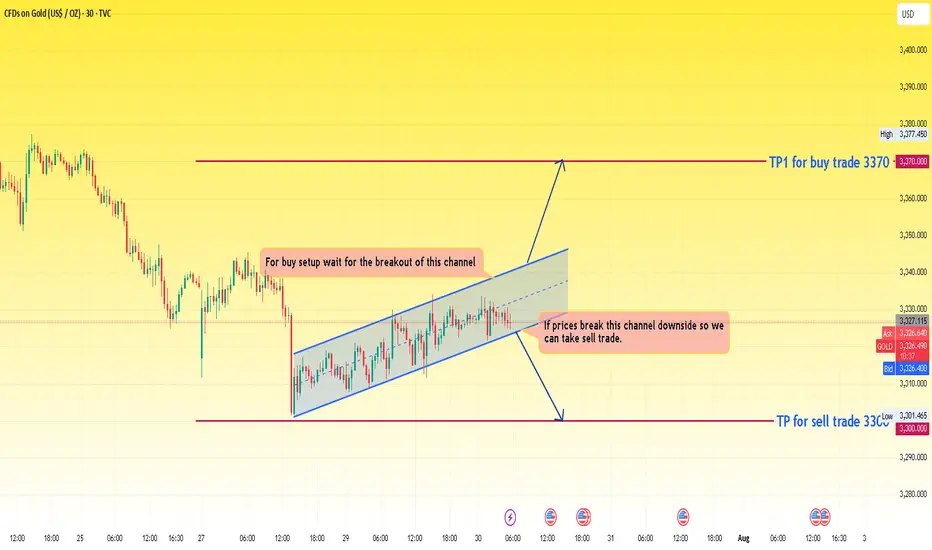
XAUUSD prices current scenario This chart presents a range-bound price action within an ascending channel and offers two potential breakout trade opportunities depending on price direction.
🔍 Chart Summary:
> Current Price: Around 3326-3328
> Pattern: Ascending channel
> Bias: Neutral (waiting for breakout)
📊 Channel Analysis:
> Price is moving inside an ascending channel, marked by two parallel trendlines (support and resistance).
> This suggests gradual bullish pressure, but the price is still within a consolidation/ranging structure.
> Buyers and sellers are currently indecisive, waiting for a clear breakout direction.
🧠 Trade Scenarios:
✅ Buy Setup:
: Condition: Breakout above the upper channel resistance
: Confirmation: Break and close above channel, ideally with strong bullish candles and volume
: Target: 3370 (marked as TP1 for buy trade)
> Reasoning: Breakout confirms buyer dominance and momentum continuation
❌ Sell Setup:
: Condition: Breakdown below the lower channel support
: Confirmation: Break and close below the channel with a bearish engulfing or volume spike
: Target: 3300 (marked as TP for sell trade)
> Reasoning: Break below structure indicates loss of buyer control and return of bearish trend
⚠️ Key Notes:
: The ascending channel suggests short-term bullish strength, but no strong trend has been confirmed yet.
: Avoid entering within the channel—this is a no-trade zone due to market indecision.
: Wait for confirmation of breakout/breakdown before entering trades.
✅ Conclusion:
> The price is currently in a rising consolidation channel.
> Breakout above = buy opportunity toward 3370
> Breakdown below = sell opportunity toward 3300
This is a classic wait-for-breakout setup—ideal for breakout traders looking for defined risk and reward zones.
Gold Struggles at Resistance – Indicates Lower Lows AheadGold has been in a clear downtrend after facing a strong rejection around the 3,438 level (main resistance zone). Price is currently moving within a descending channel, confirming the formation of lower highs and lower lows – a classic bearish market structure.
Currently, Gold is trading near 3,306, facing resistance at 3,339 (marked as a possible lower high). If price fails to break above this level and sustain, there is a strong probability of continuation towards 3,249 and even 3,216.
Key Technical Highlights
- Immediate Resistance: 3,339 – 3,353
- Support Levels: 3,301 (short-term), 3,249, and 3,216
A rejection near 3,339 can lead to another leg down targeting 3,249 and 3,216. However, a strong breakout above 3,339–3,353 could temporarily shift momentum towards 3,394.
Note
Please risk management in trading is a Key so use your money accordingly. If you like the idea then please like and boost. Thank you and Good Luck!

Gold 30Min Engaged ( Bearish Break Out Entry Detected )Time Frame: 30-Minute Warfare
Entry Protocol: Only after volume-verified breakout
🩸Bearish From now price - 3306
➗ Hanzo Protocol: Volume-Tiered Entry Authority
➕ Zone Activated: Dynamic market pressure detected.
The level isn’t just price — it’s a memory of where they moved size.
Volume is rising beneath the surface — not noise, but preparation.
🔥 Tactical Note:
We wait for the energy signature — when volume betrays intention.
The trap gets set. The weak follow. We execute.
The idea of shorting on rallies below 3315 remains unchanged.Gold remains generally weak, with multiple rebounds showing signs of fatigue. The upward moving average continues to suppress prices, indicating that the bearish trend remains intact, and the short-term market outlook remains bearish. Trading strategies remain bearish today, with a key focus on the 3300-3315 area, a key short-term resistance zone. If the market rebounds before the US market opens and approaches this area, or if a clear topping signal appears near this range, consider entering a short position. Today will see the release of the non-farm payroll data, which may influence the market's trajectory. We recommend prioritizing short-term trading before the release, and reconsidering the market's direction based on market feedback after the release. Structurally, gold continues to exhibit a volatile downward trend, with lower highs and lower lows. Today's low is expected to be lower than yesterday's. Short-term short positions are focused on 3285-3280, with a break below this level potentially allowing for further declines. Please carefully time your entry, strictly implement risk management, and avoid emotional trading.
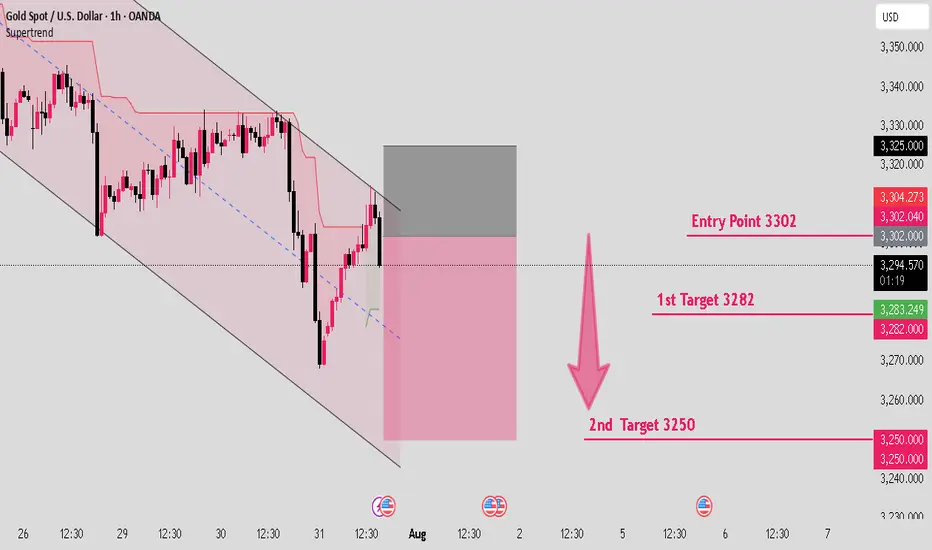
Gold is creating a downward structure in parallel channel.Hello IGT FOLLOWERS
Here is my gold overview, According to me gold will fall because it is continously working in a downward parallel channel.. Bearish momentum visible on lower timeframes (1H-4H) • Price Structure: Recently rejected from $3,320-$3,325 resistance zone Forming lower highs and lower lows- suggesting short-term downtrend continuation..
Key points :
Entry point : 3302
1st Target : 3282
2nd Target : 3250
Follow me for more latest updates and signals
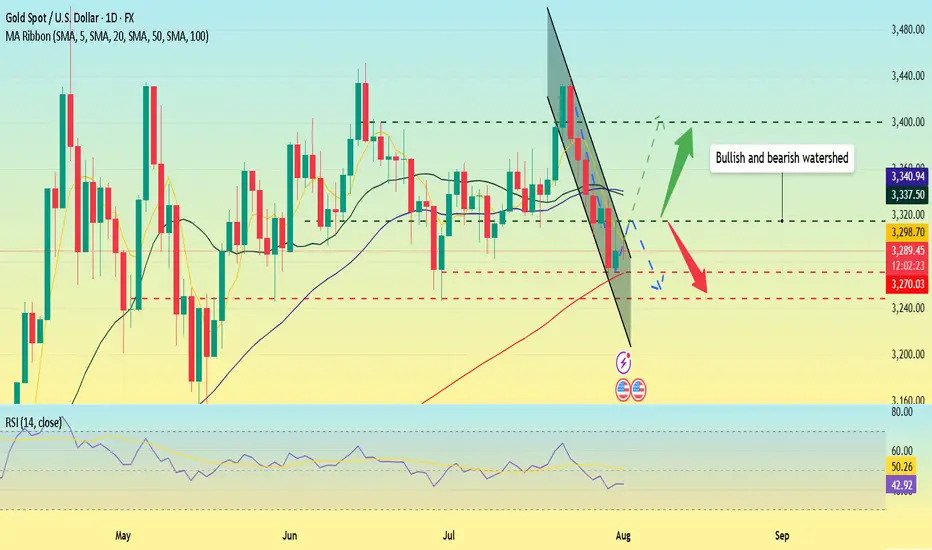
Impact of the Non-Farm Payrolls? Latest Analysis.Information Summary:
Most traders are turning their attention to the crucial US labor market report, which is being closely watched as the market actively searches for new clues regarding the timing of the next interest rate cut this year.
The July non-farm payrolls report will be released at 8:30 AM US time. US non-farm payrolls increased by 110,000 in July, seasonally adjusted, lower than the 147,000 increase in June. The US unemployment rate is expected to rise from 4.1% to 4.2% in July.
If the non-farm payrolls figure falls below 100,000 and the unemployment rate rises, it could signal a weakening job market, undermining the Fed's rekindled hawkish outlook and dampening the dollar's upward momentum. In this scenario, gold prices could re-cross the 3,400 mark. However, if the non-farm payrolls unexpectedly exceed 150,000, it could support the dollar's continued rise and hurt gold. Strong US employment data could rule out two rate cuts from the Fed this year.
Market Analysis:
Quaid believes that the current moving average crossover is trending downward, and downward momentum is still in play. The RSI remains at 42.7, hovering below the midline, indicating that gold's downward trend remains intact. The 20-day moving average fell below the 50-day moving average on Wednesday, confirming the bearish momentum.
Therefore, if gold closes below the key support level of the 100-day moving average at $3,270 on a weekly basis, a new downtrend could begin, potentially leading to a drop towards the June 30 low of $3,248.
Quaid believes that the current bull-bear watershed needs to focus on around 3315, which is the previous intensive trading area and is also the first resistance position for short-term upward movement.
On the last trading day of Super Data Week, Quaid hopes that everyone has gained something and has a happy weekend; I wish you all good luck.