60MIN trade Fibonacci extension trade. Return to Objective Point(1,00) after reaching Expanded Objective Point (1,618)
GOLD trade ideas

XAUUSD eyes potential Gartley patternOn the daily chart, XAUUSD has retreated from its highs, and short-term bears have the upper hand. Currently, we can pay attention to the area below 3191, which is a potential buy level for a bullish Gartley pattern and is within the previous demand zone.

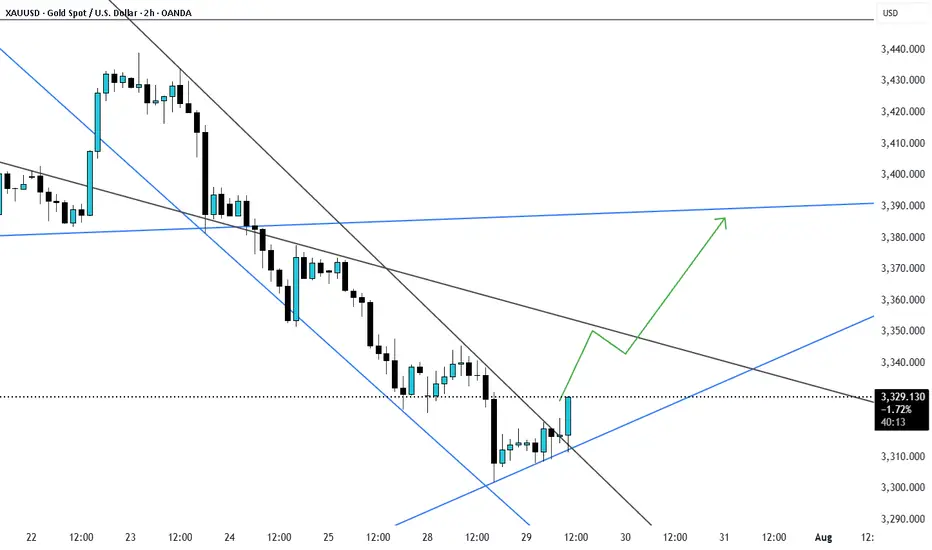
XAUUSD H1 - TRADING I’m quickly analyzing the turquoise trendlines on D1 and the others on H1, and I can determine that there will be a brief short reaction before continuing with the bullish trend.
XAUUSD 4H AnalysisGold is currently in a clear downtrend after failing to hold above the mid-channel. Price is retracing into a potential short zone with confluence from the moving average bands.
Fibonacci Retracement: Price is reacting near the 38.2% level (3,318).
Downside Fibonacci Targets:
1️⃣ 3,249.36 (38.2%)
2️⃣ 3,228.11 (61.8%)
3️⃣ 3,193.73 (100%)
As long as the price stays below the red resistance zone, the bearish momentum is likely to continue toward the lower Fibonacci targets. A break above 3,339 would invalidate the short setup.

The golden direction in the volatile trend
💡Message Strategy
The market is currently in a wait-and-see phase ahead of major fundamental events. With the Federal Reserve's interest rate decision and key data such as second-quarter GDP and the core PCE price index set to be released, traders are generally cautious. Gold has stabilized slightly after a series of declines, but a meaningful reversal has yet to materialize. The divergence between bulls and bears is intensifying, and the market is on the verge of a breakout. This week's gold market is driven by uncertainty surrounding macroeconomic expectations and the Fed's monetary policy.
After four consecutive trading days of gains, the US dollar index has slowed its gains, temporarily retreating to around 99. Traders are still betting on a September Fed rate cut, with the market placing a 64% probability on a September rate cut. However, this week's release of Q2 GDP and the core PCE price index data will significantly impact this outlook.
If GDP and inflation data are weak, this will reinforce market expectations of easing and potentially attract renewed buying for gold. Conversely, strong data could dampen expectations of a rate cut, supporting a stronger dollar and putting pressure on gold.
Furthermore, the Federal Reserve is about to hold its interest rate meeting. While it's almost certain that interest rates will remain unchanged, Powell's speech will be a key focus for the market. Any signals regarding internal disagreements, adjustments to the inflation path, or adjustments to the policy framework could trigger significant market volatility. From a global perspective, geopolitical risks have been relatively stable recently, providing no sudden support for gold.
📊Technical aspects
Gold is showing signs of a short-term rebound, but the technical structure still indicates a weak rebound, with no confirmed trend reversal. A break above 3350 would be considered a temporary stabilization, while a break below 3300 would reopen the downside. Current market sentiment is in a "wait for a signal" phase.
Gold currently has limited downward space, and data factors are accelerating this week. Gold is likely to undergo a long-short conversion, so our trading strategy uses a small stop loss to counter the larger space for gold's shape conversion.
💰Strategy Package
Long Position:3290-3305,SL:3280,Target: 3340-3360
GOLD PRICE: 2 BIG OPTIONS.1. Option 1: Wave 4 of gold price ends, with this scenario, the DXY trend will not be like the chart below, but this week DXY will return to the old bottom and head towards 95-91, gold will increase to complete wave (5).
Price range for the next 3-4 months: 3350-3750.
2. Option 2:
In terms of time, wave (4) has not yet ensured balance. DXY increases and recovers as the chart.
That means we have a gold price range for the next 3-4 months of 3400-3100.

XAUUSD Intraday Technical Analysis – Bullish Breakout SetupGold (XAUUSD) is showing signs of bullish recovery after a sharp sell-off, with current price action around 3305.86 USD hinting at a potential breakout on the 1-hour timeframe.
- Technical Overview
Price structure: After a steep decline, gold formed a base near the 3284–3299 zone and is now climbing back, with a potential inverse head-and-shoulders formation taking shape.
EMA cluster: Price is approaching the confluence of the EMA 50, EMA 100, and EMA 200, currently acting as dynamic resistance around 3309–3323. A break above these levels may confirm bullish strength.
Fibonacci retracement: The bounce appears from the 0.874 extension, indicating the end of the previous bearish leg.
Volume analysis: Increasing bullish volume supports the idea of a potential breakout.
- Key Levels to Watch
Zone Type
Price Level (USD)
Remarks
Immediate Resistance: 3,309 – 3,323 - Major test zone; overlaps with EMA 50/100
Major Resistance : 3,337 – 3,340 - Previous high; if broken confirms bullish continuation
Support Zone: 3,299 – 3,302 - Intraday support turned demand zone
Critical Support: 3,284 – 3,285 - Recent swing low; invalidates bullish view if broken
- Intraday Strategy Suggestion
Scenario 1 – Bullish Breakout
Entry: Buy on breakout and retest of 3,309–3,323
SL: Below 3,299
TP1: 3,337
TP2: 3,355
- Confirmation by strong bullish candle closing above EMA cluster and above resistance zone.
Scenario 2 – Buy on Pullback
Entry: Buy limit at 3,300–3,302
SL: Below 3,284
TP1: 3,323
TP2: 3,337
- Look for RSI divergence or bullish engulfing candle at support for higher conviction.
- Final Note
The bulls are attempting to reclaim momentum after a major correction. If gold can sustain above the 3,309 resistance and hold the 3,300 base, a short-term bullish reversal could materialize.

GOLD Buyers In Panic! SELL!
My dear friends,
Please, find my technical outlook for GOLD below:
The instrument tests an important psychological level 3309.2
Technical Indicators: Supper Trend gives a precise Bearish signal, while Pivot Point HL predicts price changes and potential reversals in the market.
Target - 3296.9
Recommended Stop Loss - 3316.4
About Used Indicators:
Super-trend indicator is more useful in trending markets where there are clear uptrends and downtrends in price.
Disclosure: I am part of Trade Nation's Influencer program and receive a monthly fee for using their TradingView charts in my analysis.
———————————
WISH YOU ALL LUCK

Gold Price Analysis August 5#XAUUSD – Gold continues to increase in wave 3, BUY strategy continues to be prioritized
The D1 candle continued to close with strong increase, confirming that the uptrend is dominant and there are no clear signs of correction. Gold is currently moving in wave 3 - a period with strong amplitude and few recovery beats, so the main trading strategy is still to wait to buy at important support zones.
In the Asian session this morning, the price is reacting at the 3385 zone - an area that can act as a confirmation point for the next recovery. If the buyers maintain their position in this zone, the price will likely continue to move towards higher resistance zones.
🔹 Support zone to watch: 3363 – 3346 – 3332
🔹 Potential resistance zone: 3385 – 3407
👉 Strategy: Prioritize waiting for confirmation signals at support zones to open BUY orders in the direction of the trend. Need to carefully observe the price reaction at the 3385 zone to assess the strength of the buying force during the day.

Gold Market Eyes Daily Demand Zones at 3270–3315Gold market aligns with daily candle formation, seeking to mitigate substantial demand zones between 3270 and 3315. This area may provide the necessary liquidity for a potential bullish reaction, pending confirmation. follow for more insights , comment and boost idea


Gold’s Liquidity Hunt Eyes on Bullish FVG Reaction!Gold Analysis – NY Session Outlook
During the New York session, gold created equal highs near recent swing highs, indicating that upside liquidity remains uncollected. Currently, the market is pulling back, targeting liquidity resting below the trendline, along with internal liquidity levels beneath.
If gold continues to move downward and taps into the marked bullish Fair Value Gap (FVG), monitor that zone for any signs of bullish confirmation. If confirmed, there is potential for a further upward move toward the equal highs and beyond, aiming for external liquidity.
Always Do Your Own Research (DYOR).

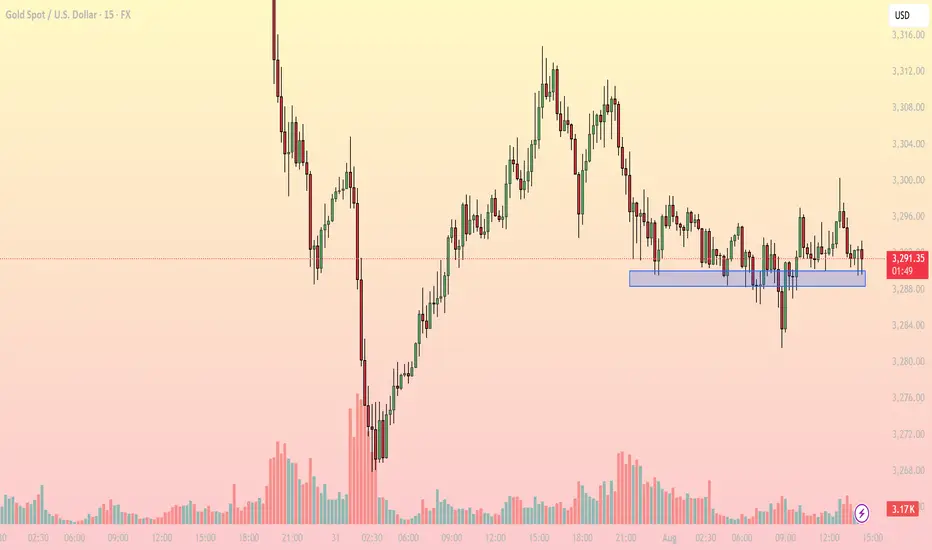
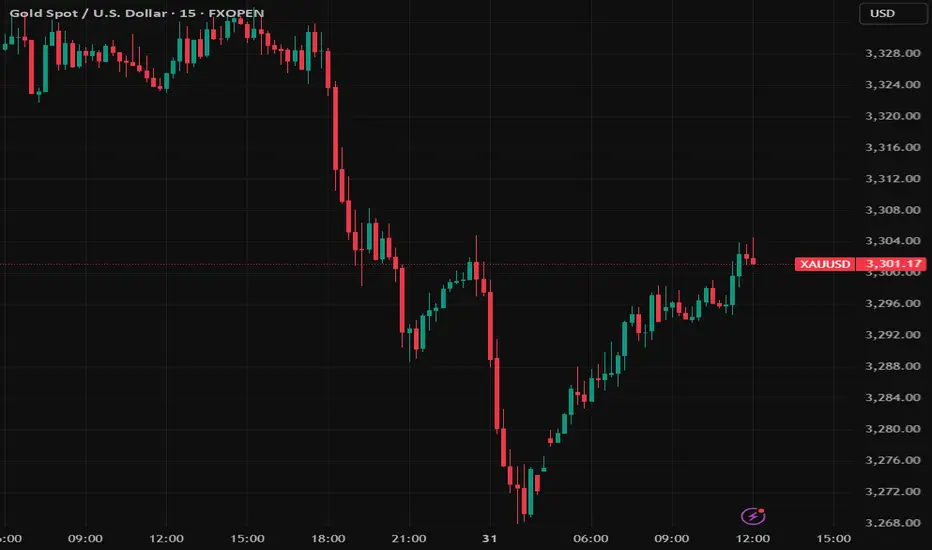
Gold consolidates near key support – What's next for?1. Market Overview
On the 15-minute chart, XAUUSD is trading around 3,290–3,292 USD, hovering just above a critical intraday support zone at 3,287–3,289 USD (highlighted in blue). This area has repeatedly provided a bounce in recent sessions, indicating persistent buying interest.
The current price action reflects sideways movement within a narrow range (3,287–3,296 USD), and notably, declining volatility, as shown by reduced candle range and trading volume.
2. Technical Breakdown
EMA: Price is moving around the EMA20 and EMA50, reflecting indecision and lack of directional momentum.
RSI (inferred): Likely hovering near the neutral 50–55 zone, confirming a balanced market.
Trendline: A descending series of lower highs from the 3,312 peak suggests bearish pressure, though buyers still defend key support.
Fibonacci: The 3,287 USD zone aligns with the 61.8% Fibonacci retracement level, reinforcing its strength as a bounce area.
3. Key Levels to Watch
3,287–3,289: Support - Repeated reactions here – key demand zone
3,296: Immediate resistance - Needs breakout to confirm bullish move
3,302: Next resistance - Breakout target – short-term top
3,275: Deeper support - Retest level if support breaks
4. Trading Strategy Scenarios
🔹 Scenario 1 – Long setup at support
Entry: 3,287–3,289 (wait for bullish reaction like pin bar or engulfing)
Stop Loss: Below 3,284
TP1: 3,296 | TP2: 3,302
🔹 Scenario 2 – Short setup on breakdown
Entry: Below 3,284 (after clear bearish candle close)
Stop Loss: 3,288
TP1: 3,275 | TP2: 3,268
5. Conclusion
Gold is in a tug-of-war at a sensitive support zone. Whether bulls defend or bears break below will set the tone for the rest of the session. Focus on price reaction around 3,287 to determine direction – avoid blind predictions.
Make sure to follow for more live strategies as the New York session unfolds – and save this post if you find it helpful!
What’s your view on this support zone? Let’s discuss below!
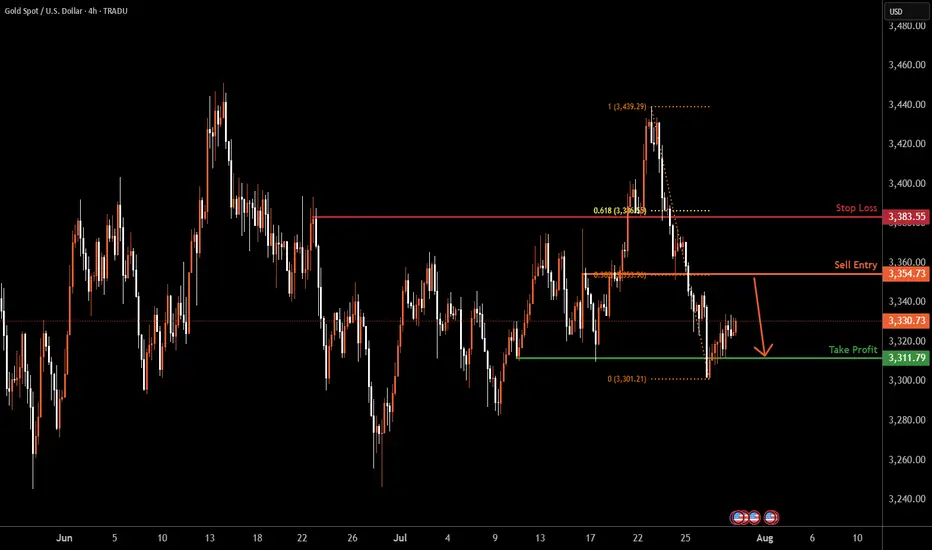
XAUUSD H4 | Heading into pullback resistanceBased on the H4 chart analysis, the price is rising towards the sell entry, which is a pullback resistance that lines up with the 38.2% Fibonacci retracement and could drop to the take profit.
Sell entry is at 3,354.73, which is a pullback resistance that aligns with the 38.2% Fibonacci retracement.
Stop loss is at 3,383.55, which is a pullback resistance that is slightly below the 61.8% Fibonacci retracement.
Take profit is at 3,311.79, which is a multi-swing low support.
High Risk Investment Warning
Trading Forex/CFDs on margin carries a high level of risk and may not be suitable for all investors. Leverage can work against you.
Stratos Markets Limited (tradu.com ):
CFDs are complex instruments and come with a high risk of losing money rapidly due to leverage. 65% of retail investor accounts lose money when trading CFDs with this provider. You should consider whether you understand how CFDs work and whether you can afford to take the high risk of losing your money.
Stratos Europe Ltd (tradu.com ):
CFDs are complex instruments and come with a high risk of losing money rapidly due to leverage. 66% of retail investor accounts lose money when trading CFDs with this provider. You should consider whether you understand how CFDs work and whether you can afford to take the high risk of losing your money.
Stratos Global LLC (tradu.com ):
Losses can exceed deposits.
Please be advised that the information presented on TradingView is provided to Tradu (‘Company’, ‘we’) by a third-party provider (‘TFA Global Pte Ltd’). Please be reminded that you are solely responsible for the trading decisions on your account. There is a very high degree of risk involved in trading. Any information and/or content is intended entirely for research, educational and informational purposes only and does not constitute investment or consultation advice or investment strategy. The information is not tailored to the investment needs of any specific person and therefore does not involve a consideration of any of the investment objectives, financial situation or needs of any viewer that may receive it. Kindly also note that past performance is not a reliable indicator of future results. Actual results may differ materially from those anticipated in forward-looking or past performance statements. We assume no liability as to the accuracy or completeness of any of the information and/or content provided herein and the Company cannot be held responsible for any omission, mistake nor for any loss or damage including without limitation to any loss of profit which may arise from reliance on any information supplied by TFA Global Pte Ltd.
The speaker(s) is neither an employee, agent nor representative of Tradu and is therefore acting independently. The opinions given are their own, constitute general market commentary, and do not constitute the opinion or advice of Tradu or any form of personal or investment advice. Tradu neither endorses nor guarantees offerings of third-party speakers, nor is Tradu responsible for the content, veracity or opinions of third-party speakers, presenters or participants.
Gold Trading Strategy XAUUSD August 4, 2025Gold Trading Strategy XAUUSD August 4, 2025:
Gold prices rose more than 2% last Friday, hitting a one-week high, as weaker-than-expected US non-farm payrolls data boosted hopes for a Federal Reserve rate cut and the announcement of new tariffs fueled safe-haven demand for gold.
Fundamental news: The non-farm payrolls report showed only 73,000 jobs added in July, well below market expectations of 110,000. The unemployment rate rose to 4.2%, indicating a cooling labor market.
Technical Analysis: Gold prices are rising strongly after a strong candle in the 3285 - 3300 area as previously predicted. The bullish pattern on the H1 frame has shown that the buyers are returning very strongly. Currently, the price is showing signs of sideway at the 336x area, our strategy today will be to wait for trading at the support zones of the gold price. Important price zones today: 3315 - 3320 and 3330 - 3335.
Today's trading trend: BUY.
Recommended orders:
Plan 1: BUY XAUUSD zone 3330 - 3332
SL 3327
TP 3335 - 3345 - 3355 - 3370.
Plan 2: BUY XAUUSD zone 3318 - 3320
SL 3315
TP 3323 - 3333 - 3343 - 3363.
Plan 3: SELL XAUUSD zone 3370 - 3372
SL 3375
TP 3367 - 3357 - 3347 - 3337 (small volume).
Wishing you a safe, smooth and profitable trading week.💗💗💗💗💗

Gold Could Show there Potentially BearishGold is currently consolidating, but a downtrend range is forming based on the prevailing market setup. After erasing early gains, XAUUSD stabilized near 3340 on Monday, with downside pressure largely influenced by a stronger U.S. Dollar following the announcement of the US-EU trade agreement.
Price rejected sharply from the 3340 resistance zone, suggesting continued bearish momentum. A minor pullback was seen after testing the upper boundary, with sellers regaining control near resistance. Traders are closely watching the 3350–3362 resistance zone, where another rejection could fuel a fresh downside move A confirmed breakdown below 3312 could open the path toward 3282 in the short term.
Ps: Support with like and comments for more better analysis.

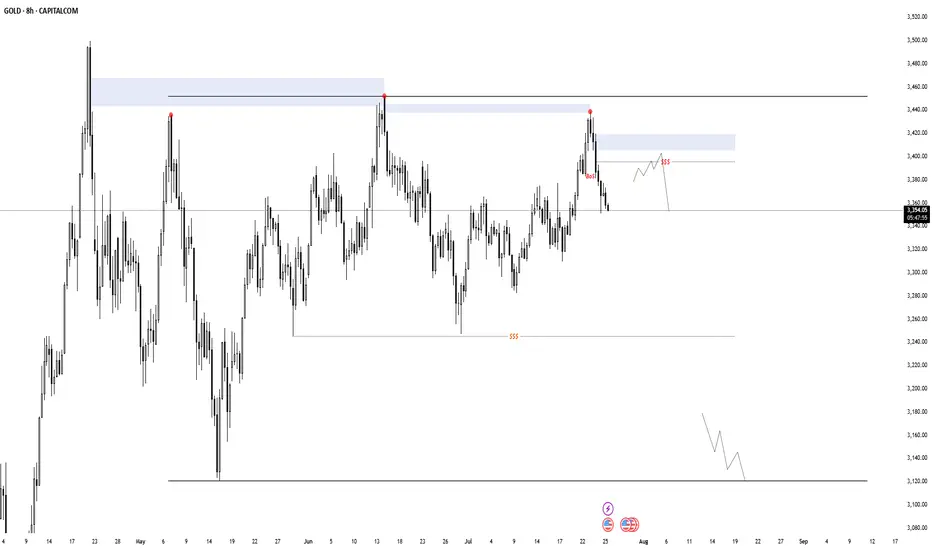
Gold DistributionI was to focused on crypto this week that i completely missed that. At the moment it's an confirmed internal model 2 distribution. If i'm lucky i get an entry in a redistribution form up there. Target is the range low, invalidation above the 3rd tap.
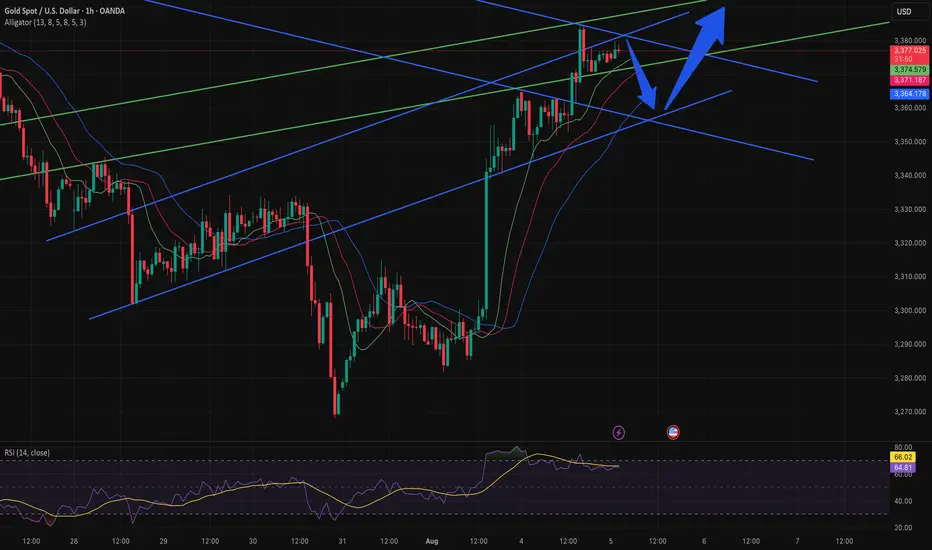
Gold Break of channel resistance next target is 3360-3375Gold was trending in down trend but now it has broken the resistance and is likely to go up.
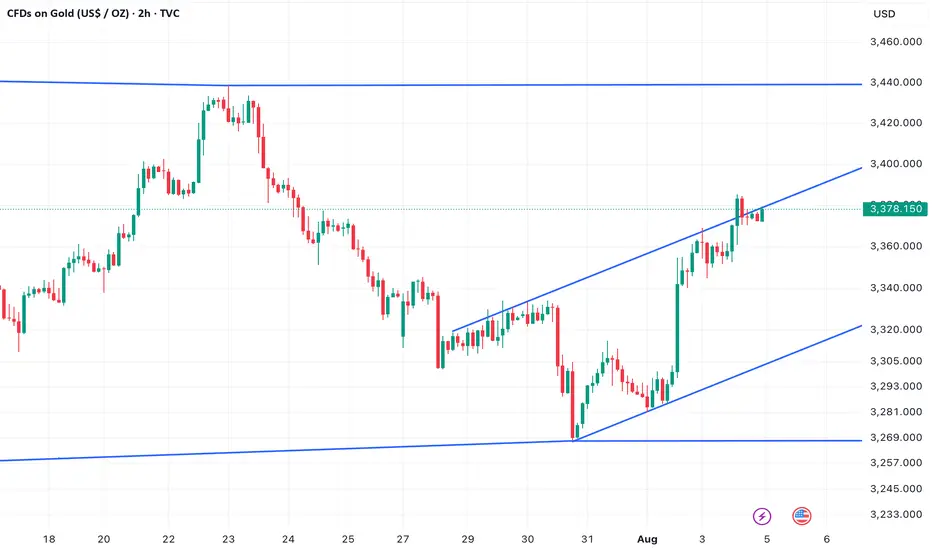
Gold in ascending channelAfter last week's steep and violent drop from $3,439 USD post Fed, Gold has found new momentum thanks to weaker than expected non-farm payroll numbers. But the price has been capped inside an ascending channel. This doesn't look particularly convincing to me for a strong reversel and bull case in the short term unless we manage to break out of the channel soon. If we fail to break the $3,439 USD high pre- Fed meeting I expect a test of the lower bound of the channel and a potential break below that.
A break below the channel opens up the way to the low at $3,267 USD.
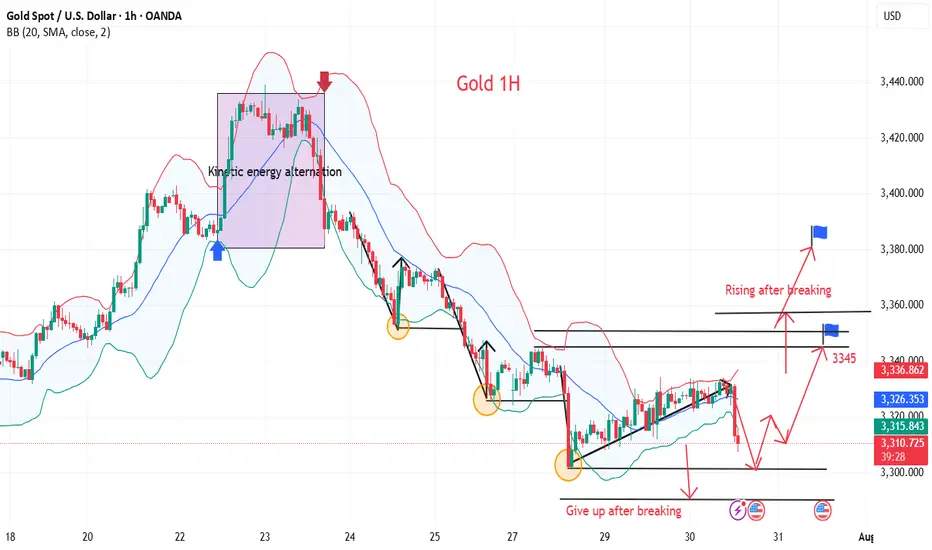
Gold Trade Plan 29/07/2025Dear Traders,
it time to recover Gold after Deep Correction ,
i expect price will be continue upward movement
with Target 1 : 3339
Target 2 : 3351
Target 3 : 3370
Regards,
Alireza!

XAU/USD at Make-or-Break: $3,304 Holds the Key!"XAU/USD is testing a key resistance at $3,304. A breakout could trigger a rally to $3,315, while rejection may lead to a drop to $3,292."
Price Action & Key Levels
Support: 3,298 → 3,292 (critical demand zone).
Resistance: 3,304 → 3,310 (supply zone).
Breakout Level: 3,304 (confirmation needed).
Indicator-Based Evidence
RSI: "RSI at 62 (not overbought), suggesting room for upside."
MACD: "MACD histogram is rising, supporting bullish momentum."
Moving Averages: *"Price above 9 & 21 EMA, short-term trend bullish."
Fundamental Context
"Gold is supported by Fed rate cut expectations, but a strong USD could limit gains."
"Geopolitical risks (e.g., Middle East tensions) may boost safe-haven demand."
Scenario 1: Bullish Breakout
Entry: Buy above $3,304 (confirmed close).
Target: $3,310 → $3,315.
Stop-Loss: Below $3,298 (risk management).
Scenario 2: Bearish Rejection
Entry: Sell below $3,298.
Target: $3,292 → $3,288.
Stop-Loss: Above $3,306.
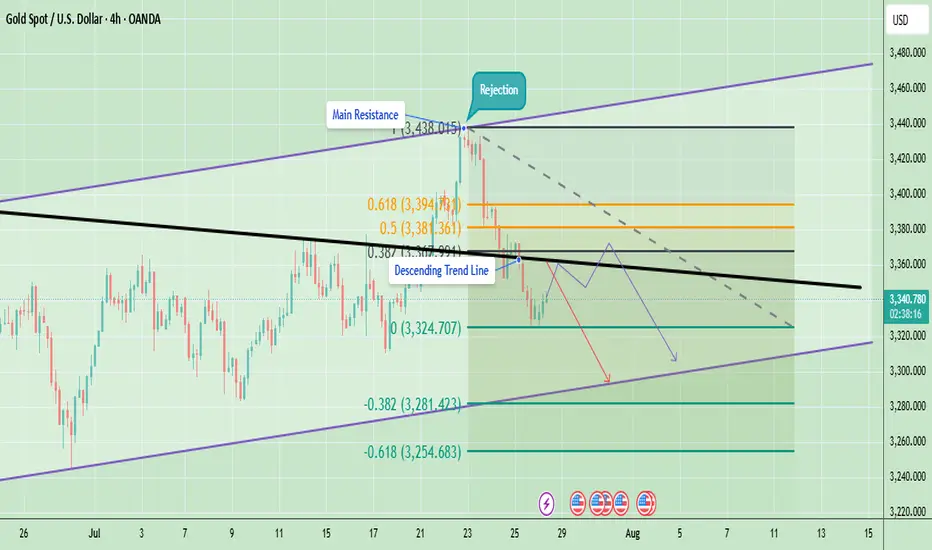
Technical Analysis - Gold Rejected at ResistanceGold is currently trading around $3,341 after facing a strong rejection from the $3,438 resistance area. This rejection coincided with the upper boundary of the trend channel and the main resistance zone, which also aligns with the Fibonacci 0.5–0.618 retracement levels. After the rejection, price fell below the descending trendline, indicating that short-term sellers have taken control.
On the downside, the immediate support sits at $3,324, which has acted as a short-term bounce level. A break below this could push gold lower toward $3,281 and potentially $3,254, which are key Fibonacci extension support levels. On the upside, the immediate hurdle is at $3,355–$3,360 (descending trendline). A breakout above this area will be critical for any bullish recovery attempt toward $3,381–$3,394 and eventually $3,420–$3,438.
At the moment, the short-term trend remains bearish because gold is trading below the descending resistance and showing lower highs. However, as long as gold holds above the $3,254 support zone, the medium-term structure remains neutral to bullish, giving bulls a chance if momentum shifts again.
Last week candle is pin bar bearish candle which is showing bearish momentum at the moment. The candle shows rejection near $3,400–$3,450, aligning with the triangle’s upper resistance trendline. If gold cannot reclaim and hold above last week’s high, price may drift lower to retest support zones around $3,248–$3,150 before another breakout attempt.
Note
Please risk management in trading is a Key so use your money accordingly. If you like the idea then please like and boost. Thank you and Good Luck!
Gold Rush Stop?It seems like gold has reached exhaustion according to my analysis, and after checking my previous long term analysis () it confirms where price was suspected to possibly reverse.
Happy trades
