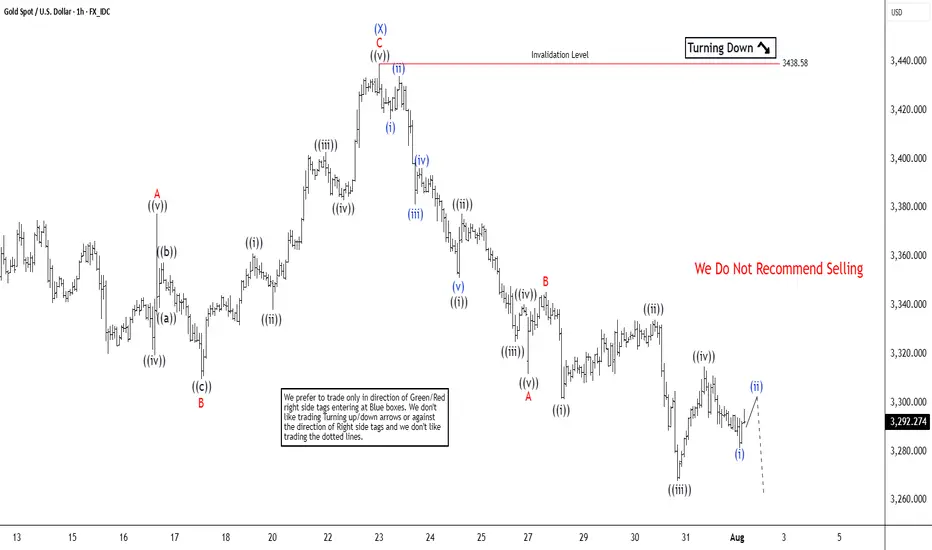
Elliott Wave Analysis Points to Gold (XAUUSD) Support Near 3320Gold (XAUUSD) appears poised for a double correction from its 16 June 2025 high. A double three consists of two corrective patterns, typically zigzags. From the June peak, wave (W) concluded at 3246.55, and wave (X) rallied to 3438.58, as shown on the 1-hour chart. Wave (Y) is now unfolding lower with internal subdivision as a zigzag. From wave (X), wave ((i)) ended at 3351.17, and wave ((ii)) peaked at 3377.45. Wave ((iii)) declined to 3324.80, followed by a wave ((iv)) rally to 3340.34. The final wave ((v)) completed at 3311.62, forming wave A in a higher degree. A corrective wave B rally reached 3345.35 before gold resumed its downward move.
Within wave C, wave ((i)) finished at 3301.47, and wave ((ii)) rallied to 3334.08. Wave ((iii)) dropped to 3267.94, with wave ((iv)) ending at 3314.85. Gold should continue lower in wave ((v)) to complete wave C. The potential target lies within the 100%–161.8% Fibonacci extension from the 16 June high. This projects a support zone between 3104 and 3230, where a three-wave rally is anticipated. Traders should monitor this area for potential reversal signals, as it may offer support for a corrective bounce.
GOLD trade ideas

Gold: ADP, Fed & Key Resistance Gold has been range-bound today—let’s focus on the impact of the ADP data and Fed rate decision ⚠️.
Key resistance lies around 3345-3350 📍: a breakout could fuel further upside 📈, while a rejection may trigger an oscillating pullback 📉
⚡️⚡️⚡️ XAUUSD ⚡️⚡️⚡️
🚀 Buy@ 3325
🚀 TP 3333 - 3339 -3344
Daily updates bring you precise trading signals 📊 When you hit a snag in trading, these signals stand as your trustworthy compass 🧭 Don’t hesitate to take a look—sincerely hoping they’ll be a huge help to you 🌟 👇

gold with nadara watson gold with nadara watson using one hour time frame hope working fine with you

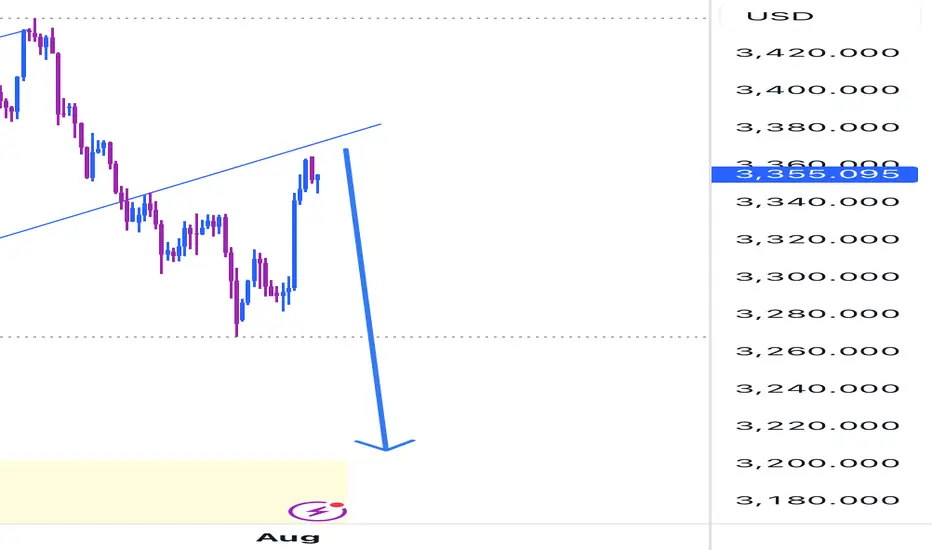
Gold (XAU/USD) 4H Timeframe UpdateGold opened the week continuing its bearish move down to the 3303 area. Since then, price has been slowly climbing, showing signs of retracement — but structure remains uncertain.
On the 4H timeframe, we’re currently forming a head and shoulders pattern (now 2/3 complete), and price action is also shaping a bearish flag, suggesting a possible continuation to the downside.
We’re heading into heavy economic news starting tomorrow morning, along with the beginning of earnings season for major assets — all of which could trigger sharp volatility in gold.
Key levels to watch:
• A break above the swing high at 3345 would suggest a bullish continuation.
• A break below the swing low at 3308 would confirm a bearish move.
• The resistance level at 3365 is a key zone to monitor — this is where I expect the right shoulder of the head and shoulders pattern to complete.
Importantly, the 50 SMA is currently traveling in line with this 3365 resistance, adding extra confluence. A break above 3365 would not only take out a strong historical level but also break above the 50 SMA, signaling potential strength to the upside. On the flip side, a rejection from this area would serve as a double rejection — from both resistance and the 50 SMA — reinforcing the bearish case.
For now, it’s a tug of war between buyers and sellers, and with the upcoming data releases, momentum could shift fast.
⚠️ As always, wait for confirmed setups, manage your risk, and only trade with a plan.
Limit risk to 1–2% of your capital per day.

GOLD Bullish strong TVC:GOLD After price formed an Ascending Triangle on the Daily time frame it looks like we'll be bullish for the entire week. Tho let's see how everything plays out and guys please do you have any ideas on Gold let me know on the comment session.

Msft shortGold rested on your trend line, a conformation to go short. Waiting for a clear rejection on a daily chart and
We are expecting gold to fall this week
Xausd techinical analysis.Xausd techinical analysis next move posibale at h1 time frame not finchinical advice.

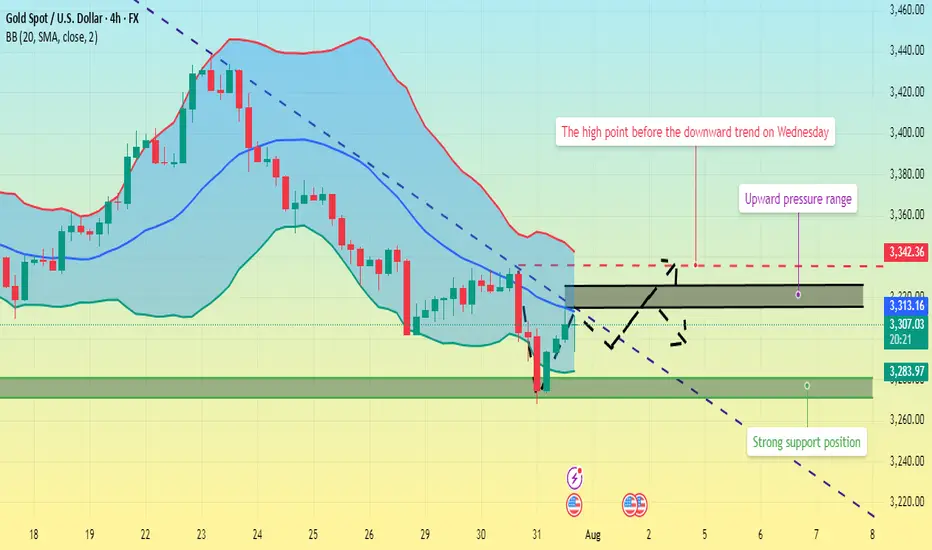
Gold fluctuates. Is the decline halted?Information Summary:
Despite diminished market expectations for a September US rate cut, gold rebounded from a one-month low hit the previous session on Thursday, boosting its safe-haven appeal as newly announced US tariffs sparked new trade uncertainty.
So far, gold has risen 1.15%, hovering around $3,310, a gain of nearly $40 today. On Wednesday, gold prices hit their lowest point since June 30th: $3,267.79.
Market Analysis:
On the 4-hour chart, prices remain below the middle Bollinger Band, with a descending trendline defining the current bearish momentum. Prices rebounded after hitting this month's low on Wednesday. In the short term, watch for price rejection signals near the trendline. Upward pressure currently lies between $3,315 and $3,325, while support lies between $3,280 and $3,270.
Currently, prices are fluctuating upward. Quaid believes the bullish trend may continue. If the current resistance level is broken, it could reach the 3335 high before Wednesday's decline.
Trading strategy:
Go long near 3300, stop loss at 3290, profit range 3320-3330.
GOLD: Bottoming Out or Just the Calm Before the Storm? – GOLD: Bottoming Out or Just the Calm Before the Storm?
Gold has dropped nearly $50 over the last 4 sessions, showing clear bearish momentum. But is this just a liquidity grab before a reversal — or are we simply pausing before another leg down?
🔍 Market Context:
Recent US–EU defence and trade agreements may have weakened gold’s short-term appeal as a safe haven.
The US dollar and equities have both gained on strong macroeconomic data, redirecting capital flows away from metals.
Overall market sentiment has tilted risk-on, putting additional pressure on gold prices.
📊 Technical Overview (12H Chart):
Price has broken below the 3342 key support zone and rejected the retest — turning it into short-term resistance.
Current range sits between:
Sell-side liquidity zone: 3301–3292
Major demand/FVG zone: 3272–3270
Above price:
Resistance at 3342, and a broader sell zone at 3370–3388 (OB + FVG + Fib 0.5–0.618)
🔧 Trade Plan (Reaction-Based — Not Predictive):
🟢 Scenario 1 – Buy (Scalp Reaction)
Entry: 3292 – 3290
Stop Loss: 3285
Targets: 3296 → 3300 → 3305 → 3310 → 3315 → 3320 → 3325 → 3330
📍 Intraday bounce play from a high-liquidity zone
🟢 Scenario 2 – Buy (Deeper Reversal Swing)
Entry: 3272 – 3270
Stop Loss: 3265
Targets: 3276 → 3280 → 3284 → 3288 → 3292 → 3294 → 3300 → Trail
📍 Potential mid-term bottom setup if liquidity is fully swept
🔴 Scenario 3 – Sell (Short-Term Rejection)
Entry: 3340 – 3342
Stop Loss: 3346
Targets: 3335 → 3330 → 3325 → 3320 → 3310
📍 Clean rejection setup if price fails to reclaim key resistance
🔴 Scenario 4 – Sell (Higher Supply Zone)
Entry: 3370 – 3372
Stop Loss: 3376
Targets: 3365 → 3360 → 3355 → 3350 → 3345 → 3340 → 3330 → 3320
⚠️ Higher risk; only valid with strong confirmation
⚠️ Risk Notes:
Be mindful of fakeouts around London and NY opens, as liquidity sweeps are common.
Wait for price to enter your zone, then react — don’t anticipate.
Strict risk management is key in a volatile environment like this.
🧭 I’ll continue monitoring how price reacts around these zones.
If this kind of structured planning resonates with your approach,
feel free to stay connected — or share your perspective in the comments.

XAUUSD SELL OFF CONTINUATION All my trade entry criterias met with the backing of the ADP Non-Farm Employment Change news release being positive for the USD, a SELL trade on GOLD

GOLD ROUTE MAP UPDATEHey Everyone,
Please see update on our 1H chart route map.
Gold continued its bearish momentum into today, hitting our bearish target at 3238, while leaving the 3348 bullish gap still open.
After a break below 3328, price followed through and hit 3305, entering our key retracement range, which gave the bounce to manage any premature positions on the top. We’re now watching closely for a reaction at this level.
A clean EMA5 cross and lock below 3305 will open the path toward the swing range.
However, failure to lock below this level could trigger a bounce from here.
This is a pivotal area for the next directional move.
We will keep the above in mind when taking buys from dips. Our updated levels and weighted levels will allow us to track the movement down and then catch bounces up.
We will continue to buy dips using our support levels taking 20 to 40 pips. As stated before each of our level structures give 20 to 40 pip bounces, which is enough for a nice entry and exit. If you back test the levels we shared every week for the past 24 months, you can see how effectively they were used to trade with or against short/mid term swings and trends.
The swing range give bigger bounces then our weighted levels that's the difference between weighted levels and swing ranges.
BULLISH TARGET
3348
EMA5 CROSS AND LOCK ABOVE 3348 WILL OPEN THE FOLLOWING BULLISH TARGETS
3369
EMA5 CROSS AND LOCK ABOVE 3369 WILL OPEN THE FOLLOWING BULLISH TARGET
3397
EMA5 CROSS AND LOCK ABOVE 3397 WILL OPEN THE FOLLOWING BULLISH TARGET
3422
BEARISH TARGETS
3328 - DONE
EMA5 CROSS AND LOCK BELOW 3328 WILL OPEN THE FOLLOWING BEARISH TARGET
3305 - DONE
EMA5 CROSS AND LOCK BELOW 3305 WILL OPEN THE SWING RANGE
3289
3267
As always, we will keep you all updated with regular updates throughout the week and how we manage the active ideas and setups. Thank you all for your likes, comments and follows, we really appreciate it!
Mr Gold
GoldViewFX

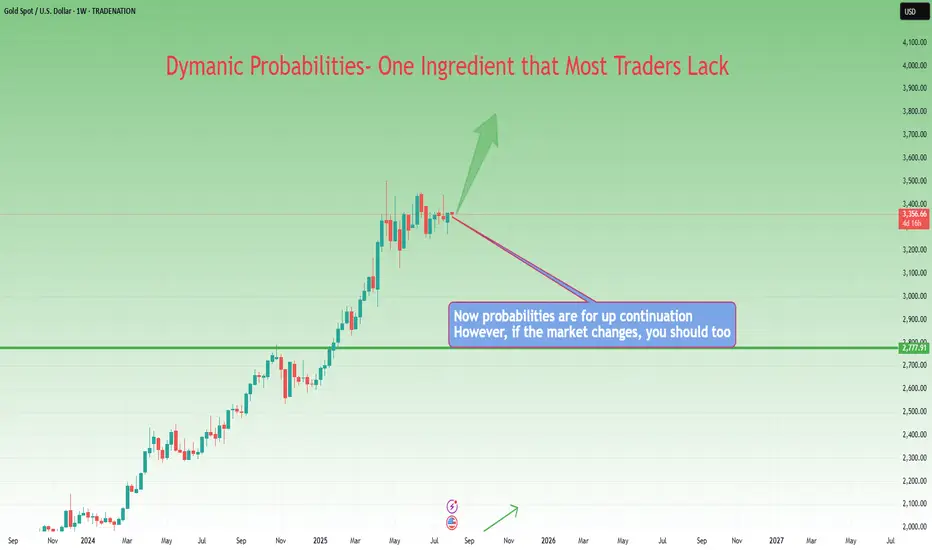
From Execution to Adaptation: Enter Dynamic ProbabilitiesIn the previous article , we looked at a real trade on Gold where I shifted from a clean mechanical short setup to an anticipatory long — not because of a hunch, but because the market behavior demanded it.
That decision wasn’t random. It was based on new information. On structure. On price action.
It was based on something deeper than just “rules” — it was about recognizing when the probability of success had changed.
That brings us to a powerful but rarely discussed concept in trading:
👉 Dynamic probabilities.
________________________________________
📉 Static Thinking in a Dynamic Market
Most traders operate with static probabilities — whether they realize it or not.
They assign a probability to a trade idea (let’s say, “this breakout has a 70% chance”) and treat that number as if it’s written in stone.
But markets don’t care about your numbers.
The moment new candles print, volatility shifts, or structure morphs — the probability landscape changes. What once looked like a clean setup can begin to deteriorate. Conversely, something that looked uncertain can start aligning into high-probability territory.
Yet many traders fail to adapt because they’re emotionally invested in the original plan.
They’ve already “decided” what the market should do, so they stop listening to what the market is actually doing.
________________________________________
🧠 Dynamic Probabilities Require Dynamic Thinking
To trade dynamically, you must be able to update your internal odds in real time.
This doesn’t mean constantly second-guessing or overanalyzing — it means refining your bias based on evolving context:
• A strong breakout followed by weak continuation? → probability drops.
• Price holding above broken resistance with clean structure? → probability increases.
• Choppy pullback into support with fading volume? → potential reversal builds.
It’s like playing poker: you might start with a good hand, but if the flop goes against you, your odds change.
If you ignore that and keep betting like you’ve got the nuts, you’re not being bold — you’re being blind.
________________________________________
📍 Back to the Gold Trade
In the Gold trade, the initial short was based on structure: broken support turned resistance.
The entry was mechanical, the reaction was clean. All good.
But then:
• Price came back fast into the same zone.
• Sellers failed to defend it decisively.
• The second leg down was sluggish, overlapping, and lacked momentum.
• Compression began to form.
That’s when the probability of continued downside collapsed — and the probability of a reversal increased.
The market had changed. So did my bias.
That’s dynamic probability in action — not because of a feeling, but because of evolving evidence.
________________________________________
🧘♂️ The Psychological Trap
Many traders intellectually accept the idea of being flexible — but emotionally, they cling to certainty.
They fear being “inconsistent” more than they fear being wrong.
But in a dynamic environment, consistency of thinking is not about repeating the same action — it’s about consistently reacting to what’s real.
True consistency is not mechanical repetition. It’s mental adaptability grounded in logic.
________________________________________
🧠 Takeaway
If you want to trade professionally, you must upgrade your mindset from fixed-probability execution to fluid-probability reasoning.
That doesn’t mean chaos. It means structured flexibility.
Your edge isn’t just in spotting patterns — it’s in knowing when those patterns are breaking down.
And acting accordingly, before your PnL does it for you.
Disclosure: I am part of TradeNation's Influencer program and receive a monthly fee for using their TradingView charts in my analyses and educational articles.
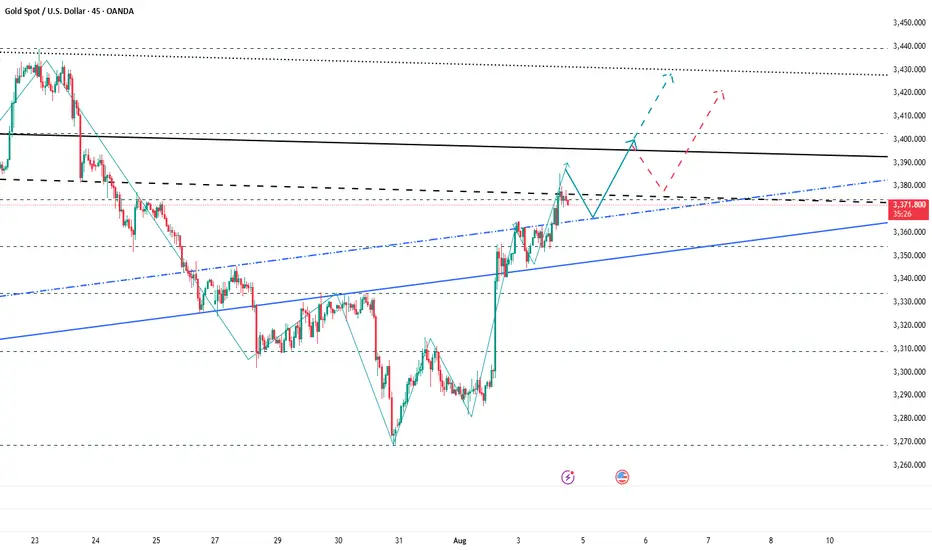
Bullish Trend with Clear Support & Resistance LevelsGold Price Action: Bullish Trend & Key Levels 🟡📈
This 30-minute chart provides a clear overview of the current price action for Gold (CFDs), with well-defined support and resistance levels. Let’s break down the key aspects of the chart and the possible trade opportunities. 💹
Key Observations:
📉 Support: The price has been bouncing off the lower boundary at $3,304.185, indicating a strong buying interest in this zone. A solid level to watch for bullish opportunities.
📈 Resistance: At $3,393.220, the price has faced difficulty breaking above, marking a critical sell zone if the price struggles to rise past it.
🔵 Trendline: The upward trendline highlights that price action is making higher lows, signaling a bullish trend overall.
Trade Opportunities:
🔼 Bullish Signal: If the price stays above the trendline and support zone, there’s a strong chance it will test the resistance around $3,393, presenting a potential buy opportunity.
🔽 Bearish Signal: A break below the support level could signal a possible downtrend, with sell opportunities towards the next support at $3,300 or lower.

Next Stop 3420? Gold Bulls Push the LimitBecause the U.S. non-farm payroll report performed worse than expected, gold rebounded strongly last Friday and recovered half of its losses in one fell swoop. The bulls returned strongly. Today, after consolidating at a high level, gold continued to choose to break upward, reaching a high of around 3385.
There is no doubt that bullish forces still hold the upper hand. From a fundamental perspective, the Federal Reserve is currently facing greater pressure to cut interest rates; and it can also be clearly seen from the candlestick chart that a significant "W"-shaped double bottom structure has been constructed near 3268 and 3280, which has limited the gold's retracement space while also playing a key structural support role in the rise of gold. With the combined effects of news and technical factors, gold still has the potential to continue its upward trend. And I think there is still a great possibility that gold will test the 3400 mark again. Once gold stabilizes at 3400, it will definitely hit the 3420-3430 area.
As the center of gravity of gold gradually shifts upward, the lower support area also moves up. The current short-term support is obviously in the 3365-3355 area, while the relatively strong support is in the 3345-3335 area. According to the current pattern structure, the bulls may not allow gold to retreat to the 3345-3335 area. So in terms of short-term trading, we first consider the opportunity to enter long positions in the 3365-3355 area!
GOLD: Strong Bullish Sentiment! Long!
My dear friends,
Today we will analyse GOLD together☺️
The recent price action suggests a shift in mid-term momentum. A break above the current local range around 3,296.556 will confirm the new direction upwards with the target being the next key level of 3,310.375 and a reconvened placement of a stop-loss beyond the range.
❤️Sending you lots of Love and Hugs❤️

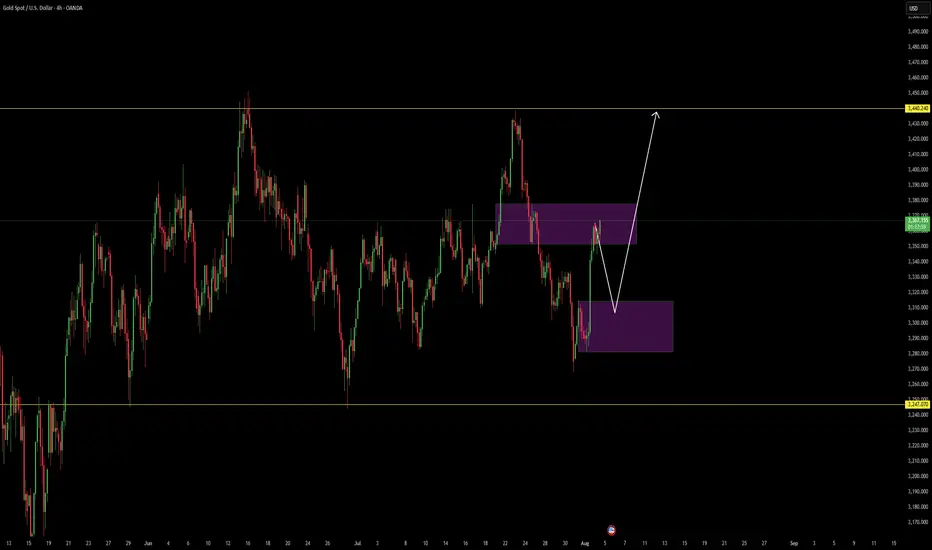
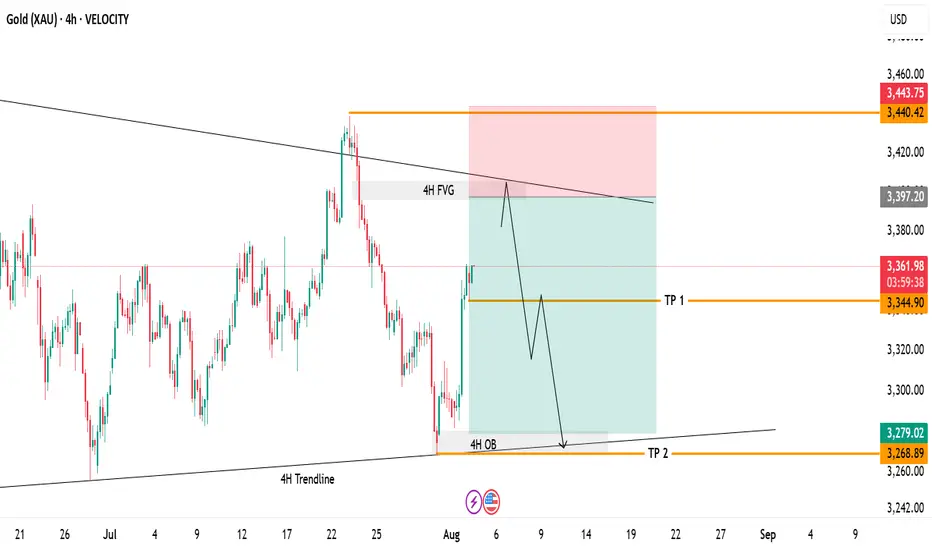
Gold 4H Swing Trade Setup!Currently watching price action as it approaches the 4H Fair Value Gap and descending trendline resistance. Price has not tapped this zone yet, and a move higher into this area could set up a potential reversal.
Setup Highlights:
4H FVG: 3,397–3,400 – Main area of interest.
Trendline Resistance: Confluence zone to watch for rejection.
Plan: Waiting for price to fill the imbalance and test the resistance before considering short entries.
Targets if Rejection Occurs:
TP1: 3,344 – First partial target.
TP2: 3,268 – 4H OB retest.
Invalidation:
A clear breakout and hold above 3,440 would invalidate the bearish scenario.
Bullish Break of Structure on 4H XAUUSD – Targeting 3451.525 Price broke structure to the upside on the 4H chart, showing bullish intent. I expect price to continue higher toward the 3451.525 level, which looks like a key liquidity area. As long as price holds above the break, the bias remains bullish.
GOLD REMAINS UNDER PRESSURE AFTER U.S. INFLATION DATA📊 Market Overview:
Gold is trading around $3294, down from $3311 earlier after U.S. Core PCE and Employment Cost Index came in as expected — reinforcing the Fed's hawkish stance. A stronger dollar and rising Treasury yields continue to weigh on gold.
📉 Technical Analysis:
• Key resistance: $3302 – $3305
• Nearest support: $3285 – $3275
• EMA09 (H1): Price is below the 9-period EMA → short-term trend remains bearish
• Candlestick / volume / momentum: After the sharp drop, price is consolidating between $3293–$3298 with low volume. Failure to break above $3302 may trigger further downside. RSI near 45 suggests room for more selling.
📌 Outlook:
Gold may continue to decline in the short term if it fails to reclaim $3302 and the dollar remains strong through the Asian and European sessions.
💡 Suggested Trade Setup:
🔻 SELL XAU/USD: $3296 – $3298
🎯 TP: $3280 / $3275
❌ SL: $3305
🔺 BUY XAU/USD: $3275 – $3278 (if reversal candle appears)
🎯 TP: $3295
❌ SL: $3270

Gold’s Next Move: Bounce or Breakdown?Gold is pulling back after breaking the 3,360 USD resistance on the 6-hour chart. Price is currently testing the nearest fair value gap (3,370–3,380), but upside momentum is stalling, partly due to unfilled supply zones above.
A retest of the lower FVG near 3,340 will be key. Holding above this level could trigger renewed buying, while a break below may invalidate the bullish structure.
Traders should closely monitor whether downside gaps continue to fill and how price behaves near support zones. Lack of strong liquidity could lead to a false breakout.

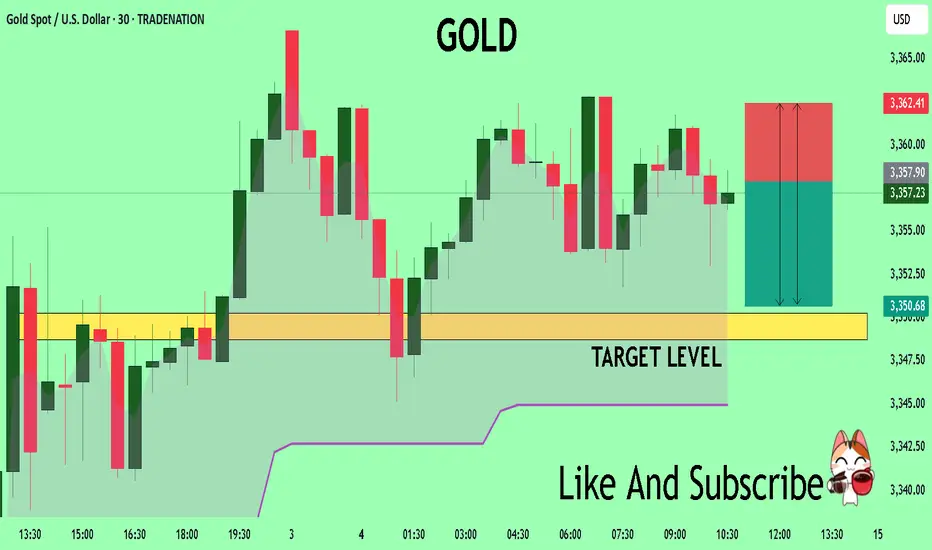
GOLD A Fall Expected! SELL!
My dear subscribers,
My technical analysis for GOLD is below:
The price is coiling around a solid key level - 3358.0
Bias - Bearish
Technical Indicators: Pivot Points Low anticipates a potential price reversal.
Super trend shows a clear sell, giving a perfect indicators' convergence.
Goal - 3350.7
My Stop Loss - 3362.4
About Used Indicators:
By the very nature of the supertrend indicator, it offers firm support and resistance levels for traders to enter and exit trades. Additionally, it also provides signals for setting stop losses
Disclosure: I am part of Trade Nation's Influencer program and receive a monthly fee for using their TradingView charts in my analysis.
———————————
WISH YOU ALL LUCK
We remain bullish on gold prices today—3400+.We remain bullish on gold prices today—3400+.
As shown in Figure 4h, gold prices are actively breaking through.
Currently, the upper resistance level for gold is 3385-3390.
Going long at low prices is a good strategy.
We exited yesterday at 3380 and entered today around 3350-3360, achieving very stable profits.
Current support level for gold: 3350-3360.
Gold prices have now resumed their upward trend, indicating that bullish sentiment has returned to the primary upward trend.
Bullish sentiment will continue to strengthen.
Our target price for gold remains above 3400.
Day Trading Strategy:
1: Swing Strategy: 3350-3385 (Buy Low, Sell High)
2: Low-Price Long Strategy
Buy: 3350-3360-3370
Stop Loss: 3345
Target: 3380-3400
3: High-Price Short Strategy: (Caution is advised when trading short positions; avoid short positions)

Volume. supportAlthough gold has made a downward segment overlap and the priority should be on a decline, due to Trump's trade wars and geopolitical tensions, I believe that after a pullback to the buyer zone of 3280–3315, gold will continue to rise.