BuyRejection Level
Daily Volume
Market Structure Shift
Asian Session
Trend Line Break
Untapped Order Point
GOLDCFD trade ideas
GOLD 1H CHART ROUTE MAP UPDATEHey Everyone,
Great finish to the week with our chart ideas playing out, as analysed.
We completed all our Bullish targets on this chart with ema5 cross and lock confirmation. We were also able to step away today after the final target with no further ema5 cross and lock, confirming the rejection that we are seeing now.
BULLISH TARGET
3356 - DONE
EMA5 CROSS AND LOCK ABOVE 3356 WILL OPEN THE FOLLOWING BULLISH TARGETS
3381 - DONE
EMA5 CROSS AND LOCK ABOVE 3381 WILL OPEN THE FOLLOWING BULLISH TARGET
3404 - DONE
EMA5 CROSS AND LOCK ABOVE 3404 WILL OPEN THE FOLLOWING BULLISH TARGET
3424 - DONE
EMA5 CROSS AND LOCK ABOVE 3424 WILL OPEN THE FOLLOWING BULLISH TARGET
3439 - DONE
We will now come back Sunday with a full multi timeframe analysis to prepare for next week’s setups, including updated views on the higher timeframes, EMA alignments, and structure expectations going forward.
Thanks again for all your likes, comments, and follows.
Wishing you all a fantastic weekend!!
Mr Gold
GoldViewFX

GOLD Slips as Dollar Gains on Trade Deal – Bearish Below 3349
Gold Pares Gains as USD Strengthens on Trade Deal Ahead of Fed
Gold gave up early gains, pressured by a stronger U.S. dollar after the announcement of the US–EU trade agreement.
Meanwhile, attention shifts to upcoming U.S.–China negotiations later today, as both sides aim to extend the current trade truce and avoid new tariffs.
Investors are also closely watching the Federal Reserve’s policy decision on Wednesday, seeking signals on future interest rate moves.
TECHNICAL OUTLOOK:
Gold maintains a bearish trend while trading below 3349, with potential downside toward 3320.
A 1H candle close below 3320 – 3312 would confirm extended bearish pressure targeting 3285, driven in part by ongoing geopolitical risks.
⚠️ To shift back to a bullish structure, the price must stabilize above 3349.
Key Levels:
• Support: 3320 – 3285 – 3256
• Resistance: 3365 – 3375

GOLD BUY TRADE IDEA🟡 XAU/USD Smart Money Setup – July 31, 2025
🔍 Key Technical Highlights:
• Demand Zone Entry:
• Price has tapped into a clear demand zone (gray box) around 3,274 – 3,290, signaling potential institutional accumulation.
• The previous inducement low has been swept, aligning with Smart Money Concepts (SMC).
• Liquidity Engineering:
• Equal highs (liquidity pool) visible from late June remain uncollected — a prime upside target.
• Price structure shows internal BOS, suggesting a shift in market sentiment.
• Expected Path:
• A potential multi-leg bullish move is mapped out, targeting the 3,440+ premium zone, completing imbalance fill and stop-run above highs.
• Risk-Reward:
• Stop loss sits just below the demand zone (~3,274), maintaining a favorable risk-to-reward ratio.
⸻
🧠 Smart Money Flow Narrative:
1. Sweep of inducement lows triggers institutional entries.
2. Demand zone holds with bullish reaction — confirmation of intent.
3. Expect higher highs and a rally toward uncollected liquidity above 3,440.
4. Low-risk buy opportunity for both swing and intraday traders.

XAUUSD – The assassin returnsGold is showing a weak reaction around the 3,375 zone — a previous supply area — with RSI dipping into oversold territory but failing to bounce significantly. The chart reveals layered FVG traps, hinting at a potential -1.5% drop toward 3,324 within the next 18 hours.
Bearish catalyst: The U.S. jobless claims have dropped to a 3-month low → labor market remains strong → Fed likely to keep interest rates high → stronger USD, weaker gold.
Preferred setup:
SELL if price gets rejected at 3,375
SL: 3,390
TP: 3,324 – 3,310

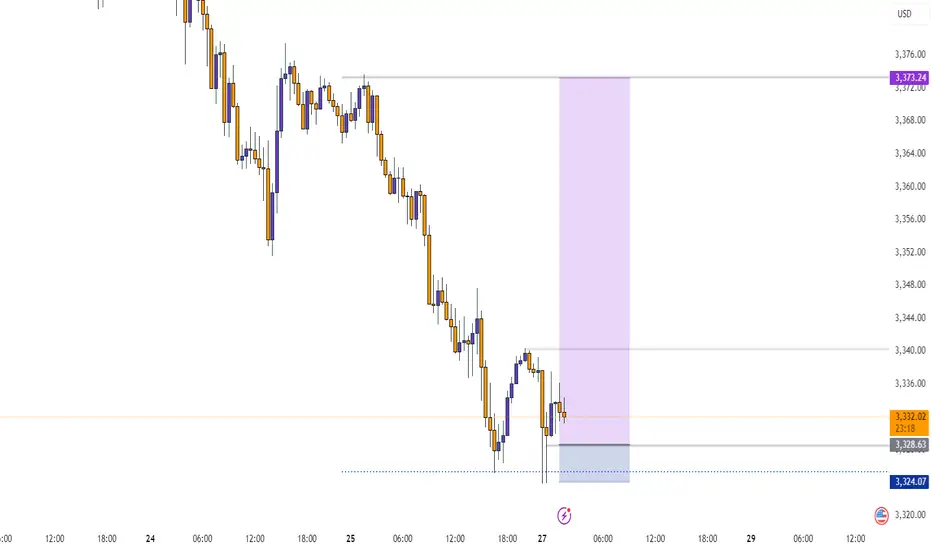
Gold Next Move (Read description). Hello, Traders.
As you saw we have achieved our target at last ideas.
This week gold is running in down trend, today it has touched the price 3268 and then gold pumped.
As you see guys, gold has breakout the last support area and its support became resistance.
Gold has changed the character according to H1 and there is break of structure (BOS).
The trend is bearish, so gold needs to fall, it can fall till 3351.
Comment positive feedbacks, Thanks.

Gold Eliot analysis My predictions about gold in previous years have been quite accurate and calculated. Currently, I think a wave 4 correction, which is a micro-wave, is taking place. As we can see, this micro-wave will probably decrease between $2,700 and $3,000 and then advance to targets above $4,000. Majid Babaei Tehran August 1404

XAU intra?
Hi ,
Broke low at 3305/04 yesterday.
Made low below 3300
Now retesting this area. Good place to place a ticket.
All the best
Not a guru

GOLD awaiting confirmation of a bullish zone formation.Gold has confirmed support at 3310, with the price rebounding and returning to the buying side. We are now awaiting confirmation of a bullish zone formation.
Gold remains under pressure ahead of key market-moving events, including the US GDP data release and the Federal Reserve’s interest rate decision. However, the pause in Dollar strength is offering some support to the gold price. As long as the price holds above this level, the bullish scenario remains valid. A sustained move above this zone may open the path toward the next resistances: 3360 / 3385 we can expect Growth more.
You May find more Details in the Chart.
Trade wisely best of Luck Buddies.
Ps: Support with like and comments for more insights Thanks for Supporting.

Gold (XAUUSD) Buy Setup – 30m Gold (XAUUSD) Buy Setup – 30m Chart
I am in a buy from 3307. Price is holding the support zone 3326–3334.
Looking for a bounce towards 3338 and 3375.
Stop loss below 3290.

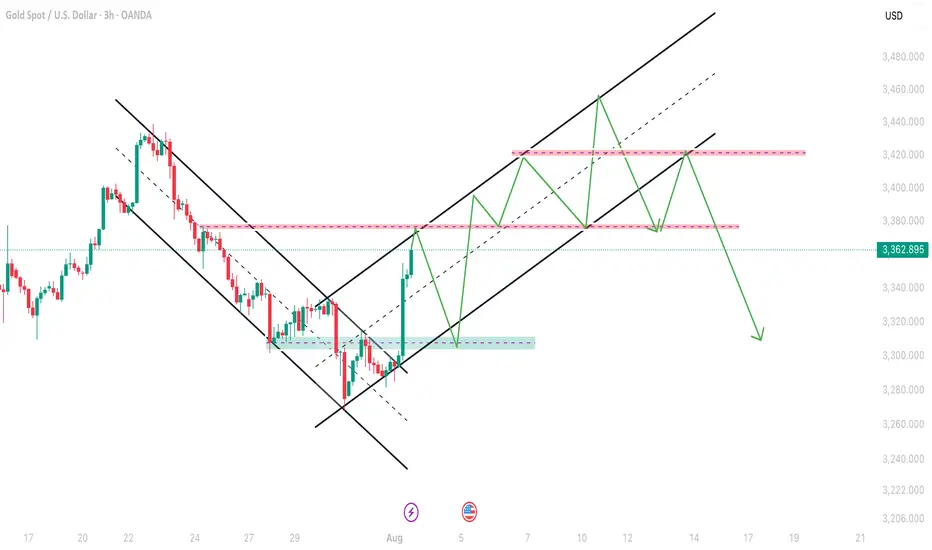
Gold next prediction Aug 4 onwardsAs you can see in this chart gold was moving in a downtrend channel and after a big breakout in Non-Farm Gold moves to 3362 so now it will make a new Bullish channel in which first hurdle will be 3374-3380 and then can retrace till 3H and 4H chock point and then can continue to bullish side overall move can be done upto 3452-3460 which is last resistance of the market as my analysis this can be plan A.I will update about Plan B in my next analysis.
Will Upcoming Data Determine the Next Gold's Direction?Macro approach:
- Gold retreated this week, reversing early gains to trade near four-week lows amid renewed US dollar strength and caution ahead of the Fed's policy decision.
- The retreat was mainly pressured by stronger-than-expected US economic data and a tentative revival in risk appetite, offsetting pockets of safe-haven demand.
- Key drivers included robust US GDP growth for 2Q, a bounce in consumer confidence, and the Fed's steady rates with a more hawkish tone, suggesting cuts may be further out.
- Meanwhile, recent US-EU and US-China trade deals eased some global uncertainty, damping gold's appeal as a hedge.
- Market participants also eyed the labor market's continued cooling, but resilient consumer spending further buoyed the dollar.
- Gold may remain volatile, with potential upside if upcoming US PCE inflation and NFP reports disappoint expectations. Any escalation in trade tensions or signals of Fed policy easing could renew support for gold prices.
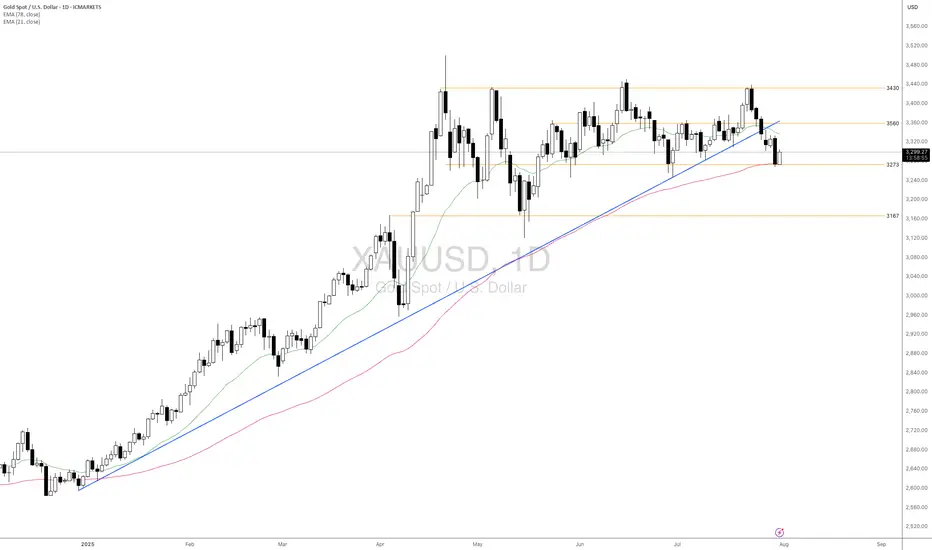
Technical approach:
- XAUUSD fluctuated within the range of 3285-3560, which is below the broken ascending trendline. The price between the two EMAs awaits an apparent breakout to determine the next trend.
- If XAUUSD breaks below the support at 3273, confluence with EMA78, the price may plunge to retest the following support at 3167.
- On the contrary, remaining above the support at 3273 may lead XAUUSD to retest the resistance at around 3560.
Analysis by: Dat Tong, Senior Financial Markets Strategist at Exness
GOLD (XAUUSD) -Monthly Analysis & Trading Plan (Aug 2025)GOLD (XAUUSD) -Monthly Analysis & Trading Plan (Aug 2025)
Title: XAUUSD: Correction in Progress, Patience is Key for the Next Move
Chart: XAUUSD Monthly (1M)
Analysis Type: ICT/SMC, Price Action, & Moving Average
Summary:
After a historic and powerful bull run that saw Gold (XAUUSD) breach all-time highs in the first half of 2025, the market has entered a significant corrective phase. The massive red candle in June signaled a strong reversal of momentum, and the current July candle confirms that sellers remain in control, albeit with less intensity. This is a critical juncture for long-term traders, and a strategic approach is required.
Key Observations & Analysis
1. **Price Action & Market Structure:**
The move from late 2024 through May 2025 was a textbook "impulsive leg." The sharp reversal in June 2025, with a powerful bearish candle, likely acted as a **liquidity grab** or a **high-volume distribution event**, trapping late buyers. The market is now in a clear **break in market structure (BOS)** to the downside on this long-term timeframe, suggesting the correction is not over.
2. **ICT/SMC Concepts:**
* **Imbalance/Fair Value Gap (FVG):** The rapid bullish move created significant imbalances on the monthly chart. Price often returns to fill these gaps. The current correction is likely heading to fill or test these inefficiencies.
* **Order Block (OB):** The massive bullish move in late 2024/early 2025 likely created a strong bullish order block. The current sell-off is heading toward this potential institutional demand zone.
* **Liquidity:** The lows from late 2024 and early 2025 will be key liquidity pools. Smart money will likely be targeting these areas for a potential reversal or accumulation.
3. **Moving Average Analysis (MMA):**
* The price is currently trading above both the purple and yellow moving averages, which are still pointing upward. This confirms the long-term trend remains bullish, and the current move is a correction within that trend.
* The **purple moving average** is a key support level to watch. A test of this level would be a high-probability event, and its reaction will be crucial for the next major move.
Suggested Entry & Exit Levels
1. Aggressive Entry (Short)
Rationale
The bearish momentum, though slowing, is still the dominant force. An aggressive trader could look for a continuation of the short-term bearish trend.
Entry/b]
A short entry could be considered on a pullback to the recent highs around **$3,400 - $3,500** if a strong bearish candlestick pattern forms on a lower timeframe (e.g., weekly or daily).
Stop Loss
A tight stop-loss placed just above the recent high, for example, **$3,600**. This is a high-risk entry, so position sizing should be small.
Target
The first major target would be the **moving average support level**, roughly in the **$3,000 - $3,100** zone. The ultimate target for a full correction would be the order block from late 2024, around **$2,800**.
2. Conservative Entry (Long)
Rationale
The long-term trend is still bullish. The current move is a correction. The most prudent approach is to wait for a high-probability long entry at a key support level.
Entry/b]
Wait for price to reach the **purple moving average support zone (around $3,000 - $3,100)**. Look for a clear reversal signal on this level, such as a large bullish "pin bar" or "engulfing candle" on the monthly or weekly chart. This would be a high-probability demand zone for a reversal.
Stop Loss
A stop-loss should be placed below this key support level, perhaps around **$2,850 - $2,900**, giving the trade room to breathe.
Target
The first target for a new bullish leg would be the New swing high around **$3,800**. The ultimate long-term target would be a new all-time high above **$4,000**.
Conclusion
The Gold market is in a crucial phase. The bullish party from earlier in 2025 is over for now, and a healthy correction is underway. **The most logical and safe approach is to wait for the market to complete its corrective move.** Do not attempt to catch a falling knife. Instead, be patient and wait for price to reach a key institutional demand zone (our moving average support or the late 2024 order block) and show a clear sign of reversal. This will present a high-probability, low-risk long entry for the next impulsive move up.
Disclaimer
This is not financial advice. Please perform your own due diligence and risk management. Trading involves a significant risk of loss.

XAUUSD Does it need to test the 1D MA100 first?Gold (XAUUSD) is attempting to break below its Triangle formation just 4 days after marginally breaking above it. This has invalidated that pattern so after breaking also below its 1D MA50 (blue trend-line), it could technically go for a 1D MA100 (green trend-line) test for the first time since January 06 2025.
If it does, there will be more probabilities for a stronger than before rebound to make a new High. Our Targe is the 2.0 Fibonacci extension at $3620.
Keep also an eye on the 1D RSI Buy Zone, which has been giving the most optimal buy signals since April 07 2025.
-------------------------------------------------------------------------------
** Please LIKE 👍, FOLLOW ✅, SHARE 🙌 and COMMENT ✍ if you enjoy this idea! Also share your ideas and charts in the comments section below! This is best way to keep it relevant, support us, keep the content here free and allow the idea to reach as many people as possible. **
-------------------------------------------------------------------------------
Disclosure: I am part of Trade Nation's Influencer program and receive a monthly fee for using their TradingView charts in my analysis.
💸💸💸💸💸💸
👇 👇 👇 👇 👇 👇

XAUUSD H4 Update – The Battle Has Moved to 3350
“From deep demand to key supply. The next move is decisive.”
🔸 Sunday Plan Recap
Price was falling aggressively into the HTF demand zone (3265–3240).
The plan anticipated a bounce only if that deep zone held.
Above price, major zones included:
3314 – mid-structure
3330–3345 – supply zone
3368–3380 – final retracement targets
🔸 What Changed?
✅ The deep demand zone worked — H4 CHoCH bullish was confirmed.
✅ Price climbed through 3285 and 3314, confirming a retracement leg.
🔥 Now, price sits at 3349.57, testing the same supply zone marked in Sunday’s plan (3330–3345).
🔸 Current H4 Structure
🔼 Short-term bias = bullish retracement
📍 Price = inside HTF premium zone
📈 EMAs aligned bullish (5/21/50), confirming short-term momentum
💡 RSI = approaching overbought
⚔️ Liquidity above 3355, trapped shorts below 3314
🧠 Today’s Battle Plan (August 1)
🔴 Sell Zone (live) – 3345 to 3355
Price just entered the key H4 supply zone. Watch for rejection signs:
Bearish confirmation needed (e.g. M15/M30 CHoCH or engulfing)
If confirmed → downside targets: 3314 → 3285 → 3265
High RR short only if structure confirms
🔵 Breakout Bullish Case
If 3355 breaks with a clean body + HL at 3340 → bullish continuation active
Next upside target: 3368 → 3380
🧭 Final Thoughts
We’ve reached the exact decision zone from Sunday’s plan.
The market will now reveal: retracement over... or breakout coming?
Patience is key — this is a high RR zone, but only if structure reacts.
💬 Did you catch the move from deep demand? Or waiting for confirmation here at supply?
📈 Share your thoughts in the comments and let’s break it down together.
🔔 Follow for real-time market insights, sniper plans, and structured trading logic you can trust.
❤️ Like if you enjoy clean, actionable updates🚀🚀🚀
🔁 Share with traders who love structure over noise
📉 Price data from Trade Nation feed

#XAUUSD: Gold is likely to create a record highGold will be bullish since the US and Russia tension rises, creating uncertainty within the global investors. As of now gold rejected nicely due to negative NFP data affected the US Dollar. We have now two strong fundamentals views that is supporting our view. Please use accurate risk management while trading gold.
Good luck and trade safe. Please like and share for more
Team Setupsfx

Gold - The clear top formation!🪙Gold ( TVC:GOLD ) just created a top formation:
🔎Analysis summary:
Over the past four months, Gold has overall been moving sideways. Following a previous blow-off rally of about +25%, this cycle is very similar to the 2008 bullish cycle. Bulls are starting to slow down which will most likely result in the creation of at least a short term top formation.
📝Levels to watch:
$3.000
🙏🏻#LONGTERMVISION
Philip - Swing Trader

Gold breaks price channel, officially starts falling✏️ OANDA:XAUUSD price has officially broken the bullish wave structure and broken the bullish channel. A corrective downtrend has begun to form. If there is a pull back to the trendline today, it is considered a good opportunity for sell signals.
The liquidity zone 3250 is the target of this corrective downtrend. The 3283 zone also has to wait for confirmation because when the market falls and the momentum of the decline, the number of FOMO sellers will be very strong. The opposite direction is when closing back above 3375, Gold will return to the uptrend.
📉 Key Levels
SELL zone 3343-3345
Target: 3250
BUY trigger: Rejection candle 3285
Buy zone: 3251
Leave your comments on the idea. I am happy to read your views.

XAUUSD FULL WEEKLY STRUCTURE MAPHello traders! 🌟
We’re stepping into a pivotal week for gold (XAUUSD), and the weekly chart tells a story of tension, liquidity hunts, and potential big moves. Let’s dive into the three truly critical zones, backed by SMC/ICT logic, Fibonacci, EMAs, RSI, and fair‑value gaps — all in one elegant map. 🎨✨
🔹 HTF Overview & Macro Pulse
Current Price: 3336
Weekly Trend: Bullish overall, but momentum is fading as price coils under premium highs.
EMAs (5/21/50/200):
EMA5 & EMA21 are flattening beneath price, hinting at stall.
EMA50 sitting near 3120 as a deep support magnet.
RSI (Weekly): Cooling from ~75 down to ~66, showing bearish divergence vs those upper wicks.
Fair‑Value Gaps:
Unfilled 3365–3405 zone above — institutional imbalance still waiting.
Partially filled 3280–3320 below — common reaction pocket.
Fibonacci Extensions (1984 → 3365 high): 127.2% at 3405, 161.8% at 3439 — the exact top of our supply wick.
Macro Catalysts This Week
Wed (Jul 30): FOMC + Fed Statement
Thu (Jul 31): Core PCE + Unemployment Claims
Fri (Aug 1): NFP + ISM Manufacturing
Prepare for violent spikes into one of our zones — then trade the reaction.
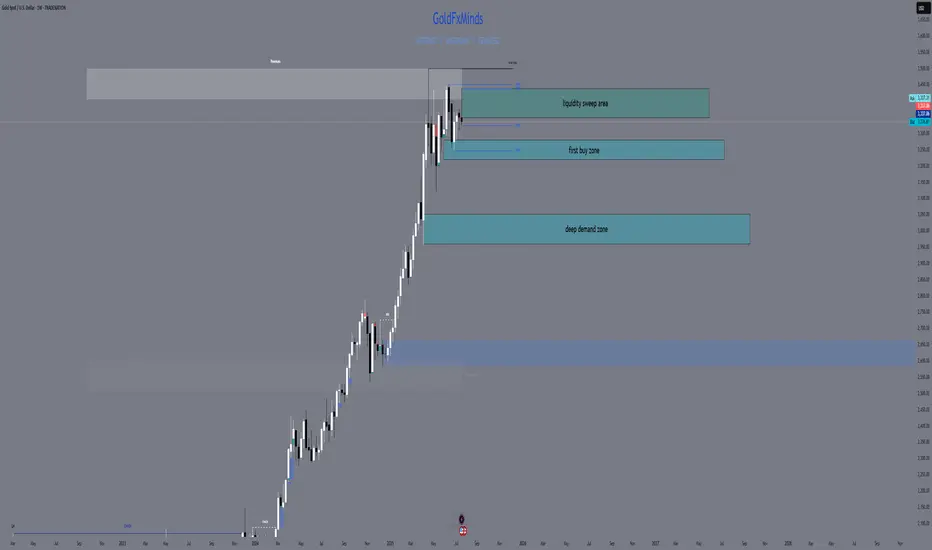
🔸 The Three TRUE Weekly Zones
W1 Supply (Ultimate Wick Zone)
🔥 3350 – 3439
This entire wick from May–July is YOUR one and only supply zone on weekly.
Pure liquidity sweep area
Confluence: unfilled fair‑value gap, 127–161.8% Fib, RSI divergence
Every touch here is a short‑trap until we see a full weekly close above 3439.
W1 Demand (Primary Buy Zone)
🌊 3220 – 3285
The last robust order block & BOS base before gold ran vertical.
Confluence: filled FVG, weekly OB body, EMA21 target, RSI back at 50
Ideal sniper entry after a news‑driven sell‑off into this range.
Deep Discount Block
🛡️ 2960 – 3050
The origin of the full 2024–2025 bull trend — true institutional accumulation.
Confluence: March 2024 CHoCH base, EMA50/200 proximity, 78.6–88.6% Fib retrace
Only for a major quarterly reset; not on the immediate radar unless USD spikes dramatically.
🧭 Strategy & Execution
Short Bias: Wait for a liquidity spike into 3350–3439 (likely around FOMC/NFP), then watch for a clean rejection candle.
Long Bias: After a thrust down into 3220–3285, look for wick‑based rejection plus EMA21 hold and a bullish engulf on weekly.
Avoid the mid‑zone between 3285–3350 — that’s noise, not structure.
Patience is everything. Let price sweep, then let us strike. The real power trades this week will be born from clear structure — not guesswork.
💬 What’s your favorite zone to watch? Drop a comment below!
👍 Smash that like🚀🚀🚀 if you found this map helpful, and hit follow for more GoldFxMinds sniper blueprints.
Disclosure: Analysis based on Trade Nation’s TradingView feed. I’m part of their Influencer Program.
GoldFxMinds 💛
Gold Price Outlook: Bearish Trend DevelopingGold has broken below key top resistance, indicating potential for continued downside movement.
The US Dollar's recent rise has slowed amid renewed concerns about the US-China trade truce and profit-taking ahead of this week’s key employment data, following already strong GDP and ADP reports. While the dollar remains supported overall, uncertainty is capping its momentum, indirectly adding short-term volatility to gold.
The price action suggests a bearish breakout from key resistance zones. Momentum is building toward the downside, indicating the market could continue lower unless strong support levels hold. A potential bearish flag or breakdown structure is forming, and if confirmed, we may see a decline toward next support zones.
📍 Key Levels to Watch:
Resistance: 3310 / 3320
Support: 3269 / 3240
If gold remains below the broken resistance and fails to reclaim 3320, the bearish pressure is likely to continue. Watch upcoming employment data as it could add volatility and confirm the direction.
You may find more details in the chart.
Ps: Support with like and comments for better analysis Thanks.

Gold Under Pressure – Temporary Pullback or Start of a DowntrendHello everyone, great to see you again.
Today, let’s focus on the bearish factors surrounding gold. At the time of writing, gold is trading around 3,331 USD, down 50 pips on the day, continuing its downward correction since the end of last week.
Within just a few days, gold has plunged from its peak of 3,433 USD—losing nearly 100 USD per ounce.
This sharp drop is largely driven by profit-taking and market anticipation ahead of key economic data next week, including U.S. interest rate decisions, inflation, and job reports.
This week is packed with critical updates: growth figures, inflation stats, employment numbers, and monetary policy decisions from major central banks—all of which could significantly impact gold’s next move.
According to a recent survey, 36% of analysts expect gold to fall further, while retail investors remain optimistic about a rebound.
For now, the market is clearly in a correction phase. Caution is advised.
What do you think—will gold bounce back or continue to drop?

#3,377.80 Resistance remains strongMy position: I have Bought Gold many times above #3,400.80 benchmark however as it got invalidated, I Bought #3,390.80 again late U.S. session and closed my set of Buying orders on #3,395.80 nearby extension. I left one runner (#3,390.80 entry point) with Stop on breakeven expecting Asian session to recover #3,400.80 benchmark, however it was closed on break-even as Gold extended Selling sequence. I will continue Selling every High's on Gold and if #3,357.80 gives away, expect #3,352.80 and #3,342.80 contact points to be met.
As expected Gold delivered excellent #3,372.80 and especially #3,365.80 - #3,352.80 Selling opportunities throughout yesterday's session which I utilized to it's maximum. I have also Bought Gold on late U.S. session with #3,372.80 as an entry point / however since Gold was ranging, I closed my order on break-even and met Gold below #3,352.80 benchmark this morning personally on my surprise (I did expected #3,377.80 to be invalidated to the upside).
Technical analysis: Gold’s Price-action is performing well below both the Hourly 4 chart’s and Daily chart’s Resistance zones for the cycle. Selling direction of today’s session is directly correlated with Fundamentals leaving the scene which found Sellers near the Intra-day #3,377.80 Resistance and most likely DX will close the Trading week in green, however struggling to make Bullish comeback and if #3,327.80 - #3,342.80 reverses the Selling motion, Gold’s Daily chart’s healthy Technicals which preserved core uptrend values. If the Price-action gets rejected at #3,352.80 - #3,357.80 Resistance zone, then further decline (under conditions where I will have more information with U.S.’s session candle) is possible and cannot be ruled out. Notice that at the same time and manner, Bond Yields are on consecutive Selling spree as well which Fundamentally has a diagonal correlation with Gold. The slightest uptrend continuation there, should add enormous Selling pressure on Gold.
My position: I am Highly satisfied with recent results and will take early weekend break (no need to Trade more). If however you decide to Trade today, Sell every High's on Gold / no Buying until Monday's session (my practical suggestion).

XAUUSD – Is gold getting ready to bounce?Right now, gold is reacting around the 3,280 support zone after breaking down from its previous ascending channel. While the broader trend is still under bearish pressure, the recently released JOLTS data came in lower than expected, signaling that the U.S. labor market may be cooling — a mildly positive sign for gold.
From a technical view, price is showing signs of forming a short-term bottom near 3,229 and is starting to rebound. If gold can hold above this support and break through 3,339, a recovery toward the 3,360–3,400 zone could unfold.
That said, this bounce is likely just a technical correction. Without more bearish news for the dollar, gold still risks being rejected around the FVG area and heading lower again.
Trading idea: Consider short-term Buy opportunities if price stays above 3,280 and forms a clear reversal pattern. Stop-loss below 3,229. Short-term targets: 3,339–3,360.
What about you? Leaning towards buying the dip or staying with the downtrend?
