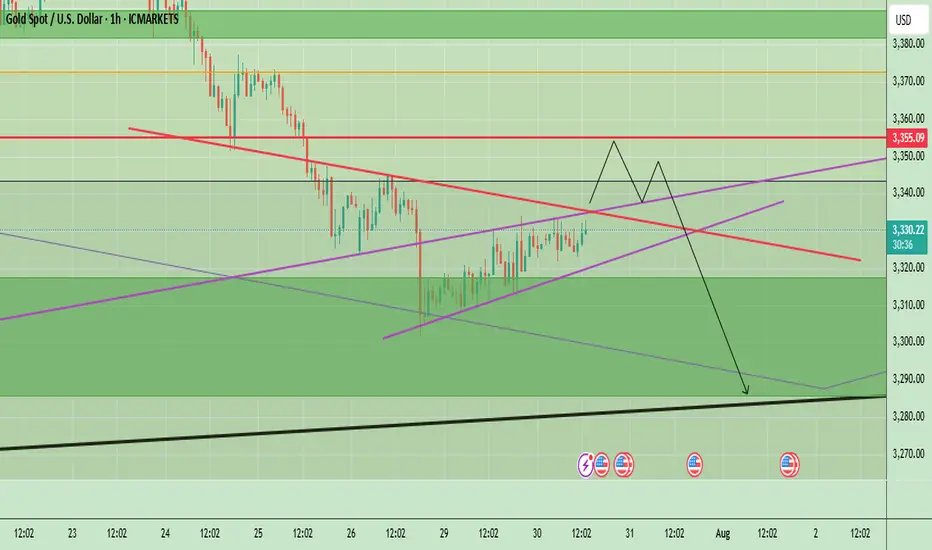
Gold Awaits Fed Rate Decision – Key Levels & Volatility AheadGold is currently trading near $3,332, showing a minor recovery after recent downward momentum. The price action on the 1-hour chart highlights a short-term ascending structure, which often acts as a corrective move rather than a strong bullish trend. The market previously saw significant selling pressure from above $3,355–$3,360, creating a short-term supply zone. Unless the price breaks and holds above this zone, the overall momentum remains bearish.
The chart also shows a projected price path where gold could push slightly higher toward $3,355, meet resistance, and potentially reverse downward again. Key support lies at $3,320, and if this breaks, we could see gold testing $3,290–$3,280 levels, aligning with the black trend line support. However, if bulls manage to break above $3,360, it would signal potential upside continuation toward $3,380–$3,400.
Key Points
- Key Resistance Levels: $3,355 and $3,360 (critical supply zone).
- Key Support Levels: $3,320 (short-term), followed by $3,290–$3,280 (major trendline support).
- Expected Short-Term Move: Possible push toward $3,355 → rejection → decline back toward $3,320 and possibly $3,290.
Bullish Breakout Scenario: A strong close above $3,360 could push price toward $3,380–$3,400.
Overall Bias: Bearish while trading below $3,360.
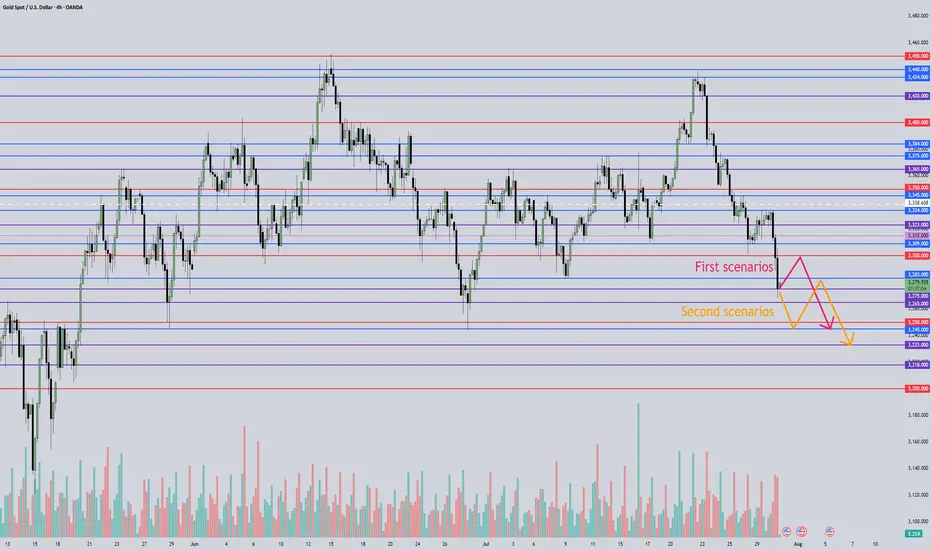
4hr Chart
Price remains under pressure below the descending trendline. A small pullback toward $3,345–$3,350 is possible, but as long as price stays under this resistance, the bias remains bearish with potential downside targets around $3,300–$3,280.
Key Levels:
- Resistance: $3,350 → $3,381 → $3,394
- Support: $3,324 → $3,281 → $3,254
Today’s FOMC interest rate decision is a key driver for Gold. Here’s the quick analysis:
- If Fed Hikes Rates or Maintains Hawkish Tone:
- Strong USD likely → Gold could face more selling pressure.
- Key support zones: $3,324 – $3,300, then $3,281 and $3,254.
- If Fed Pauses or Turns Dovish:
- Dollar weakens → Gold may bounce toward resistance zones.
- Upside levels: $3,355 – $3,360 and higher toward $3,381 – $3,394 (Fib levels).
Expect high volatility; $3,300 is a critical support to watch. A dovish Fed may give Gold short-term relief, but a hawkish stance could accelerate the downtrend.
Note
Please risk management in trading is a Key so use your money accordingly. If you like the idea then please like and boost. Thank you and Good Luck!
GOLDCFD trade ideas
GOLD Bearish Breakout!
HI,Traders !
#GOLD is trading in a strong
Downtrend and the pair
Broke the key horizontal
Level around 3318.97 which
Reinforces our bearish
Bias and we will be
Expecting a further
Bearish move down !
Comment and subscribe to help us grow !

Gold 1H Intra-Day Chart 28.07.2025We saw a perfect move towards our $3,310 target, hitting our TP. What's next?
Option 1: Gold now moves higher into the $3,385 area, before we can determine the next major move.
Option 2: Gold drops lower towards $3,265 next.
Which scenario do you find more likely?

Sell xauusdGold recently breaks it's buy trend and retested it
Now looking for sell on h4 chart
This current level not much good for buyers

July 31, 2025 - XAUUSD GOLD Analysis and Potential OpportunitySummary:
The Fed held interest rates unchanged, and Powell’s remarks reduced the likelihood of a rate cut in September — this is fundamentally bearish for gold. Until new fundamental developments emerge, the strategy remains: sell on rallies into resistance.
After reviewing the 4H chart, I see two possible scenarios:
Price continues down to 3245, pulls back to 3283, then resumes the drop toward 3245 or even lower.
Price pulls back immediately toward 3300, then resumes the downtrend toward 3245.
These are ideal cases — I will still wait for clear confirmation before taking action.
🔍 Key Levels to Watch:
• 3323 – Resistance
• 3309 – Resistance
• 3300 – Psychological level
• 3283 – Key resistance
• 3268 – Short-term support
• 3260 – Support
• 3245 – Major support
• 3233 – Support
📈 Intraday Strategy:
• SELL if price breaks below 3268 → target 3265, then 3260, 3255, 3250
• BUY if price holds above 3283 → target 3289, then 3295, 3300, 3305
👉 If you find this helpful or traded using this plan, a like would mean a lot and keep me motivated. Thanks for the support!
Disclaimer: This is my personal view, not financial advice. Always use proper risk control.
XAUUSD – Strong Bullish Reversal from Key Support XAUUSD – Strong Bullish Reversal from Key Support
Chart Summary:
Gold (XAUUSD) has shown a clear reaction from a strong support zone near 3260, suggesting bullish momentum is gaining strength. The chart highlights multiple key market structure elements and confirms the potential for a bullish move.
Technical Highlights:
🔻 Strong Support Zone (3260–3280):
Price tapped into a well-defined demand zone with historical significance, initiating a bullish response.
🔺 Resistance Zone (3460+):
A strong resistance level lies ahead. This area may act as a potential target for bulls.
🔁 Break of Structure (BOS):
Multiple BOS marks on the chart indicate trend shifts and liquidity grabs. Most recent BOS aligns with potential reversal.
💹 Bullish Fair Value Gap (FVG):
A bullish FVG near mid-structure confirms institutional interest and adds confluence to the upside move.
📈 Target: 3,366.984 USD
Marked as the next probable short-term liquidity target. If momentum sustains, price may approach resistance above this.
Price Expectation:
If the current bullish momentum holds above the strong support zone, we may see a rally towards 3,366–3,400 USD.
This move could be driven by:
Buy-side liquidity grab above prior highs
Breakout traders entering above BOS
Reaction to macroeconomic calendar (highlighted on the chart)
✅ Educational Takeaway:
This is a textbook example of:
Support-resistance flip
Liquidity concepts (Buy-Side Liquidity)
Fair Value Gaps usage
Volume Profile confluence

XAU / USD 4 Hour ChartHello traders. We sure did push down. The question now is does $3300 hold as support. I am going to watch the lower time frames to see if I can get a quick scalp entry if we start moving back up. Big G gets my thanks. Let's see how things play out. I will update if I take a trade. Be well and trade the trend.

I maintain my #3,277.80 and #3,252.80 TargetsI didn't engaged any re-Sell orders throughout yesterday's session and re-Sold Gold on #3,295.80 ahead of Asian session, with plan to keep orders over-night. However due NFP, Gold might be stationary / ranging until the news as I closed both of my orders on #3,291.80 / each #9.000 Eur Profit and my #3,300.80 pending Sell limit has been triggered over-night which is now running in Profits with Stop on breakeven. I do expect #3,277.80 and #3,252.80 Targets to be met within #1 - #3 sessions and if there aren't NFP numbers, I would keep all three orders / set of Selling orders maintaining my first #3,277.80 Target. Due the news, Gold might fluctuate within Neutral Rectangle until the news.
Technical analysis: My earlier Selling configuration / Technical expectations was confirmed on Hourly 4 chart under prolonged weakness and Price-action respecting the trend-line guarding the downtrend (very Bearish formation) as Hourly 1 chart is already an aggressive Descending Channel (width opened on Williams) that should reach it’s next local Low’s (currently Trading slightly below Double Bottom) and Oversold state near my take Profit of #3,252.80 benchmark. If the bands are widened Traders may witness #3,277.80 test, also if gets invalidated and #3,270.80 gives away, #3,252.80 mark extension test is inevitable. In any case I will update my Targets or levels of Profit taking if I decide to exit earlier than #3,252.80 benchmark to be in accordance with the Daily chart’s period / I already ride Selling wave since #,3,300's and my Profit will be already good to ignore.
My position: DX is soaring, Gold is under Bearish Technical developments and #3,252.80 benchmark is my final Target of current Selling leg. Only factor which can reverse this Intra-day but not postpone is NFP. I expect downside Jobs surprise which may reverse DX from local High's however hot upside surprise will make Gold test #3,252.80 Intra-day. NFP or not I do believe Gold is Bearish. Trade accordingly.

XAU/USD – Endphase der Circle Wave 1 & Vorbereitung auf die KorrOANDA:XAUUSD
We are currently in the final stages of the yellow (Circle) Wave 1 on Gold.
We have just completed wave 4.
How do I identify wave 4? Simple:
📏 I drew a trendline, and once that trendline was broken, the trend of wave 3 was considered complete.
However, we’ve now made a new low, which broke the low of wave 3 — this could very well be our wave A of wave 4 ⚠️.
I’m expecting one more final low, potentially around 3252, or even as low as 3200.
But personally, I lean towards ~3252 as the likely target 🎯.
After that, we should see a move upward into the yellow Fibonacci zone of wave 2 🟡.
The path from Circle 1 to Circle 2 will likely unfold as a corrective A-B-C structure to the upside 🔁.
Following that, we hopefully get a clean five-wave impulse into our (Circle) Wave 3 🚀.

GOLD trades in narrow range after 4 sessions of sharp declineOn Tuesday (July 29), in the Asian market, the spot OANDA:XAUUSD traded in a narrow range after yesterday's sharp decline, and the current gold price is around 3,315 USD/ounce.
The OANDA:XAUUSD fell to its lowest level in nearly 3 weeks on Monday, mainly due to the trade agreement reached between the United States and the European Union over the weekend, which boosted the Dollar and risk sentiment.
The previous report released by the US Bureau of Labor Statistics showed that the number of US JOLTS jobs unexpectedly increased in May, reaching the highest level since November last year.
The number of JOLTS job vacancies in the US in May was 7.769 million, far exceeding the forecast of all economists surveyed.
Looking back at the data in April, the number of JOLTS job vacancies also showed an unexpected increase.
The JOLTS jobs report is a closely watched labor market data by the Federal Reserve.
In addition, the Conference Board of America's Consumer Confidence Index for July is scheduled to be released on the same day and is expected to be 95.8, compared to the previous value of 93.0.
The fundamental pressure that gold is under
OANDA:XAUUSD came under pressure yesterday and fell to a near three-week low, mainly due to the trade deal between the United States and the European Union (EU) over the weekend, which boosted the Dollar and risk sentiment. Moreover, US President Trump announced “global tariffs” of 15% to 20% on most countries, a change from his previous statement last week.
The deal reached by U.S. President Donald Trump and the European Union late last week will impose a 15% tariff on EU goods, half the rate Trump had threatened, easing fears of a wider trade war.
The U.S. and Japan also reached a deal last week, and U.S. and Chinese officials resumed talks in Stockholm, Sweden, this week with the goal of extending the tariff deadline by 90 days.
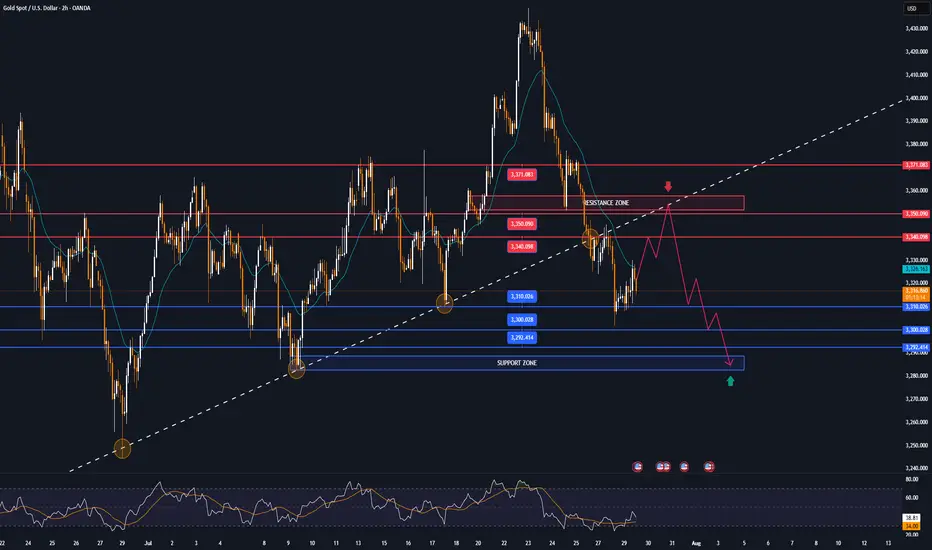
Technical Outlook Analysis OANDA:XAUUSD
Gold has been on a four-day losing streak, a decline that threatens bullish expectations as its current position gradually deprives it of any room for further upside.
Specifically, gold has recovered from the psychological level of $3,300 but the actual recovery is not significant, while it is under pressure from the EMA21 which is currently the closest resistance.
On the other hand, gold has fallen below both the long-term and short-term trend channels. If it continues to sell below the 0.382% Fibonacci retracement level, this will confirm a break below the psychological level of $3,300, then the downside target will be around $3,246 in the short term, rather than $3,228.
RSI is pointing down, below 50 and still far from the 20-0 area, also showing that in terms of momentum, gold is also under pressure and there is still a lot of room for decline ahead.
For gold to be eligible for an increase, it needs to at least bring price activity back above the EMA21, back inside the price channels. On the current daily chart, the technical conditions are more inclined towards the possibility of a decrease.
Notable positions will be listed as follows.
Support: 3,310 - 3,300 - 3,292 USD
Resistance: 3,340 - 3,350 - 3,371 USD
SELL XAUUSD PRICE 3355 - 3353⚡️
↠↠ Stop Loss 3359
→Take Profit 1 3347
↨
→Take Profit 2 3341
BUY XAUUSD PRICE 3285 - 3287⚡️
↠↠ Stop Loss 3281
→Take Profit 1 3293
↨
→Take Profit 2 3299
Gold Surges on Non-Farm Data; 3330 Key Next WeekGold was strongly boosted by the significantly bullish non-farm payroll data, surging sharply like a rocket 🚀, with gains that completely "wiped out" all the weekly losses. The current gold trend, as if injected with super momentum, has completely broken the previous long-short stalemate. Starting from the 3300 level, it has been breaking through obstacles all the way up to 3350. At present, 3330 is like a critical "battleground" ⚔️ fiercely contested by both long and short sides.
This week, when gold was still "lingering" below 3300, I emphasized repeatedly that a rebound was inevitable – we just needed to stay calm and wait for the opportunity. As it turns out, our judgment was spot on, and we successfully took profits around 3340, reaping good gains 💴. Now, gold prices are oscillating back and forth in the 3340-3350 range. Based on a comprehensive analysis of the current trend, I boldly predict that gold is likely to pull back to around 3330 next week, so everyone can prepare in advance 🤗
⚡️⚡️⚡️ XAUUSD ⚡️⚡️⚡️
🚀 Sell@ 3350
🚀 TP 3330 - 3320 - 3310
🚀 Buy@ 3300 -3310
🚀 TP 3320 - 3330 - 3340
Daily updates bring you precise trading signals 📊 When you hit a snag in trading, these signals stand as your trustworthy compass 🧭 Don’t hesitate to take a look—sincerely hoping they’ll be a huge help to you 🌟 👇

Short idea!Hello all. the last falling leg is about to start. lets see the reaction of the market on the Broken retrace zone. be happy.

GOLD for todayHello to all traders. 😎😎
I hope all your deals will hit their targets. 🎉🎉
Based on yesterday’s analysis (link in the caption), we can expect gold to make a small upward move towards the 3335–3345 zone to collect sell orders in that area, and then potentially drop with more strength.
As you can see on the chart, the previous bearish move was strong, while the recent bullish move from yesterday until now has been slow and weak.
🌟🌟 The main reason for expecting this drop is the break of a key trendline on the 4H timeframe.
I’ve marked the entry point and stop-loss in red, and the targets in blue on the chart.
📌 Don’t forget to apply proper risk management!
⚠ Important: If a 1H candle closes above 3350 without giving us a valid entry beforehand, this analysis will be considered invalid.
What Do You Think?
Which scenario do you think is more likely to happen? **Share your thoughts!** ⬇️
Don't forget that this is just an analysis to give you an idea and trade with your own strategy. And don't forget the stop loss🛑🛑🛑
❤️❤️❤️The only friend you have in financial markets is your stop loss❤️❤️❤️
Please support me with your ✅' like'✅ and comments to motivate me to share more analysis with you and share your opinion about the possible trend of this chart with me 🙏😊
Be Happy , Ali Jamali

Gold - Sell around 3345, target 3320-3301Gold Market Analysis:
Gold has been in a correction over the past two days, with repeated ups and downs, generally trending towards a low and then a rebound. Yesterday, we insisted on selling at 3320, 3326, and 3328, but the profits weren't significant. The daily chart doesn't clearly indicate stabilization or a reversal of trend. Looking at the longer-term trend, I still insist on buying if 3345 breaks. If it doesn't break, we can hold on to the bearish trend. We previously mentioned that 3300 is support on the daily and weekly charts. A technical rebound and correction after selling below this level is inevitable and a normal technical correction. Furthermore, starting Wednesday, big data will be released one by one, and the market is waiting for the data to guide its direction. The weekly chart is also confused and directionless. We're just small investors; we need to follow, not speculate. The 5-day moving average on the daily chart has dipped below 3335, a level that has been retested multiple times in the Asian session. The current correction range is 3300-3335, with resistance around 3345-3343. The daily chart closed positive again, suggesting that the support below may be difficult to break in the short-term Asian session, and a significant decline is unlikely. We anticipate continued correction pending the ADP results.
Support is 3311 and 3301, resistance is 3345, with minor resistance at 3335. The dividing line between strength and weakness is 3335.
Fundamental Analysis:
Today, focus on the ADP employment data and the EIA crude oil inventory data. The US interest rate results are the highlight, along with the speech.
Trading Recommendation:
Gold - Sell around 3345, target 3320-3301

XAUUSD Long Setup – 1HGold (XAUUSD) has shown strong bullish rejection from the lower volatility band after a sharp selloff. The appearance of a Heikin Ashi reversal candle, suggests a short-term reversal is forming. Price has reclaimed key structure and is now targeting a reversion back to the mean, supported by Fibonacci retracement levels.
Entry: 3293.55
Target Zone: 3308.91 → 3333.76 (Fib 38.2% – 100%)
Stop Loss: 3253.35
Confluences:
✅ Bullish engulfing + Heikin Ashi trend shift
✅ Oversold bounce from lower channel extremity
✅ Fib retracement aligns with key structural resistance zones
✅ Custom signal confirmation (green dot)
✅ Clean R:R toward upper band and previous POI
Short-term counter-trend long targeting liquidity grab and mean reversion toward the 3308–3333 zone. Risk tightly managed with SL below local swing low.

Gold non-farm payrolls are bullish, long and short positions ana
Rather than envying the fish by the river, it's better to retreat and weave your net. We often envy the wealth others can earn by investing in the gold market. We often watch them enthusiastically investing, but we ourselves are afraid to enter the market. The two major factors that drive the market, technology and news, are a topic of constant debate among investors. To navigate the market, one must master the art of attack and defense to remain rock-solid while remaining at the forefront. As the saying goes, trust me, and I will reward you with profits!
Gold Data is Bullish!
The positive non-farm payroll data sent gold soaring, with gains completely erasing all of the week's losses. Currently, gold's trend has reversed the stagnant bullish and bearish trend. After breaking through the 3300 mark and rising all the way to 3348, it shows no signs of stopping. A further test of the 3370 level is not out of the question!
Due to the strong bullish data, if you don't immediately chase longs or place a breakout long order during the first wave, you'll likely have little chance of a pullback. Therefore, you should remain aggressive in your trading strategies. We recommend a pullback to the 3332-30 level to continue the bullish trend. Upward pressure is expected at 3372-75! The market fluctuates violently, and more real-time entry and exit points are mainly based on Yulia's real-time guidance!

GOLD TRADING PLAN – Triangle Squeeze, All Eyes on NFP【XAU/USD】GOLD TRADING PLAN – Triangle Squeeze, All Eyes on NFP
Gold continues to trade within a large symmetrical triangle, tightening toward the end of its range. However, current candle structure shows clear bullish momentum, indicating the potential for a strong upside breakout.
🔍 Today’s Key Focus: Non-Farm Payrolls (NFP)
Market expectations are pointing to weaker-than-expected US economic data, which could trigger strong FOMO-buying for gold if confirmed. A poor NFP report would likely weaken the USD, supporting bullish continuation.
🔑 Strategy and Key Technical Levels:
Watch for a confirmed breakout above the descending trendline to trigger Wave 3 of the bullish structure.
CP ZONE + OBS BUY ZONE triggered yesterday already yielded 160+ pips profit.
Strategy: Prefer buy-the-dip entries. SELL setups only valid on strong resistance rejection. Avoid counter-trend trades near breakout zones.
🟩 BUY ZONE:
Entry: 3276 – 3274
Stop Loss: 3270
Take Profits:
3280, 3284, 3290, 3294, 3300, 3305, 3310, 3320, 3330, 3340, 3350
🟥 SELL ZONE:
Entry: 3339 – 3341
Stop Loss: 3345
Take Profits:
3335, 3330, 3325, 3320, 3315, 3310, 3305

Gold long from 3295I think this might be the bottom .
Next week gold will be sitting at 3400$ level.
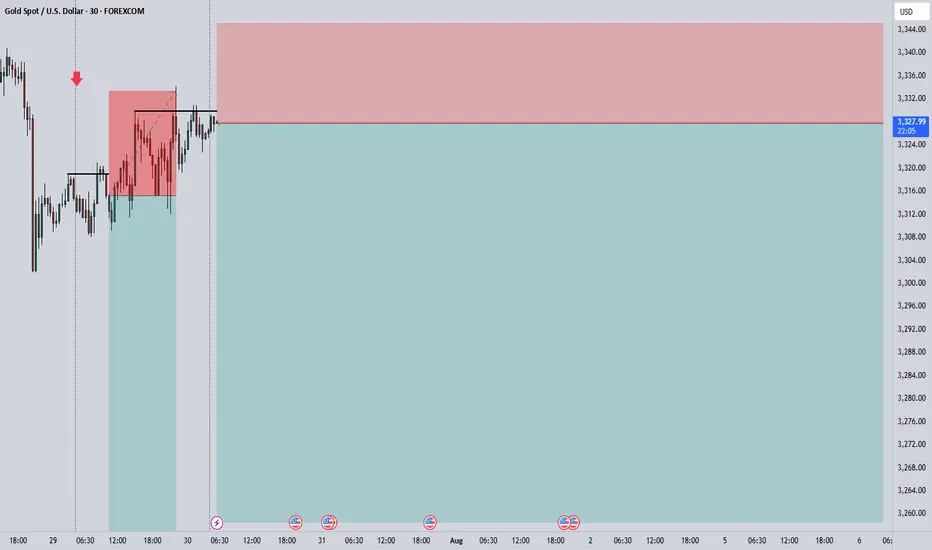
XAU/USD Analysis – Critical Breakout Zone Approaching 30M Chart📈 XAU/USD Analysis – Critical Breakout Zone Approaching (30-Minute Chart)
🔍 Technical Overview:
Chart Type: 30-minutes
Indicators: Ichimoku Cloud
Key Structures: Supply & Demand Zones, CHoCH, BOS, Trendlines, Triangle Formation
🔑 Key Market Observations:
🟢 Demand Zone (Support) ~ $3,300 – $3,310
This area has been tested multiple times and has shown strength in absorbing selling pressure.
A bullish triangle formation is converging into this zone, suggesting a potential breakout point is near.
🔴 Supply Zone (Resistance) ~ $3,375 – $3,390
Repeated price rejection from this zone marks it as a strong institutional-level resistance.
Price needs a clean breakout and volume confirmation to push through this level.
📉 Break of Structure (BOS) & Change of Character (CHoCH):
BOS and CHoCH levels are clearly marked, showing a trend shift from bullish to bearish (post-supply test).
The last CHoCH aligns with a lower high, reinforcing bearish dominance unless invalidated.
📐 Symmetrical Triangle Formation:
Price is squeezing between higher lows and lower highs, coiling before a significant breakout.
Two scenarios are outlined:
Bullish Breakout: Clear move above triangle resistance → test of supply.
Bearish Breakout: Breakdown → revisit demand zone or even drop toward $3,280–$3,270.
☁️ Ichimoku Cloud:
Price is currently testing the lower boundary of the Ichimoku cloud.
A bullish breakout into/above the cloud may act as confirmation of a reversal attempt.
💡 Potential Trade Setups:
✅ Bullish Case:
Trigger: Break and close above $3,335 with volume.
Target 1: $3,375 (Supply Zone)
Target 2: $3,440 (Extended Target)
Invalidation: Rejection from triangle top and close below $3,310.
❌ Bearish Case:
Trigger: Break and close below $3,310 (triangle breakdown).
Target 1: $3,280
Target 2: $3,260
Invalidation: Bullish breakout of triangle and flip of previous CHoCH level.

Gold Approaching a Key Support, Potential Long OpportunityHi,
The setup is pretty clear from the chart.
Price has reached the lower boundary of the channel, which could offer a solid entry point for a long position, with a defined stop loss and take profit.

GOLD: $4000 on the way! Bulls has the controlGold is on the way hitting a record high since the global tension rising we can see gold creating another record high. Please note that it is a swing trades and may take weeks and months to hit the target or it may not even reach the target itself. This is prediction only so do your own due diligence.
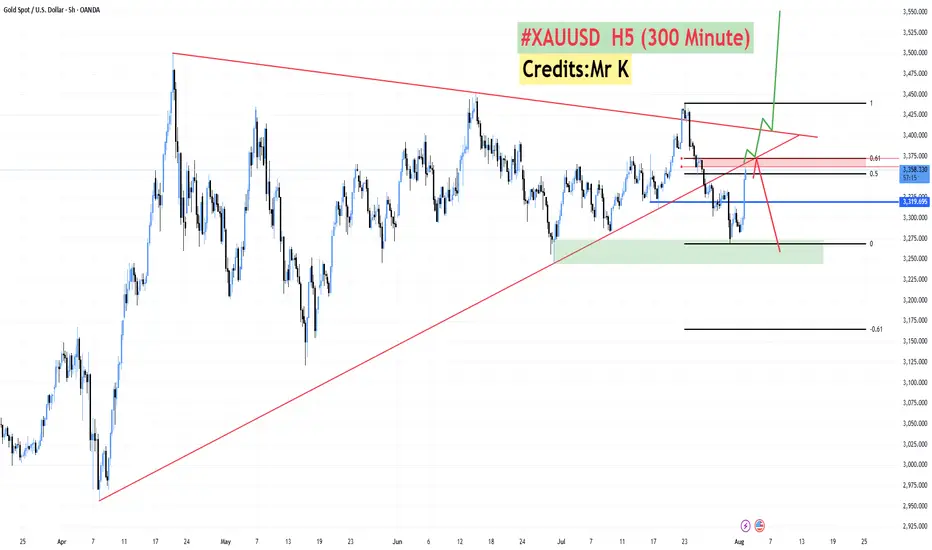
**#XAUUSD H5 Higher Timeframe Analysis**
📊 **#XAUUSD H5 Higher Timeframe Analysis**
What we witnessed today was a **tremendous recovery in Gold 🟡** after **3–4 consecutive bearish sessions 📉**.
📅 **Today’s candle** has **completely flipped the weekly structure**, turning a fully **bearish weekly candle into a bullish one 📈** — thanks to the **NFP data** that came in **favor of Gold and against the Dollar 💵❌**.
🔍 However, price is now approaching a **critical confluence zone**:
* 🧭 A **long-running trendline** (since April)
* 🔴 An **H4 Bearish Order Block**
* 📐 The **Fibonacci Golden Zone (0.50–0.618)** at **3362–3372**
📌 **From this level, we have two possible scenarios:**
1️⃣ **Sharp Rejection 🔻:**
Price may **reverse sharply** from the 3362–3372 zone and **resume the bearish trend**.
2️⃣ **Breakout & Trap Theory 🔺:**
If price **sustains above this zone**, it may signal that the recent **3–4 day drop was a fake breakdown**, designed to **trap sellers** and grab liquidity for a **further upside move**.
✅ **Confirmation will come if we get an H4–H6 bullish candle close above the trendline** and back inside the **buying zone of 3375–3390**.
🔓 **A breakout above the triangle pattern** will likely lead to a **strong bullish continuation 📈🚀**.