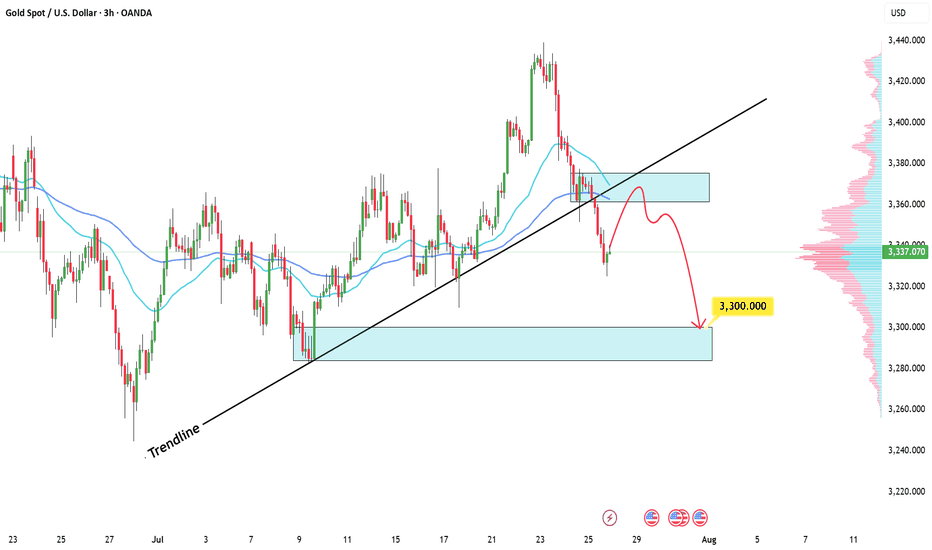
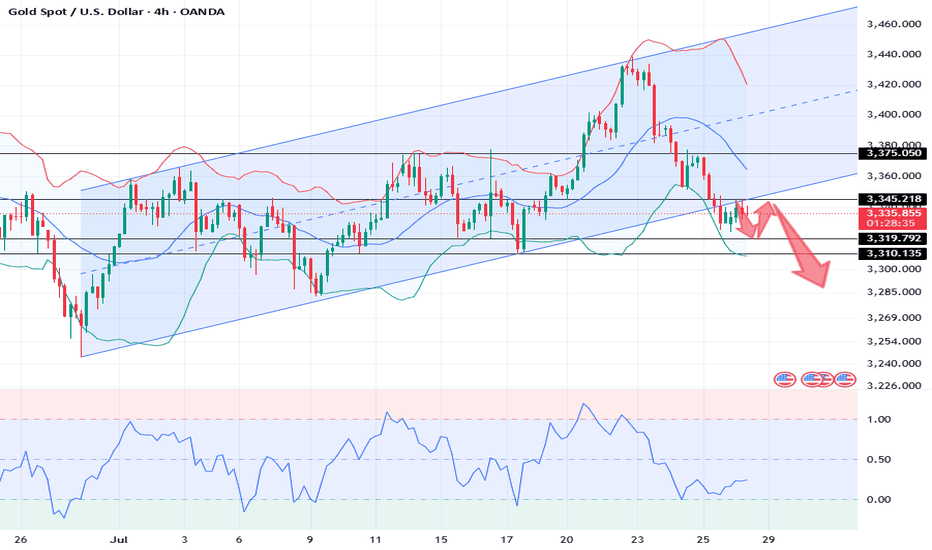
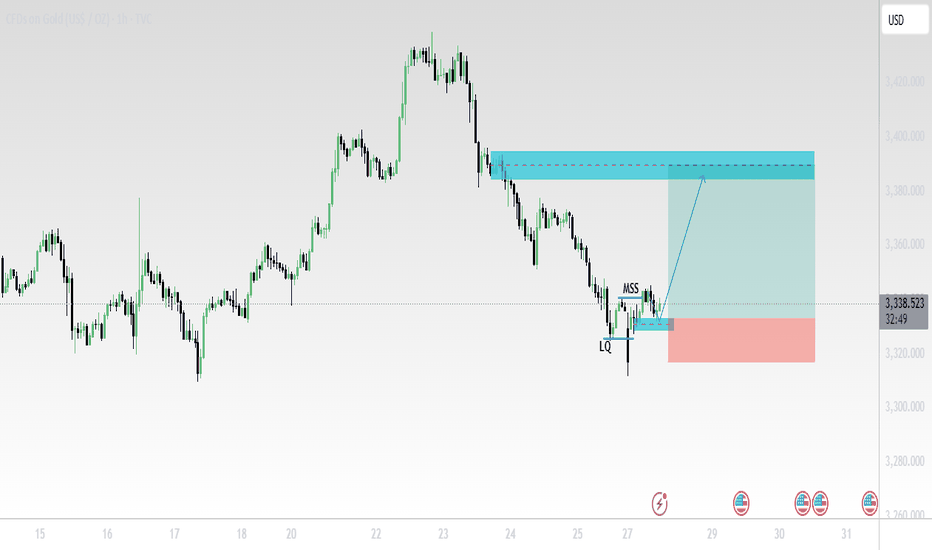
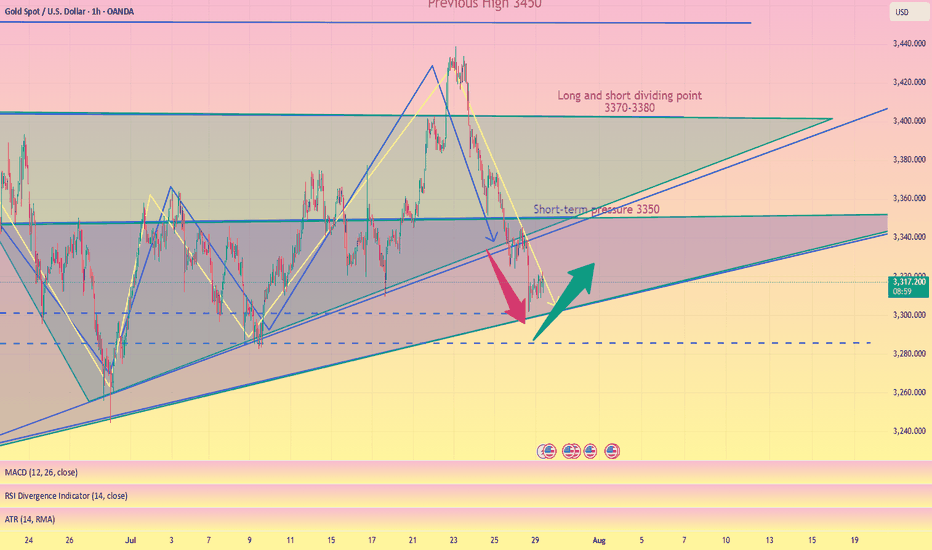
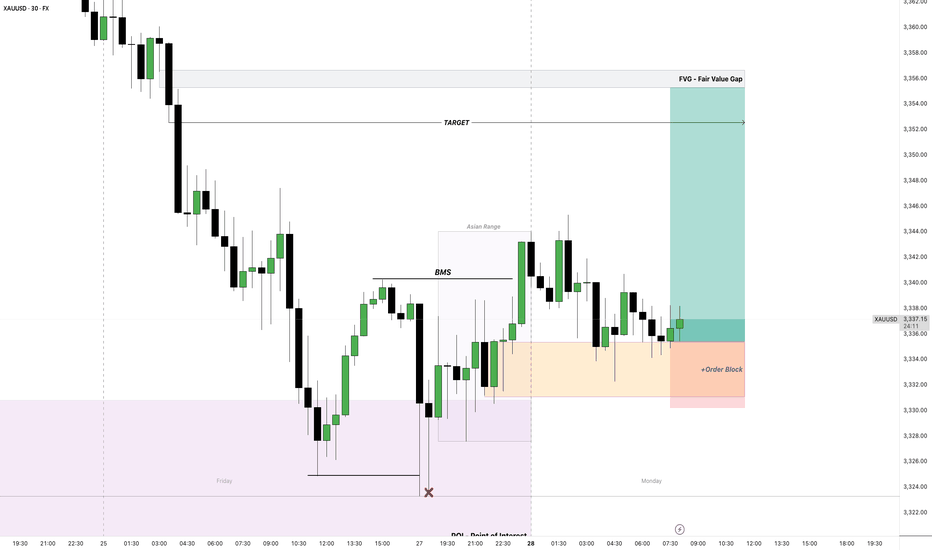
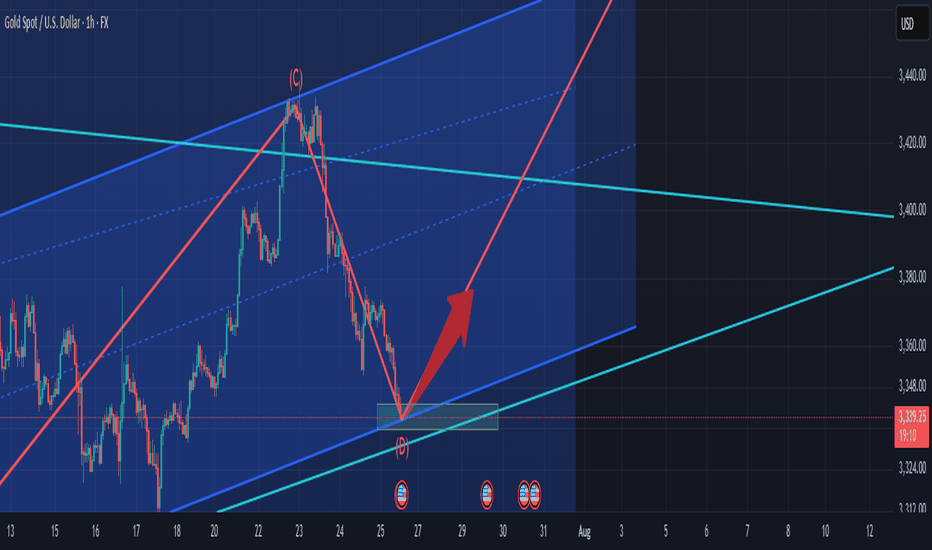
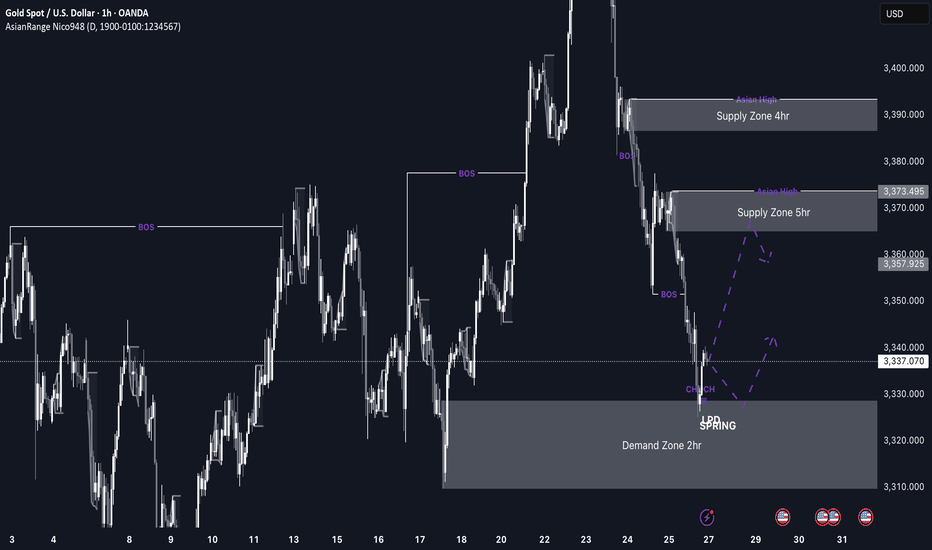
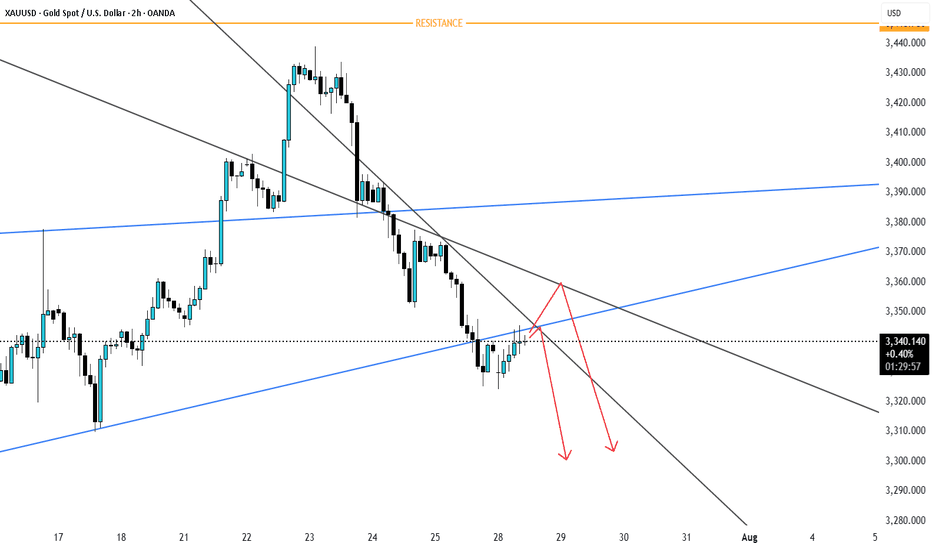
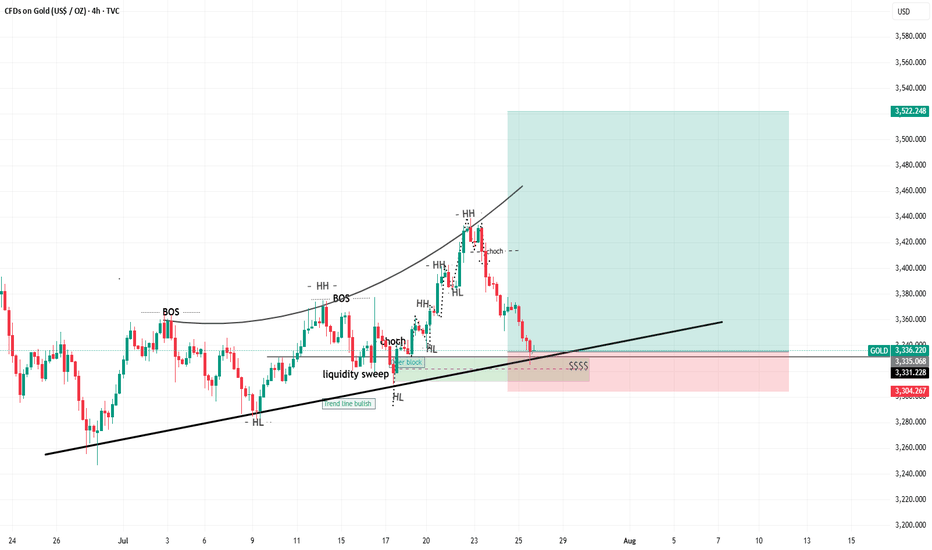
Gold price is sure to make ATH in the new weekGold confirms a long-term uptrend. The ATH 3500 zone is likely to have a reaction before 3490.
Any pullback in Gold next week is still considered a good opportunity to Buy Gold. And the bullish price gap is likely to continue on Monday.
3495 and 3345 are accumulated with many people waiting to Buy there, setting up a Buy signal with SL 10 price at the weekly support and resistance zones.
The possibility of breaking ATH next week is very high
Support 3393-3345
Resistance 3490
GOLDCFD trade ideas
Gold closed strong bull weekly candleGold closed strong bull weekly candle.
gold manage to close a solid weekly candle that manage to cover most of previous wick highs that showing a strong indication that it wants to reach its ATH as first destination which is accordance to fibo from the latest bearish movement of 3403 to 3295.
Bias is Bullish.
However, in the current daily line chart. we are at 3-point touch of resistance. which also indicate a very strong point of resistance.
1st scenario is I foresight gold will continue its climb towards 3500 or even closer to it to cfm its direction. if breaks above 3500 means gold will head towards 2.618 of fibo.
2nd scenario, if gold did not manage to break the 3500 ceiling, possibility for a trendline support retest as previous the weekly trendline was able to be broken however due to fundamental of trade war tariff its bounce back making it as a fake out.
my plan for next week.
1. I will still focus to look for buys, however I will only scalp position. means if I identify a support area to buy with a clear confirmation of fresh breakout target with a 50pips 1st tp 50% and 100pips 25% and balance B.E. for every setup.
2. I will wait for a confirmation of sells setups nearer to its resistance. if a strong and clear rejections appear in smaller tf shall i take that trade with the same principals and target as it makes sense to sell high.
at the current no trader is wrong to buy or sell as we are in at the most volatile area that a minute candle goes as much as 100pips. only money management that will keeps us alive. A self reminder to me as well. All the best traders. may it'll be a fruitful week ahead for all of us.
Gold: silence on the charts—because the real money already movedThe gold market isn't reacting — it's confirming. The Israeli strikes on Iran? That’s the trigger. But the move started earlier. Price was already coiled, already positioned. All the market needed was a headline. And it got it.
Price broke out of the accumulation channel and cleared $3,400 — a key structural level that’s acted as a battleground in past rotations. The move from $3,314 was no fluke — it was a textbook build: sweep the lows, reclaim structure, flip the highs. Volume spiked exactly where it needed to — this wasn’t emotional buying. This was smart money pulling the pin.
Technicals are loaded:
— Holding above $3,396–3,398 (0.618 Fibo + demand re-entry zone)
— All major EMAs (including MA200) are now below price
— RSI strong, no sign of exhaustion
— Candles? Clean control bars — breakout, retest, drive
— Volume profile above price = air pocket — resistance is thin to nonexistent up to $3,450+
Targets:
— $3,447 — prior high
— $3,484 — 1.272 extension
— $3,530 — full 1.618 expansion — key upside target
Fundamentals:
Middle East is boiling. Iran is ready to retaliate. Israel is already escalating. In moments like these, gold isn't just a commodity — it's capital preservation. The dollar is rising — and gold still rallies. That means this isn’t about inflation, or rates. It’s about risk-off. Pure, institutional-level flight to safety.
Tactical view:
The breakout is done. Holding above $3,396 confirms the thesis. Pullbacks to that zone? Reloading points. While gold remains in the channel and momentum is clean, the only side that matters right now — is long.
When price moves before the news — that’s not reaction. That’s preparation. Stay sharp.
GOLD Technical analysis.This chart describes a bullish trade setup on Gold (XAU/USD) on the 1-hour timeframe.
Analysis:
Entry Zone: Price is expected to retrace down into the demand zone (around 3360.79) before moving up.
Support Area: The green zone marks a bullish order block or demand zone where buyers previously stepped in.
Target: If price respects the demand zone, the projected target is near 3500.00.
Stop Loss: Placed below the demand zone, around 3337.19, ensuring a favorable risk-reward ratio.
Trade Plan Summary:
Wait for the price to tap into the demand zone before entering a buy trade, targeting the next liquidity area near $3500. If price fails to hold that zone, the trade idea becomes invalid.
GOLD Will Move Higher! Long!
Please, check our technical outlook for GOLD.
Time Frame: 2h
Current Trend: Bullish
Sentiment: Oversold (based on 7-period RSI)
Forecast: Bullish
The market is approaching a key horizontal level 3,423.03.
Considering the today's price action, probabilities will be high to see a movement to 3,467.03.
P.S
Please, note that an oversold/overbought condition can last for a long time, and therefore being oversold/overbought doesn't mean a price rally will come soon, or at all.
Disclosure: I am part of Trade Nation's Influencer program and receive a monthly fee for using their TradingView charts in my analysis.
Like and subscribe and comment my ideas if you enjoy them!
GOLD/USD Bullish Breakout ConfirmationGOLD/USD Bullish Breakout Confirmation 🚀📈
📊 Technical Analysis Overview:
The chart illustrates a bullish breakout above a well-defined resistance zone around $3,390–$3,400. Price action has decisively closed above this resistance, suggesting strong bullish momentum.
🔍 Key Observations:
🟦 Support Zone:
Marked clearly between $3,250–$3,280, this level has held firm multiple times (highlighted with green arrows and orange circles), confirming buyer interest and market structure.
🟦 Resistance Turned Support:
The previous resistance zone around $3,390–$3,400 has now potentially turned into a new support. Price retesting this zone and holding would further validate the breakout.
📈 Future Projections:
The chart anticipates a retest-pullback-continuation scenario:
Pullback to new support 📉
Bullish continuation toward $3,460+ 🎯 if support holds.
✅ Bias:
Bullish as long as price remains above the $3,390 zone. Break and hold below would invalidate the bullish setup.
📌 Strategy Tip:
Look for confirmation on the lower timeframes (e.g., bullish engulfing or pin bar) on the retest before entering long.
Could the Gold reverse from here?The price is reacting off the resistance level which is a pullback resistance that aligns with the 127.2% Fibonacci extension and could drop from this level to our take profit.
Entry: 3,390.28
Why we like it:
There is a pullback resistance level that lines up with the 127.2% Fibonacci extension.
Stop loss: 3,426.28
Why we like it:
There is a pullback resistance level that lines up with the 100% Fibonacci projection.
Take profit: 3,343.57
Why we like it:
There is an overlap support level that aligns with the 50% Fibonacci retracement.
Enjoying your TradingView experience? Review us!
Please be advised that the information presented on TradingView is provided to Vantage (‘Vantage Global Limited’, ‘we’) by a third-party provider (‘Everest Fortune Group’). Please be reminded that you are solely responsible for the trading decisions on your account. There is a very high degree of risk involved in trading. Any information and/or content is intended entirely for research, educational and informational purposes only and does not constitute investment or consultation advice or investment strategy. The information is not tailored to the investment needs of any specific person and therefore does not involve a consideration of any of the investment objectives, financial situation or needs of any viewer that may receive it. Kindly also note that past performance is not a reliable indicator of future results. Actual results may differ materially from those anticipated in forward-looking or past performance statements. We assume no liability as to the accuracy or completeness of any of the information and/or content provided herein and the Company cannot be held responsible for any omission, mistake nor for any loss or damage including without limitation to any loss of profit which may arise from reliance on any information supplied by Everest Fortune Group.
XAUUSD BUYS PROJECTION Hello everyone yup lately I’ve been slacking off on the charts and haven’t taken a Gold trade since we took a loss tho I have been trading other pairs but nothing like Gold so I’m back and fully active and will be giving my all to XAUUSD only and will be updating you guys so this is my buy projection for Gold I will be waiting for a breakout of the 3,400 zone and also wait for a good pullback with our confirmation to take buys to the last ATH we in this game to win it so let’s watch how the chart plays out and will be updating y’all if am taking any entry….
Elliott Wave Analysis – XAUUSD | June 11, 2025Currently, the price is moving sideways within a channel.
🔍 Wave Structure Analysis:
Looking closely at the wave patterns inside this price channel, we can clearly see a series of 3-wave structures developing. Previously, we also observed what appears to be an abc corrective pattern (black), which leads me to suspect that we might be forming a triangle structure as the beginning of a wave 1 sequence (12345 in green).
It seems that wave 4 has already completed, and the price is currently in wave 5. Structurally, wave 5 may take the form of a 3-wave move, and the key confirmation we want to see is a break above 3349, signaling that the top of wave 5 is in place.
☄️ Typically, once a wave 1 triangle completes, the market tends to enter a sharp and deep corrective move in the form of a zigzag.
🎯 Potential Target Zones (based on Fibonacci + Volume Profile):
Target Zone 1: 3352 – 3355
Target Zone 2: 3362 – 3365
⚡️ Momentum Outlook :
D1 Momentum: Starting to turn bullish, suggesting the current correction is nearing completion and we could see a bullish week ahead.
H4 Momentum: Currently in overbought territory – I expect the price to break above 3349, followed by a momentum reversal on H4, which could provide a great SELL opportunity at the upper targets.
H1 Momentum: Is about to turn bearish, indicating a short-term pullback may occur. If this correction fails to break below 3315, the price may be completing wave 5 as a 3-wave structure. In that case, we should wait for H1 momentum to turn bullish and then bearish again to confirm wave 5 completion.
📌 Trading Plan :
🔻 SELL Zone: 3352 – 3355
⛔️ Stop Loss: 3369
🎯 TP1: 3334
🎯 TP2: 3307
XAUUSD: Analysis June 11Positive signals in US-China trade negotiations put pressure on gold. However, escalating geopolitical tensions between Iran and Israel and Russia and Ukraine have limited the decline of gold. Today, the market focuses on CPI data released today. If the data is released above expectations, it may force the FED to keep interest rates high for a longer period of time, thereby causing gold prices to decrease. On the contrary, if the data is released below expectations, gold will be supported to increase.
From a technical perspective.
The gold sell signal 3340 - 3342 in the US session last night had a very good profit. Gold declined below 3320 but then increased again and moved steadily above this support zone, indicating that the gold's upward momentum may continue.
Gold rebounds and repairs, is it a shock or a bull market?📰 Impact of news:
1. Geopolitical situation
2. Impact of the US dollar trend on gold
📈 Market analysis:
At the gold hourly level, after the pressure in the Asian session in the morning, it directly fell to the vicinity of 3302. The big Yin effectively lost the lower track of the descending flag consolidation channel. The original 3318 line was the confirmation of the channel counter-pressure point, which happened to be the 61.8% split resistance level at that time. At the same time, it lost the middle track. Therefore, we gave a trading idea of looking at the rebound under pressure and continuing to decline in the European session. As a result, the market directly took a V-shaped wash-up and once pulled up to the vicinity of 3342.
The European session fluctuated strongly and rose. Before and after the US session, it took advantage of the retracement to lure the short position, and there is still the possibility of a second pull-up space. Therefore, in the subsequent retracement support level, pay attention to two positions, one is 3322-3324, and the other is the 61.8% division support level of 3318. If it stabilizes, there is a high probability that there will be a second upward space, pointing to 3348. If the pressure here cannot be overcome, the bottom will continue to oscillate back and forth. At that time, it will fall back to see if a secondary low point can be formed to further stabilize the support. If it goes straight through and stands on it, 3293 may already be the short-term low.
On the whole, I still hold short orders before the effective breakthrough of 3345, but at the same time, as the gold price rebounds and moves upward, the short-term support level is temporarily expected to be 3325-3320.
🏅 Trading strategies:
SELL 3335-3345
TP 3325-3315
BUY 3325-3330
TP 3350-3360
If you agree with this view, or have a better idea, please leave a message in the comment area. I look forward to hearing different voices.
TVC:GOLD FXOPEN:XAUUSD FOREXCOM:XAUUSD FX:XAUUSD OANDA:XAUUSD
DeGRAM | GOLD forming the ascending wedge📊 Technical Analysis
● Price is coiling inside an ascending flag that is riding the new support line at 3 342; flag range compression after each pull-back signals energy for a thrust.
● The pattern sits above the old channel roof, turning the former resistance into a launch pad; measured move of the flag points to the next confluence at 3 435.
💡 Fundamental Analysis
● US jobless claims ticked up while 10-yr yields slipped under 4.30 %; lower carry costs and renewed Chinese reserve buying reported by Reuters keep dip-buyers active in bullion.
✨ Summary
Buy 3 330-3 350; flag break targets 3 435, stretch 3 500. Invalidate on a 4 h close < 3 245.
-------------------
Share your opinion in the comments and support the idea with a like. Thanks for your support!
1-hour chart of XAU/USD (XAUUSD )Chart Observations
Current Price:
Around $3,325.40 at the time of the screenshot.
Zones and Levels:
Red Zone (Top): Resistance around $3,360 – potential reversal area if price reaches it.
Orange Zone (Middle): Resistance or supply zone near $3,340–$3,345, possibly where sellers may come in.
Gray Zone: A neutral/consolidation zone around the current price.
Green Zones (Bottom): Strong support zones near $3,280, indicating a potential long entry if price drops.
Price Action Forecast (Based on Arrows)
Bullish Scenario:
Price is expected to rise toward the orange resistance zone (~$3,340–$3,345).
If price breaks above this zone, it might test the $3,360 area (upper red zone).
Bearish Scenario:
If price fails to break or gets rejected at the orange zone:
A potential reversal back down toward the $3,280 support area is anticipated.
Strategy Implication
Short Setup: If price hits the $3,340–$3,345 zone and shows signs of rejection (bearish candlestick pattern), a short trade toward $3,280 support is possible.
Long Setup: If price reaches the green support zone ($3,280) and holds, a long position could be considered targeting the gray or orange zone.
Risk Zones
Stop-Loss Considerations:
For short trades above $3,345.
For long trades below $3,275–$3,270, depending on volatility.
Beyond the Headlines - Gold Outlook June 16-20, 2025Beyond the Headlines: Gold's Ascent Amidst Global Shifts & Key Technicals 🌐🚀
Everything about the last week can be found here:
OANDA:XAUUSD 💰📈
We all know what's going on, I believe. Israel struck Iran 💥, and this conflict will likely take a bit before things cool down. 🥶
---
## Geopolitical News Landscape 🌍📰
### Israel / Iran
Since June 12, Israel launched "Operation Rising Lion," targeting Iranian nuclear sites like Natanz and Esfahan – over 128 killed, Iran claims. 🇮🇷 retaliated with missile and drone strikes on Haifa and Tel Aviv, killing at least 10. 🚀
**Outlook:** 🔥 Tensions are spiraling. Without urgent mediation, full-scale regional war remains a real risk. 💣
### India / Pakistan
Since the May ceasefire, few clashes have occurred. However, both navies increased readiness, signaling potential escalation at sea. 🚢
**Outlook:** ⚖️ Peace is fragile. A strategic dialogue is key to avoiding a renewed border or maritime conflict. 🙏
### Gaza Conflict
Between June 7–15, Israeli strikes killed at least 41 Palestinians, including 8 near an aid center in Rafah. Over 55,000 total deaths, and famine is looming. 💔
**Outlook:** 🆘 Gaza remains a humanitarian catastrophe. Global pressure for access and a ceasefire must intensify. 🕊️
### Russia / Ukraine
June 13–15: Russia returned the bodies of 1,200 Ukrainian soldiers in a rare POW swap gesture. 🤝 Fighting remains intense in Sumy and Toretsk; Russia hit a major oil refinery. 🏭
**Outlook:** 🕊️ While symbolic moves continue, no peace is in sight – battlefield outcomes will shape diplomacy. ⚔️
### U.S. - China Trade War
The U.S. hiked tariffs to 55% on key Chinese goods. 🇺🇸🇨🇳 responded with 10% on U.S. imports. Talks yielded a partial truce, but military-use rare earths remain unresolved. 💻
**Outlook:** 🔧 Tech remains the battleground. Without progress on critical materials, the trade war may deepen. 📉
### Global Trade War
The OECD revised global growth downward due to rising tariffs from the U.S. targeting 🇨🇳, 🇲🇽, 🇨🇦. Global trade volume is expected to shrink by 0.2–1.5%. 📉
**Outlook:** ⛓️ Supply chain disruption is spreading. Global trade will stay under pressure without coordinated policy. 🌍➡️🌍
### Trump vs. Powell
Trump labeled Powell a "numbskull" for not cutting rates, suggesting he might "force something" if re-elected. 🗳️ The Fed maintains policy independence ahead of a critical June decision. 🏛️
**Outlook:** ⚔️ Political pressure on the Fed is mounting. Expect more friction as the election cycle heats up. 🔥
### U.S. Inflation
CPI rose 2.4% YoY in May (from 2.3%); Core CPI held steady at 2.8%. Monthly growth was modest at 0.1%. Key rises were seen in healthcare and vehicle prices. 🚗🏥
**Outlook:** Inflation is stable but sticky. 🚦 The Fed will likely hold rates steady until clearer disinflation signals appear. 📊
---
## Technical View 📐📈
### Market Structure:
Gold shows a clear **bullish market structure** with higher highs and higher lows. ⬆️ Recent price action suggests we're in a strong uptrend with institutional buying pressure. 🏦
### Key Levels:
* The chart shows a significant low around the **$3,245 area** (marked as "Low") which could act as a key institutional support level. 💪
* The current high near **$3,446** represents a potential institutional resistance zone. 🛑
* Look for potential **order blocks** around the **$3,380-$3,400 range** where price consolidated before the recent breakout. 🧱
### Fair Value Gaps (FVG):
There appear to be several gaps in the price action during volatile moves, particularly during strong rally phases. These could act as future support/resistance areas. 📉📈
### Gann Analysis:
The price movement shows strong adherence to Gann principles:
* The rally from the low follows a steep angle, suggesting strong momentum. 🚀
* Key Gann angles would place support around the **$3,300-$3,320 zone**. 📐
* The current price near **$3,436** is testing natural resistance levels based on Gann square calculations. 📏
### Fibonacci Levels:
From the significant swing low to the current high:
* 23.6% retracement: ~$3,395 📉
* 38.2% retracement: ~$3,370 📉
* 50% retracement: ~$3,345 📉
* 61.8% retracement: ~$3,320 📉
The golden ratio levels suggest key support on any pullback would be around the **$3,370-$3,345 zone**. ✨
### Institutional Levels:
* **Weekly/Monthly Levels:** The **$3,400** and **$3,450** areas appear to be significant institutional levels based on round numbers and previous price action. 🏦💰
* **Smart Money:** The accumulation pattern before the breakout suggests institutional participation. 🧠💡
### Cycle Timing:
Based on the timeframe (appears to be 30-minute bars from May 26-June 15):
* We're seeing approximately **3-week cycles** in the major moves. 🗓️
* The current rally phase appears to be in its mature stage. 🌳
* The next potential cycle turn could be approaching, suggesting caution for new longs at current levels. ⚠️
---
### Trading Considerations:
* Watch for rejection at current levels near **$3,446**. 📉
* Key support confluence around **$3,370-$3,345** for potential re-entry. 🎯
* Volume and momentum divergences would be critical for timing any reversal. 📊🔄
Other indicators tend to show bullish scenario enhancements. 🚀
Gold has formed a ** Standard Bullish Flag pattern ** over a time from early April till today. 🚩🐂
Also, the structure of a ** reverse Head & Shoulders ** is existing and has broken the neckline! 🔄🗣️
Another indicator is an existing "** Ascending Bull Flag **." ⬆️🚩
Please take the time to let me know what you think about this. 💬
-------------------------------------------------------------------------
This is just my personal market idea and not financial advice! 📢 Trading gold and other financial instruments carries risks – only invest what you can afford to lose. Always do your own analysis, use solid risk management, and trade responsibly.
Good luck and safe trading! 🚀📊
Analysis of gold price trend next week!Market news:
Weak U.S. inflation data released earlier this week reinforced expectations that the Federal Reserve will cut interest rates, increasing the appeal of spot gold. It hit a two-month high. The geopolitical tension in the Middle East has caused investors to flock to safe-haven assets. Earlier, Israel's air strikes on Iran have once again raised concerns about a wider conflict in the Middle East. In terms of physical gold, demand in major Asian centers weakened this week due to a sharp rise in prices, and the Indian gold price broke through the important psychological level of 100,000 rupees. As geopolitical tensions in the Middle East intensified over the weekend, gold prices may continue to benefit from risk aversion next week, and London gold prices are expected to target $3,500/ounce at the beginning of next week! Next week will also be affected by the Fed's decision and Powell's speech. In addition, U.S. President Trump will visit Canada from June 15 to 17 to attend the G7 Leaders' Summit. His speech at that time may also affect the fluctuation of international gold prices, which is worth paying attention to.
Technical Review:
From the market point of view, the overall bottoming and rebounding trend of gold this week has undoubtedly laid a strong foundation for buying. It is understandable to follow the trend and rise. However, since the gold price fell back at the end of the week and closed near 3433, I think it is necessary to make a short-term decline judgment on the market trend at the beginning of the week. As the gold price continues to rise, various graphics have formed very obvious and strong support, among which the 3419 line and the 3400 mark shown by the upper track of the daily Bollinger Band are the most important. Once the gold price can stabilize above this area today, the daily support will definitely continue to rise, which will also lay a more favorable foundation for buying to steadily hit new highs. Combined with the risk aversion demand caused by risk events, it is not an exaggeration to expect the gold price to approach the 3500 mark next week! But if the short-term reversal is sold, the 3400 mark is taken, and the daily MACD indicator forms a dead cross green column and continues to increase in volume, then the possibility of selling down to the daily 5-day moving average will be increased. However, whether this possibility can be realized needs to be judged in combination with more factors. After all, the overall trend of gold is still rising. If the adjustment is too strong, it will not only break the trend, but also cause the gold price to fall into a weak trend below 3400 in the short or medium term.
Next week's analysis:
Gold rose again on Friday under the stimulation of risk aversion. Gold was directly bought at 3413 on Friday, and the circle of friends also directly prompted to buy. Gold rose and harvested as expected. Gold has been shrouded in risk aversion in the Middle East these two days. In the short term, the trend of gold is still supported by risk aversion, and it may go up a level. If risk aversion is not relieved at the weekend, it will continue to buy next week. At present, the risk aversion sentiment of gold is constantly escalating, and buying is also strong and irresistible. So before there is a significant change, it is to continue to buy to the end, and the rise is not a top, and go with the trend. Gold's 1-hour moving average is still a golden cross with upward buying divergence, and the buying power of gold is still there! After the rise of gold's safe-haven, gold adjusted sideways in the short term, but it is still oscillating strongly at a high level. Now it is still in the process of rising. If there is no bad news to make gold fall and break, then the short-term volatility of gold is an adjustment in the process of rising, and it will continue to rise at any time. After gold buying breaks through 3400, gold buying sticks to the 3400 line, so if it falls back to 3400 next week, it will continue to buy on dips. If the risk aversion of gold eases and falls below 3400, then we may readjust our thinking.
Operation ideas:
Buy short-term gold at 3405-3408, stop loss at 3396, target at 3450-3470;
Sell short-term gold at 3457-3460, stop loss at 3469, target at 3420-3400;
Key points:
First support level: 3422, second support level: 3405, third support level: 3390
First resistance level: 3446, second resistance level: 3458, third resistance level: 3472
As conflict escalates, gold is cautiously long📰 Impact of news:
1. The geopolitical situation between Israel and Iran deteriorates
📈 Market analysis:
The worsening geopolitical situation caused a surge in gold prices. The intraday short-term support points of 3420, 3402, and 3380 will all become key support for testing bulls. If the European session is strong, 3420 cannot be lost. If it falls back and loses, it will move closer to the top and bottom conversion position of 3402. If you go long later, you must pay attention to the weakening of the upward momentum. If the European session continues to break the high of 3440, then the US session can be seen around 3468-3493. If the upward momentum in the European session weakens, we need to watch out for a short-selling counterattack and a sharp decline. The geopolitical situation is unstable. Bros must strictly control SL when trading independently.
🏅 Trading strategies:
BUY 3420-3402-3380
TP 3390-3400-3420-3460-3490
If you agree with this view, or have a better idea, please leave a message in the comment area. I look forward to hearing different voices.
OANDA:XAUUSD FX:XAUUSD FOREXCOM:XAUUSD FXOPEN:XAUUSD TVC:GOLD
GOLD GOLD ,the sudden rise in price from Asian session is driven by central bank purchase ,gold is heading to 3600 if 3400-3397 retest is successful .
the high of today 3444 on supply roof structure from the 3500 all time high, will need correction into demand floor where we look to unlock next wave of buy at 3400-3397 with the hope that 3500 is retested.
the dollar index 97.620 demand floor on retest bought and moved in the same direction with Gold by ignoring inverse correlation ,this price movement is reflecting fear, geopolitical tension ,economic instability and inflation concern in the global market.
the yesterday economic data print will be watched by feds
PPI (Producer Price Index) MoM: 0.1% (vs. 0.2% forecast, prior -0.5%).
Core PPI (ex-food/energy) MoM: 0.1% (vs. 0.3% forecast, prior -0.4%).
Unemployment Claims: 248K (vs. 242K forecast, prior 247K).
Headline CPI:
MoM: 0.1% (vs. 0.2% forecast, prior 0.2%).
YoY: 2.4% (vs. 2.5% forecast, prior 2.3%).
Core CPI (ex-food/energy):
MoM: 0.1% (vs. 0.3% forecast, prior 0.2%).
Despite softer inflation, unemployment held at 4.2% in May, and wage growth stayed elevated (3.9% YoY). This gives the Fed flexibility to prioritize inflation containment over premature easing.
Policy Implications:
Near-Term Hold: The Fed is almost certain to keep rates at 4.25–4.50% in June, aligning with its "higher for longer" stance.
The Fed will view May’s CPI as encouraging but insufficient to justify imminent rate cuts. While inflation moderation supports a dovish pivot later in 2025, policymakers will demand more evidence of sustained disinflation and clarity on tariff impacts before easing.
The Fed will use the datas as reinforcing evidence for rate cuts in 2025, but policymakers will likely wait for June CPI (July 11) and Q2 GDP before committing. While PPI and jobless claims suggest easing inflation and labor momentum, the Fed’s cautious stance on tariffs and services inflation means a September cut remains the baseline scenario, contingent on sustained disinflation.
#gold
Bullislh continuation?The Gold (XAU/USD) is falling towards the pivot which is a pullback support that aligns with the 23.6% Fibonacci retracement and could bounce to the 1st resistance that lines up with the 100% Fibonacci projection.
Pivot: 3,374.04
1st Support: 3,348.45
1st Resistance: 3,414.78
Risk Warning:
Trading Forex and CFDs carries a high level of risk to your capital and you should only trade with money you can afford to lose. Trading Forex and CFDs may not be suitable for all investors, so please ensure that you fully understand the risks involved and seek independent advice if necessary.
Disclaimer:
The above opinions given constitute general market commentary, and do not constitute the opinion or advice of IC Markets or any form of personal or investment advice.
Any opinions, news, research, analyses, prices, other information, or links to third-party sites contained on this website are provided on an "as-is" basis, are intended only to be informative, is not an advice nor a recommendation, nor research, or a record of our trading prices, or an offer of, or solicitation for a transaction in any financial instrument and thus should not be treated as such. The information provided does not involve any specific investment objectives, financial situation and needs of any specific person who may receive it. Please be aware, that past performance is not a reliable indicator of future performance and/or results. Past Performance or Forward-looking scenarios based upon the reasonable beliefs of the third-party provider are not a guarantee of future performance. Actual results may differ materially from those anticipated in forward-looking or past performance statements. IC Markets makes no representation or warranty and assumes no liability as to the accuracy or completeness of the information provided, nor any loss arising from any investment based on a recommendation, forecast or any information supplied by any third-party.
XAUUSD (Gold) Trade Alert Buy Entry Point: 3340XAUUSD (Gold) Trade Alert
Buy Entry Point: 3340
🎯 1st Target: 3350
🎯 2nd Target: 3360
🎯 3rd Target: 3370
🎯 Final Target: 3380
📈 We’re eyeing bullish momentum on Gold today!
🟢 Solid upward structure forming on higher timeframes.
📊 Trend supports a clean breakout toward 3380.
💹 Great R/R ratio for disciplined traders.
⚠️ Risk Management is KEY
🔒 Always use a proper stop-loss.
📍 Suggested SL below 3325
📉 Risk only 1–2% per trade.
📊 Don’t chase the market — wait for 3340 entry.
📅 Ideal for intraday or short swing trades.
🧠 Trade with logic, not emotion.
🛑 No trade is 100% — protect your capital.
💼 Stick to your plan, stay consistent.
✅ Let the setup come to you.
📢 Trade smart, not just fast!